US Debt Grew By 5.1%

Moody’s says that US debt continues to rise (with strongest growth in the public sector) and a powerful enough external shock could force U.S. benchmark interest rates up to levels that shrink business activity considerably.
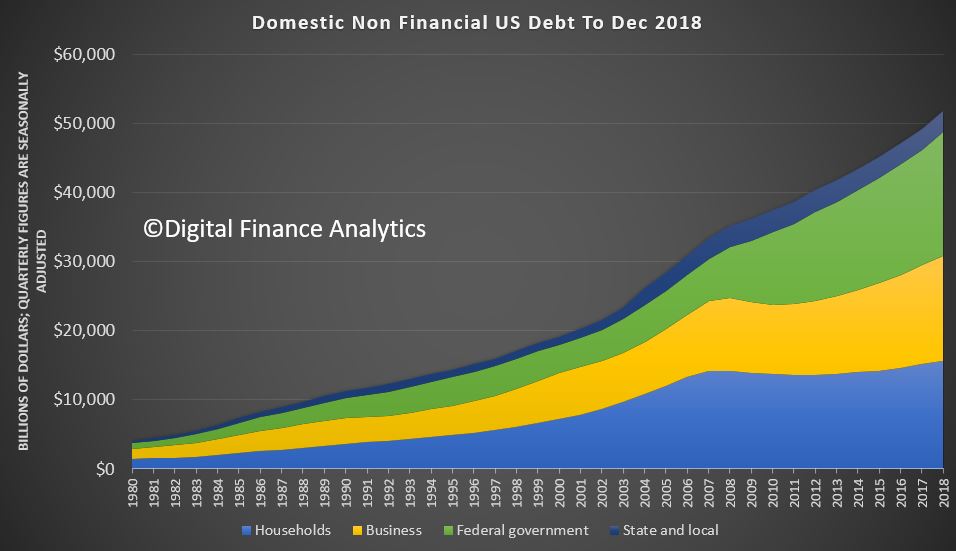
The latest version of the Federal Reserve’s “Financial Accounts of the United States” was released on March 7. As of 2018’s final quarter, the total outstandings of private and public nonfinancial-sector debt grew by 5.1% year-to-year to a record high $51.796 trillion. The year growth rate of the broadest estimate of U.S. nonfinancial-sector debt has slowed from second-quarter 2018’s current cycle high of 5.6%. Since the end of the Great Recession, the 3.9% average annualized rise by nonfinancial-sector debt
has slightly outpaced nominal GDP’s accompanying 3.7% average annual increase.

By contrast, during 2002-2007’s upturn, the 8.1% average annualized advance by nonfinancial-sector debt was much faster than nominal GDP’s comparably measured growth rate of 5.3%. As a result, the moving yearlong ratio of total nonfinancial-sector debt to GDP climbed from the 197% of 2001’s final quarter to the 225% of 2007’s final quarter. Because of the current recovery’s much slower growth of debt vis-a-vis GDP, debt barely rose from second-quarter 2009’s 243% to fourth-quarter 2018’s 249% of
GDP.
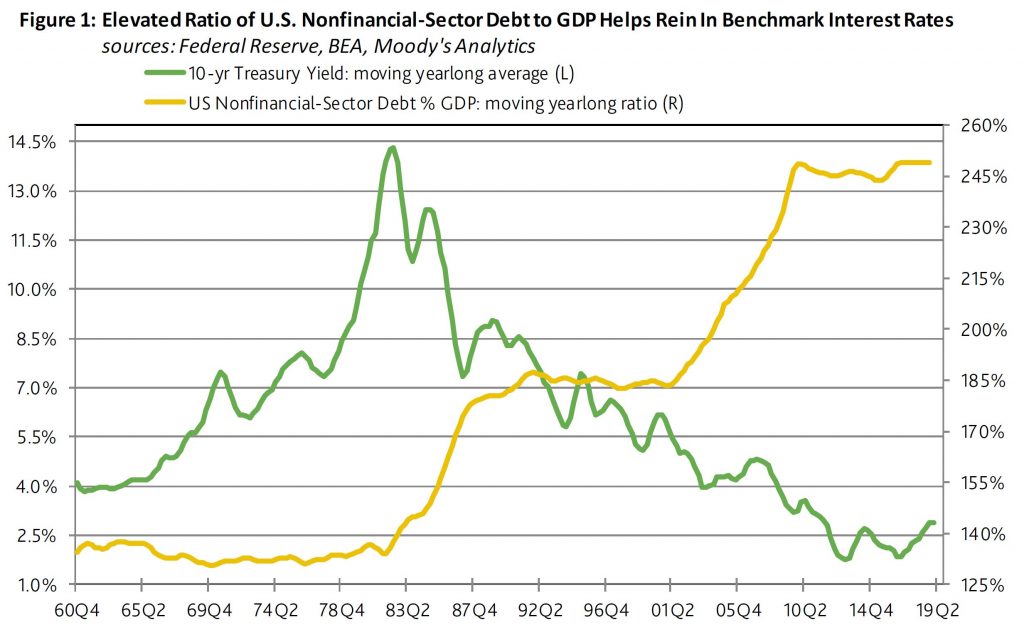
Today’s near record high ratio of nonfinancial-sector debt to GDP limits the upside for benchmark interest rates. Just as highly leveraged businesses exhibit a more pronounced sensitivity to higher benchmark interest rates, highly leveraged economies are likely to slow more quickly in response to an increase by benchmark rates. Relatively low interest rates do much to lessen the burden implicit to a comparatively high ratio of debt to GDP.

Nevertheless, a powerful enough external shock could force U.S. benchmark interest rates up to levels that shrink business activity considerably. Under this scenario the Fed would be compelled to hike rates in defense of the dollar exchange rate despite how a deterioration of domestic business conditions requires lower rates.

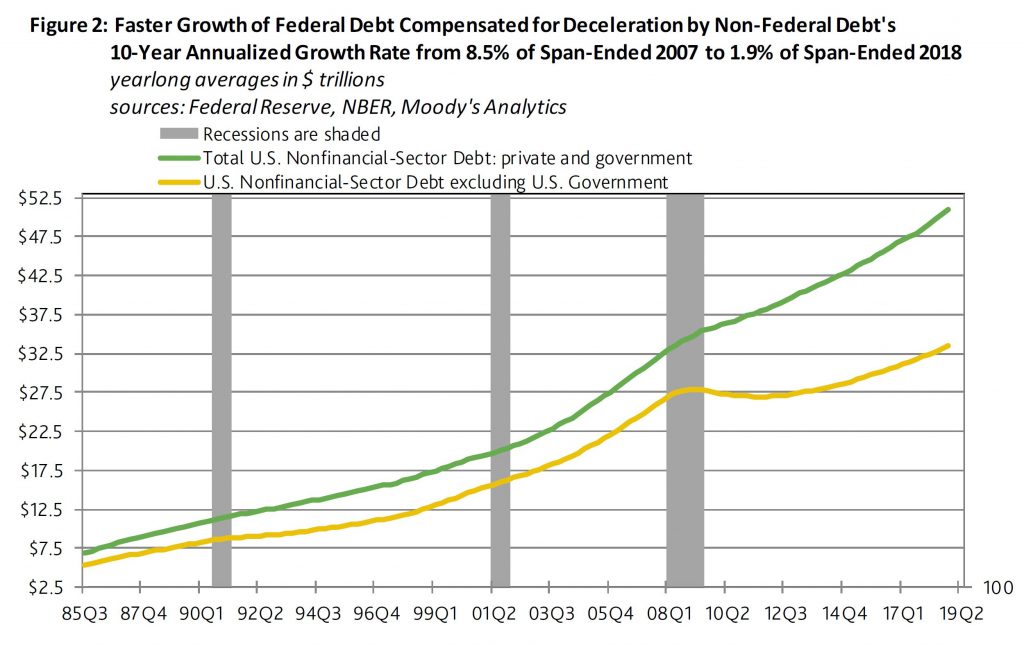
The federal government has dominated the growth of total nonfinancial-sector debt during the current business cycle upturn. In terms of moving yearlong averages, U.S. government debt’s 9.3% average annualized surge has well outrun the accompanying 2.2% growth rate for the sum of private and state and local government nonfinancial-sector debt.

Regarding 2018’s final quarter, the outstandings of U.S. government debt advanced by 7.6% annually to $217.865 trillion. By comparison, household-sector debt rose by 3.1% to $15.628 trillion, nonfinancial corporate debt increased by 6.5% to $9.759 trillion, unincorporated business debt grew by 4.9% to $5.485 trillion, while state and local government debt shrank by 1.7% to $3.060 trillion. Thus, fourth quarter 2081’s U.S. nonfinancial-sector debt excluding the obligations of the federal government grew by a modest 3.9% annually. Over the past 10-years, the faster growth of federal government debt compensated for the sluggish debt growth of non-federal borrowers.
US Jobs Surprise

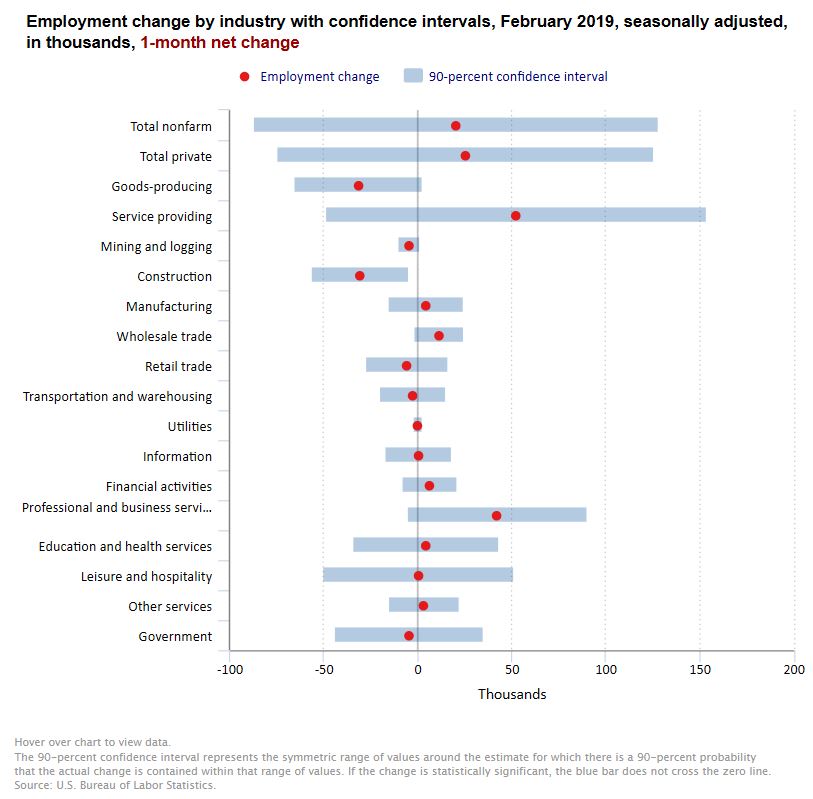
Total nonfarm payroll employment changed little in February (+20,000), and the unemployment rate declined to 3.8 percent, the U.S. Bureau of Labor Statistics reported. Employment in professional and business services, health care, and wholesale trade continued to trend up, while construction employment decreased.

The small rise in jobs was below expectations, but debate is raging as to whether this represents a glitch after the partial shutdown, or a sign of real weakness in the US economy. Either way, markets reacted negatively.

Household Survey Data

The unemployment rate declined by 0.2 percentage point to 3.8 percent in February, and the number of unemployed persons decreased by 300,000 to 6.2 million. Among the unemployed, the number of job losers and persons who completed temporary jobs (including people on temporary layoff) declined by 225,000. This decline reflects, in part, the return of federal workers who were furloughed in January due to the partial government shutdown.

Among the major worker groups, the unemployment rates for adult men (3.5 percent), Whites (3.3 percent), and Hispanics (4.3 percent) decreased in February. The jobless rates for adult women (3.4 percent), teenagers (13.4 percent), Blacks (7.0 percent), and Asians (3.1 percent) showed little or no change over the month.

In February, the number of long-term unemployed (those jobless for 27 weeks or more) was essentially unchanged at 1.3 million and accounted for 20.4 percent of the unemployed.

The labor force participation rate held at 63.2 percent in February and has changed little over the year. The employment-population ratio, at 60.7 percent, was unchanged over the month but was up by 0.3 percentage point over the year.

The number of persons employed part time for economic reasons (sometimes referred to as involuntary part-time workers) decreased by 837,000 to 4.3 million in February. This decline follows a sharp increase in January that may have resulted from the partial federal government shutdown. (Persons employed part time for economic reasons would have preferred full-time employment but were working part time because their
hours had been reduced or they were unable to find full-time jobs.)

In February, 1.4 million persons were marginally attached to the labor force, a decrease of 178,000 from a year earlier. (Data are not seasonally adjusted.) These individuals were not in the labor force, wanted and were available for work, and had looked for a job sometime in the last 12 months. They were not counted as unemployed because they had not searched for work in the 4 weeks preceding the survey.

Among the marginally attached, there were 428,000 discouraged workers in February, little changed from a year earlier. (Data are not seasonally adjusted.) Discouraged workers are persons not currently looking for work because they believe no jobs are available for them. The remaining 1.0 million persons marginally attached to the labor force in February had not searched for work for reasons such as school attendance or family responsibilities.

Establishment Survey Data

Total nonfarm payroll employment was little changed in February (+20,000), after increasing by 311,000 in January. In 2018, job growth averaged 223,000 per month.

In February, employment continued to trend up in professional and business services, health care, and wholesale trade, while construction employment declined.

In February, employment in professional and business services continued to trend up (+42,000), in line with its average monthly gain over the prior 12 months.

Health care added 21,000 jobs in February and 361,000 jobs over the year. Employment in ambulatory health care services edged up over the month (+16,000).

In February, wholesale trade employment continued its upward trend (+11,000). The industry has added 95,000 jobs over the year, largely among durable goods wholesalers.

Employment in construction declined by 31,000 in February, partially offsetting an increase of 53,000 in January. In February, employment declined in heavy and civil engineering construction (-13,000). Over the year, construction has added 223,000 jobs.

Manufacturing employment changed little in February (+4,000), after increasing by an average of 22,000 per month over the prior 12 months.

In February, employment in leisure and hospitality was unchanged, after posting job gains of 89,000 and 65,000 in January and December, respectively. Over the year, leisure and hospitality has added 410,000 jobs.

Employment in other major industries, including mining, retail trade, transportation and warehousing, information, financial activities, and government, showed little or no change over the month.

The average workweek for all employees on private nonfarm payrolls decreased by 0.1 hour to 34.4 hours in February. In manufacturing, the average workweek declined 0.1 hour to 40.7 hours, while overtime was unchanged at 3.5 hours. The average workweek for production and nonsupervisory employees on private nonfarm payrolls fell by 0.2
hour to 33.6 hours.

In February, average hourly earnings for all employees on private nonfarm payrolls rose by 11 cents to $27.66, following a 2-cent gain in January. Over the year, average hourly earnings have increased by 3.4 percent. Average hourly earnings of private-sector production and nonsupervisory employees increased by 8 cents to $23.18 in February

The change in total nonfarm payroll employment for December was revised up from +222,000 to +227,000, and the change for January was revised up from +304,000 to +311,000. With these revisions, employment gains in December and January combined were 12,000 more than previously reported. (Monthly revisions result from additional reports received from
businesses and government agencies since the last published estimates and from the recalculation of seasonal factors.) After revisions, job gains have averaged 186,000 per month over the last 3 months.

FED Holds Benchmark Rate, “Is Patient”

The US Federal Reserve kept rates on hold in today’s announcement. It also underscores its “patience” in terms of future movements, which is central bank speak suggests the current tightening cycle has ended for now. Plus we suspect the rate of QT will slow too, providing more support to the US economy. They are prepared to QE again if needed! The net result will be for more positive market movements, for now. They also reaffirmed inflation targeting is the core principle behind their management approach.

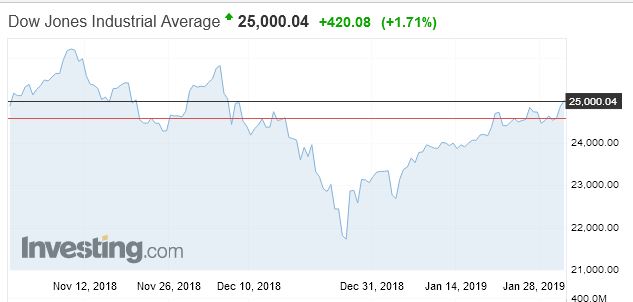
The Dow was higher (driven also by news from Apple, Boeing and China trade talks as well).

But the Fed also issued an “extra” comment:

After extensive deliberations and thorough review of experience to date, the Committee judges that it is appropriate at this time to provide additional information regarding its plans to implement monetary policy over the longer run. Additionally, the Committee is revising its earlier guidance regarding the conditions under which it could adjust the details of its balance sheet normalization program. Accordingly, all participants agreed to the following:

  • The Committee intends to continue to implement monetary policy in a regime in which an ample supply of reserves ensures that control over the level of the federal funds rate and other short-term interest rates is exercised primarily through the setting of the Federal Reserve’s administered rates, and in which active management of the supply of reserves is not required.
  • The Committee continues to view changes in the target range for the federal funds rate as its primary means of adjusting the stance of monetary policy. The Committee is prepared to adjust any of the details for completing balance sheet normalization in light of economic and financial developments. Moreover, the Committee would be prepared to use its full range of tools, including altering the size and composition of its balance sheet, if future economic conditions were to warrant a more accommodative monetary policy than can be achieved solely by reducing the federal funds rate.

Here is the general release:

Information received since the Federal Open Market Committee met in December indicates that the labor market has continued to strengthen and that economic activity has been rising at a solid rate. Job gains have been strong, on average, in recent months, and the unemployment rate has remained low. Household spending has continued to grow strongly, while growth of business fixed investment has moderated from its rapid pace earlier last year. On a 12-month basis, both overall inflation and inflation for items other than food and energy remain near 2 percent. Although market-based measures of inflation compensation have moved lower in recent months, survey-based measures of longer-term inflation expectations are little changed.

Consistent with its statutory mandate, the Committee seeks to foster maximum employment and price stability. In support of these goals, the Committee decided to maintain the target range for the federal funds rate at 2-1/4 to 2-1/2 percent. The Committee continues to view sustained expansion of economic activity, strong labor market conditions, and inflation near the Committee’s symmetric 2 percent objective as the most likely outcomes. In light of global economic and financial developments and muted inflation pressures, the Committee will be patient as it determines what future adjustments to the target range for the federal funds rate may be appropriate to support these outcomes.

In determining the timing and size of future adjustments to the target range for the federal funds rate, the Committee will assess realized and expected economic conditions relative to its maximum employment objective and its symmetric 2 percent inflation objective. This assessment will take into account a wide range of information, including measures of labor market conditions, indicators of inflation pressures and inflation expectations, and readings on financial and international developments.

Do Student Loans Cramp Home Ownership Rates For Young Adults?

In an article, released by the US FED via the first issue of Consumer & Community Context, they explore the impact that rising student loan debt levels may have on home ownership rates among young adults in the US. They suggest that higher debt overall helps to explain lower home ownership.

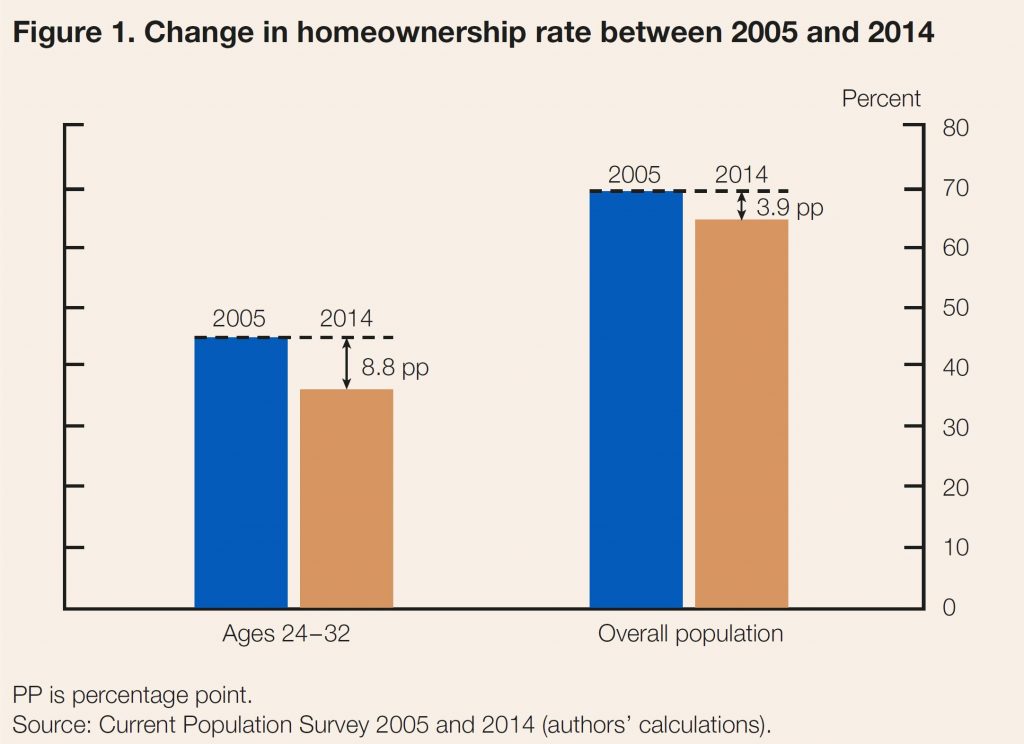
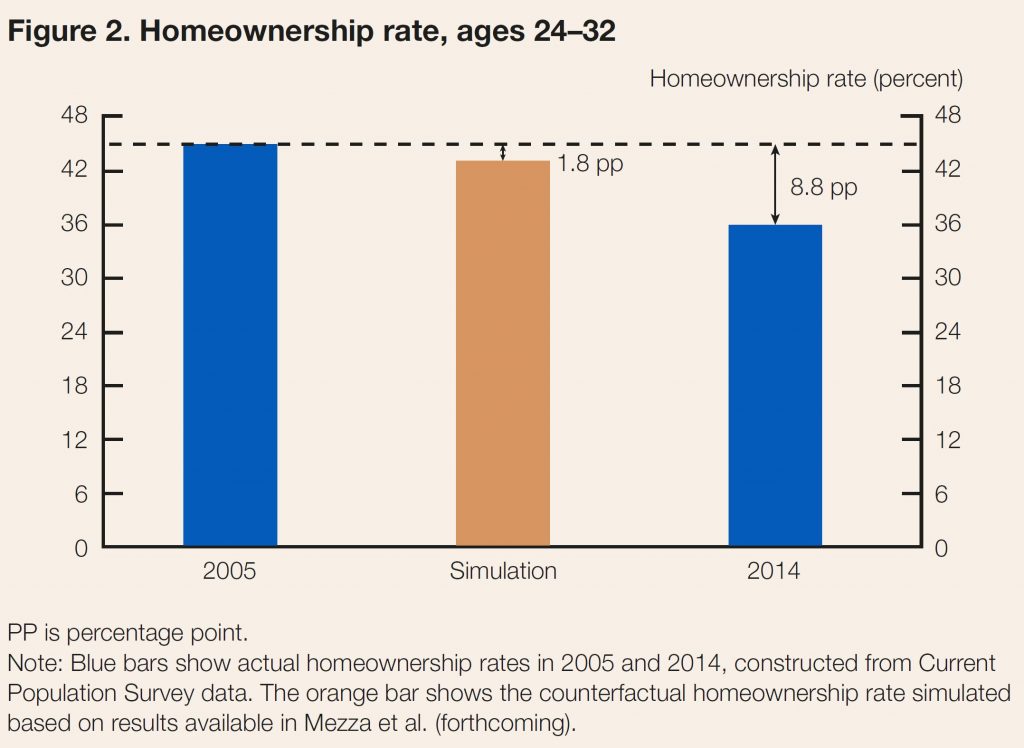
The home ownership rate in the United States fell approximately 4 percentage points in the wake of the financial crisis, from a peak of 69 percent in 2005 to 65 percent in 2014. The decline in home ownership was even more pronounced among young adults. Whereas 45 percent of household heads ages 24 to 32 in 2005 owned their own home, just 36 percent did in 2014—a marked 9 percentage point drop

While many factors have influenced the downward slide in the rate of home ownership, some believe that the historic levels of student loan debt have been particular impediments. Indeed, outstanding student loan balances have more than doubled in real terms (to about $1.5 trillion) in the last decade, with average real student loan debt per capita for individuals ages 24 to 32 rising from about $5,000 in 2005 to $10,000 in 2014.3 In surveys, young adults commonly report that their student loan debts are preventing them from buying a home.

They estimate that roughly 20 percent of the decline in home ownership among young adults can be attributed to their increased student loan debts since 2005. Our estimates suggest that increases in student loan debt are an important factor in explaining their lowered home ownership rates, but not the central cause of the decline.

Estimating the Effect of Student Loan Debt on Home ownership

The relationship between student loan debt and home ownership is complex. On the one hand, student loan payments may reduce an individual’s ability to save for a down payment or qualify for a mortgage. On the other hand, investments in higher education also, on average, result in higher earnings and lower rates of unemployment. As a result, it is not immediately clear whether, on balance, the impact of student loan debt on home ownership would be positive or negative.

Since we are interested in isolating the negative effect of increased student loan burdens on home ownership from the potential positive effect of additional education, our analysis aims to estimate the effect of debt on home ownership holding all other factors constant. In other words, if we were to compare two individuals who are otherwise identical in all aspects but the amount of accumulated student loan debt, how would we expect their home ownership outcomes to differ?

To estimate the effect of the increased student loan debt on home ownership, we tracked student loan and mortgage borrowing for individuals who were between 24 and 32 years old in 2005. Using these data, we constructed a model to estimate the impact of increased student loan borrowing on the likelihood of students becoming homeowners during this period of their lives. We found that a $1,000 increase in student loan debt (accumulated during the prime college-going years and measured in 2014 dollars) causes a 1 to 2 percentage point drop in the home ownership rate for student loan borrowers during their late 20s and early 30s. Our estimates suggest that student loan debt can be a meaningful barrier preventing young adults from owning a home. Next, we apply these estimates to another interesting question: How much of the 9 percentage point drop in the home ownership rate of 24 to 32 year olds between 2005 and 2014 can be attributed to rising student loan debt?

The Rise in Student Loan Debt and Decline in Home ownership since 2005
Answering this question requires two steps. First, we calculate an expected probability of home ownership in 2005 for each individual in our sample using the estimated model from our previous research. Second, we produce a simulated scenario for the probability of home ownership by increasing each individual’s debt to match the student loan debt distribution of this age group in 2014. The difference between the probabilities calculated in these two steps determines the effect of the increased debt on the home ownership rate of the young, holding demographic, educational, and economic characteristics fixed.

This exercise captures two key dimensions of the shifts in the distribution of student loan debt between 2005 and 2014, in addition to the overall increase in the average amounts borrowed. First, the fraction of young individuals who have borrowed to fund post secondary education with debt has increased by roughly 10 percentage points over this period, from 30 to 40 percent. Second, the amounts borrowed at the upper end of the distribution increased more rapidly than in the middle.

According to our calculations, the increase in student loan debt between 2005 and 2014 reduced the home ownership rate among young adults by 2 percentage points. The home ownership rate for this group fell 9 percentage points over this period (figure 2), implying that a little over 20 percent of the overall decline in home ownership among the young can be attributed to the rise in student loan debt. This represents over 400,000 young individuals who would have owned a home in 2014 had it not been for the rise in debt.

An important caveat to keep in mind when interpreting our estimates is the difference in mortgage market conditions before and after the financial crisis. The model used to develop these estimates was built using data for student loan borrowers who were between 24 and 32 years old in 2005, so a large fraction had made their home-buying decisions before 2008, when credit was relatively easier to obtain. Following the crisis, loan underwriting may have become more sensitive to student loan debt, increasing its importance in explaining declining home ownership rates.

Student Loan Debt May Have Even Broader Implications
for Consumers

There are multiple channels by which student loans can affect the ability of consumers to buy homes. One we would like to highlight here is the effect of student loan debt on credit scores. In our forthcoming paper, we show that higher student loan debt early in life leads to a lower credit score later in life, all else equal. We also find that, all else equal, increased student loan debt causes borrowers to be more likely to default on their student loan debt, which has a major adverse effect on their credit scores, thereby impacting their ability to qualify for a mortgage.

This finding has implications well beyond home ownership, as credit scores impact consumers’ access to and cost of nearly all kinds of credit, including auto loans and credit cards. While investing in post secondary education continues to yield, on average, positive and substantial returns, burdensome student loan debt levels may be lessening these benefits. As policymakers evaluate ways to aid student borrowers, they may wish to consider policies that reduce the cost of tuition, such as greater state government investment in public institutions, and ease the burden of student loan payments, such as more expansive use of income-driven repayment.


US Bank Stress Tests To Be Eased

On 9 January, Moody’s says, the Federal Reserve Board (Fed) proposed revisions to company-run stress testing requirements for Fed-regulated US banks to conform with the Economic Growth, Regulatory Relief, and Consumer Protection Act (the EGRRCPA), which became law in May 2018.

Among the revisions, which are similar to those proposed in December 2018 by the Office of the Comptroller of the Currency (OCC) and the Federal Deposit Insurance Corp. (FDIC), is a proposal that would eliminate the requirement for company-run stress tests at most bank subsidiaries with total consolidated assets of less than $250 billion. The proposed changes would be credit negative for affected US banks because they would ease the minimum requirements for stress testing at the subsidiary level.

The proposed revisions would also require company-run stress tests once every other year instead of annually at most banks with more than $250 billion in total assets that are not subsidiaries of systemically important bank holding companies. Additionally, the proposal would eliminate the hypothetical adverse scenario from all company-run stress tests and from the Fed’s own supervisory stress tests, commonly known as the Dodd-Frank Stress Test (DFAST) and the Comprehensive Capital Analysis and Review (CCAR); the baseline and severely adverse scenarios would remain.

The proposed changes aim to implement EGRRCPA. As such, we expect that they will be adopted with minimal revisions. In late December 2018, the FDIC and OCC published similar proposals governing the banks they regulate. The stress testing requirements imposed on US banks over the past decade have helped improve US banks’ risk management practices and have led banks to incorporate risk management considerations more fully into both their strategic planning and daily decision making. Without periodic stress tests, these US banks may have more flexibility to reduce their capital cushions, making them more vulnerable in an economic
downturn.

On 31 October 2018, the Fed announced a similar proposal for the company-run stress tests conducted by bank holding companies as a part of a broader proposal to tailor its enhanced supervisory framework for large bank holding companies. Positively, the Fed’s 31 October 2018 proposal would still subject bank holding companies with total assets of $100-$250 billion to supervisory stress testing at least every two years and would still require them to submit annual capital plans to the Fed, even though the latest proposal would no longer require their bank subsidiaries to conduct their own company-run stress tests. Also, supervisory stress testing for larger holding companies would continue to be conducted annually. Continued supervisory stress testing should limit any potential reduction
in capital cushions at those bank holding companies.

We believe that some midsize banks will continue to use company-run stress testing in some form, but more tailored to their own needs and assumptions. Nevertheless, this may not be the view of all banks, particularly those for which stress testing has not been integrated with risk management. Additionally, smaller banks may have resource constraints.

The reduced frequency of mandated company-run stress testing for bank subsidiaries with assets above $250 billion that are not subsidiaries of systemically important bank holding companies is also credit negative, although not to the same extent as the elimination of the requirement for the midsize banks. The longer time between bank management’s reviews of stress test results introduces a higher probability of changing economic conditions that could leave a firm with an insufficient capital cushion.

The Fed’s proposal also would eliminate the hypothetical adverse scenario from company-run stress tests and the Fed’s supervisory stress tests. The market has focused on the severely adverse scenario, which is harsher than the adverse scenario so this proposed change is unlikely to have significant consequence.

FED Announces 2018 Transfer to the US Treasury

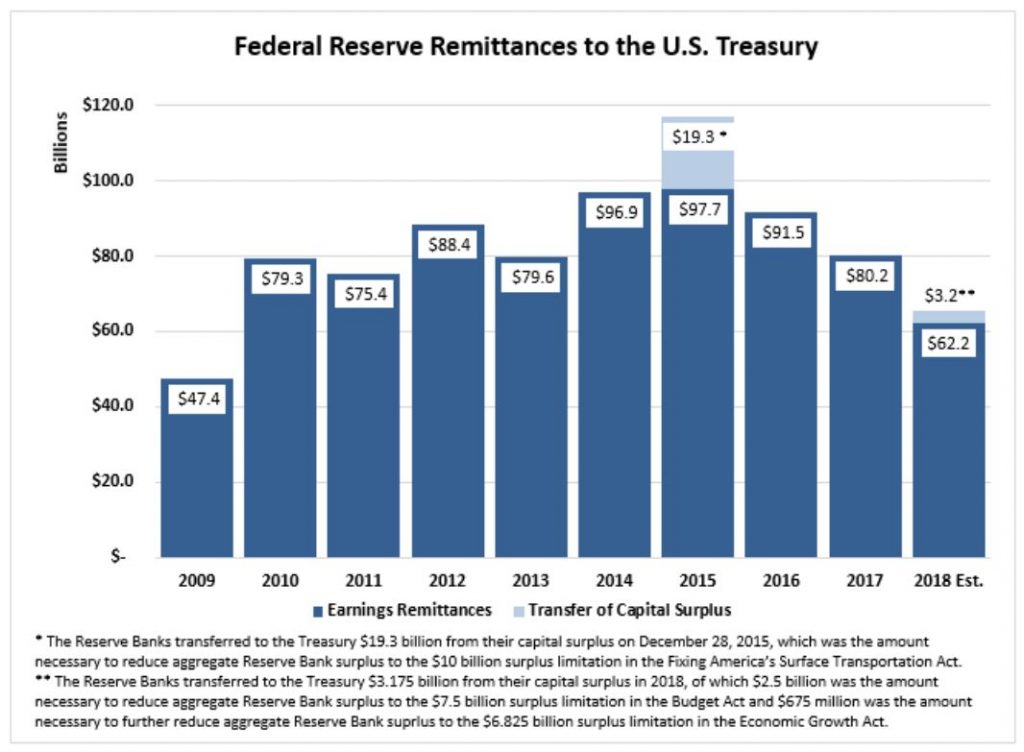
The Federal Reserve Board announced preliminary results indicating that the Reserve Banks provided for payments of approximately $65.4 billion of their estimated 2018 net income to the U.S. Treasury. The payments include two lump-sum payments totaling approximately $3.2 billion, necessary to reduce aggregate Reserve Bank capital surplus to $6.825 billion as required by the Bipartisan Budget Act of 2018 (Budget Act) and the Economic Growth, Regulatory Relief, and Consumer Protection Act (Economic Growth Act). The 2018 audited Reserve Bank financial statements are expected to be published in March and may include adjustments to these preliminary unaudited results.

The Federal Reserve Banks’ 2018 estimated net income of $63.1 billion represents a decrease of $17.6 billion from 2017, primarily attributable to an increase of $12.6 billion in interest expense associated with reserve balances held by depository institutions. Net income for 2018 was derived primarily from $112.3 billion in interest income on securities acquired through open market operations–U.S. Treasury securities, federal agency and government-sponsored enterprise (GSE) mortgage-backed securities, and GSE debt securities. The Federal Reserve Banks had interest expense of $38.5 billion primarily associated with reserve balances held by depository institutions, and incurred interest expense of $4.6 billion on securities sold under agreement to repurchase.

Operating expenses of the Reserve Banks, net of amounts reimbursed by the U.S. Treasury and other entities for services the Reserve Banks provided as fiscal agents, totaled $4.3 billion in 2018.

In addition, the Reserve Banks were assessed $849 million for the costs related to producing, issuing, and retiring currency, $838 million for Board expenditures, and $337 million to fund the operations of the Consumer Financial Protection Bureau. Additional earnings were derived from income from services of $444 million. Statutory dividends totaled $1 billion in 2018.

U.S. Government Shutdown Illustrates Policy Weakness

The continuing U.S. government shutdown highlights the periodic weakness in its budget policymaking, Fitch Ratings says. Shutdowns have not directly affected the country’s ‘AAA’/Stable sovereign rating but can signal that disputes on other issues are a constraint on fiscal policymaking.

The partial federal government shutdown that began Dec. 21 is now the longest since October 2013 (the longest shutdown lasted three weeks in 1995/1996). President Trump’s refusal to sign temporary spending bills that did not include USD5.6 billion for border wall funding and which included appropriations for other programs exceeding those in the president’s budget triggered the shutdown.

When and how the government will reopen remains unclear. The advent of a new Congress on Thursday saw a similar spending package passed by the House of Representatives, where the Democrats now have a majority. The package did not include additional wall funding, is opposed by the Trump administration and will not be taken up by the Senate. Some Republican senators have advocated passing a continuing resolution to reopen the government.

U.S. fiscal policymaking coherence can be weak relative to peers. The policymaking process at times has entailed shutdowns (there were two short-lived shutdowns earlier in 2018) and debt limit brinkmanship.

Shutdowns are much less of a risk to sovereign creditworthiness than debt limit impasses. The partial nature of the current shutdown, affecting around 25% of the federal government, should limit its economic impact, although this will increase depending on its length.

Nevertheless, the ongoing shutdown suggests that the current arrangement of political forces, following November’s midterm elections that resulted in a divided Congress, limits policy consistency. It also makes it unlikely in the near term that medium-term fiscal challenges, such as rising mandatory spending will be addressed.

The main implication for our U.S. sovereign credit view will depend on whether we feel this shutdown foreshadows a more pronounced destabilization of fiscal policymaking, including brinkmanship over the debt limit, which happened in October 2013. The debt limit is due to come back into force in March, although the Treasury would have several months during which it could operate under extraordinary measures. We view the risk of a failure to lift the debt limit in time to prevent a U.S. federal debt default as remote. House Democrats’ adoption of a new version of the so-called Gephardt rule, linking debt limit suspension to the approval of budget resolutions, could make debt limit impasses less likely.

Evidence of greater dysfunction in fiscal policymaking could still contribute to negative pressure on the U.S. rating. This is especially the case as deficits continue to increase (pro-cyclical fiscal stimulus in 2018 helped widen the federal deficit in the fiscal year Sept. 30 by 17% to USD779 billion) at a time when growth is likely to slow.

Democratic control of the House reduces the prospect of additional, large tax cuts over the next two years, although spending consolidation is also unlikely. Policies enacted by the new Congress could influence U.S. fiscal outturns, although we expect relatively limited impacts on our deficit forecasts. These include plans to reintroduce the ‘PAYGO’ budget rule mandating that any changes to legislation affecting mandatory spending do not increase budget deficits. Democrats have also said they will amend the rule that requires a three-fifths majority in the House of Representatives to raise income taxes.

Does A Flatter Yield Curve Signal An Imminent U.S. Recession?

The risk of an imminent U.S. recession remains low despite the recent flattening of the U.S. yield curve, Fitch Ratings says.

“The underlying recession signals traditionally embodied by a yield curve inversion, namely high policy interest rates relative to long-term expectations of policy rates, and falling bank profitability and credit availability, are absent. Yield-curve flattening does nevertheless emphasize that the U.S. economic cycle is in a late stage of expansion.

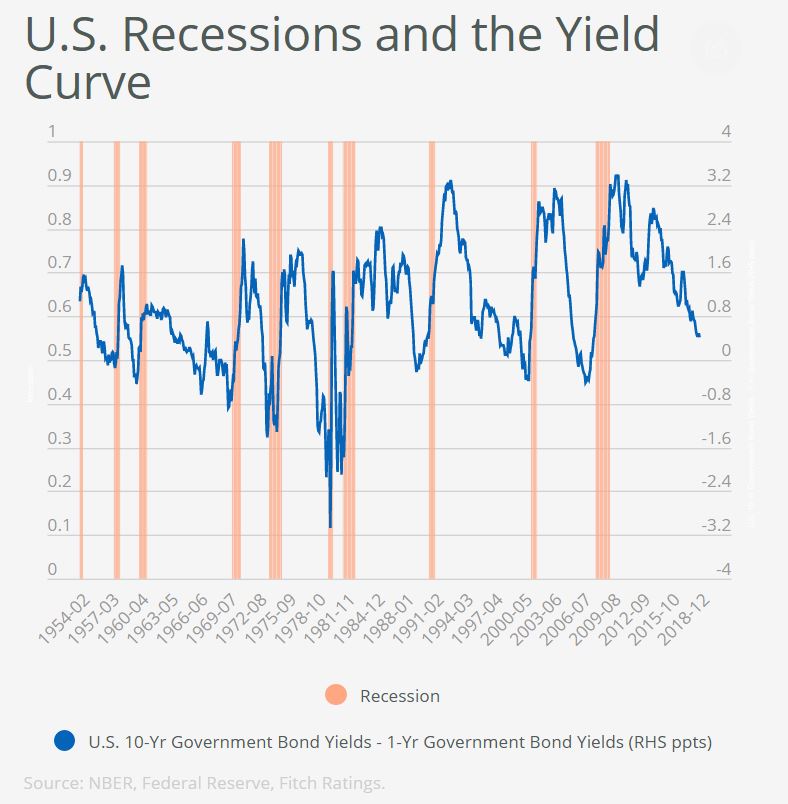
The yield curve has been a good lead indicator of U.S. recessions. Each of the past nine recessions were preceded by a yield curve inversion when 10-year yields fell below one-year yields. The recent narrowing of the 10-year minus one-year spread to its lowest level since summer 2007 has prompted a debate about potential economic implications.

The yield curve has not yet inverted except at some shorter tenors. Our Global Economic Outlook  forecasts suggest that to be unlikely. We forecast the U.S. 10-year yield to end this year at 3.1% from 2.85% today and predict a year-end Fed Funds rate of 2.5%. We also see both the Fed Funds rate and 10-year yields rising broadly in tandem through 2019. Even if the yield curve inverts, there are reasons to discount this as a ‘red flag.’

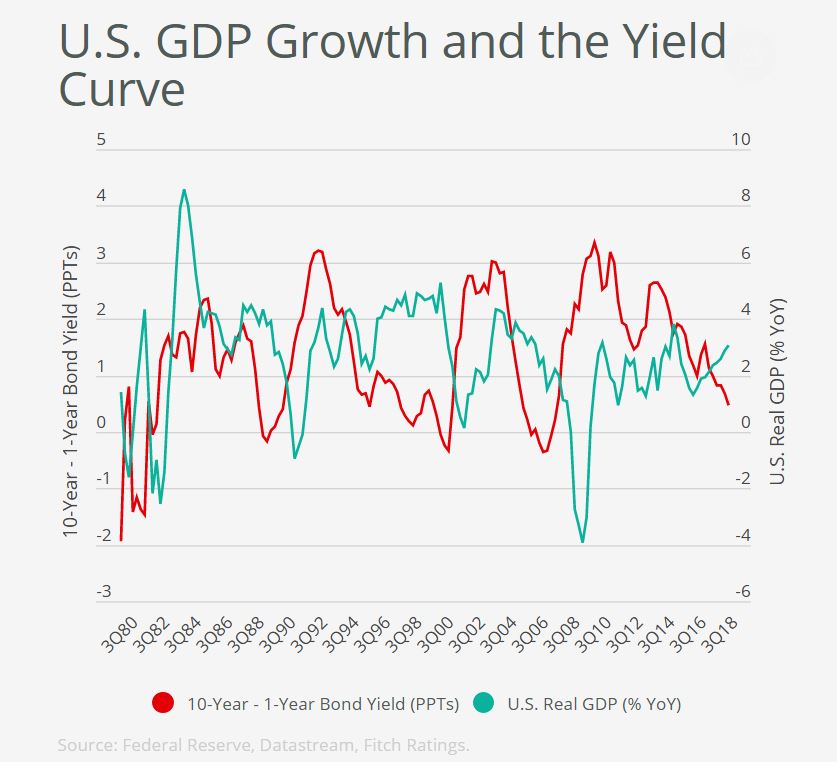
The historical time lags between inversion and recessions have been highly variable, from six months to up to two years. The correlation between the yield curve and GDP growth has been far from perfect. While each recession has been preceded by an inversion, not every inversion has been followed by a recession. The relationship through the mid-1990s was very poor. Since early 2010 there has been a steady flattening while U.S. growth has remained broadly stable.

The flattening since 2010 was associated with massive central bank bond buying under Quantitative Easing (QE) programs reducing long-term yields. While the Fed has started to gradually unwind its Treasury holdings, they remain huge and continue to suppress long-term yields. Ongoing QE purchases by the European Central Bank and Bank of Japan have also likely reduced U.S. bond yields, albeit indirectly.

These distortions to bond pricing reduce the value of the curve as an independent, market-based signal of the monetary policy stance. We do not believe that U.S. monetary policy is tight in an absolute sense, which would be the typical interpretation from a flat or inverted curve, reflecting current policy interest rates that are below levels expected in the long run. The Fed Funds rate is still quite close to zero in real terms despite inflation being close to target and unemployment below sustainable levels.

Bank profits are also traditionally thought to help explain the predictive power of the yield curve. Curve-flattening is generally perceived as compressing net-interest margins (NIM) and reducing banks’ willingness to lend. However, U.S. banks NIMs have risen steadily over the past three years, partly helped by changing balance sheet structures, and little evidence shows any deceleration in private credit or decline in banks’ willingness to lend. An inversion would limit the capacity for banks to further increase net-interest income but there is little evidence of this having happened so far.

Solid consumer income, private investment momentum and an aggressively expansionary fiscal stance should all support strong U.S. GDP growth in the next 12 months. Nevertheless, the flattening yield curve is consistent with the U.S. economy being at a late stage in the cycle, with an unusually long expansion to date and growth currently well above Fitch’s estimate of U.S. supply-side growth potential of 1.9% Fitch expects U.S. growth to tail off quite sharply in 2020 to 2.0% (from 2.9% in 2018) as macro policy support is removed and supply side constraints start to bind”.

US Agencies Seek To Weaken Mortgage Underwriting Standards

Three US agencies, the Board of Governors of the Federal Reserve System, Federal Deposit Insurance Corporation and Office of the Comptroller of the Currency have released a proposal seeking to lift the property value at which a full appraisal is required.

The three federal banking agencies announced they are seeking public comment on a proposal to raise the threshold for residential real estate transactions requiring an appraisal from $250,000 to $400,000. The appraisal threshold has remained unchanged since 1994, and the agencies believe an increase would provide burden relief without posing a threat to the safety and soundness of financial institutions.

All three agencies have approved the proposal, with the FDIC and the OCC acting on November 20. Comments will be accepted until 60 days after publication in the Federal Register.

Rather than requiring an appraisal for transactions exempted by the threshold, the proposal would require the use of an evaluation consistent with safe and sound banking practices. Evaluations provide an estimate of the market value of real estate but could be less burdensome than appraisals because the agencies’ appraisal regulations do not require evaluations to be prepared by state licensed or certified appraisers. In addition, evaluations are typically less detailed and costly than appraisals. Evaluations have been required for transactions exempted from the appraisal requirement by the current residential threshold since the 1990s.

This proposal responds, in part, to comments the agencies received during their recent review of regulations that the current exemption level for residential transactions had not kept pace with price appreciation.

Additionally, the proposal would incorporate the appraisal exemption for rural residential properties provided by the Economic Growth, Regulatory Relief and Consumer Protection Act and similarly require evaluations for these transactions. In addition, the proposal would require institutions to appropriately review all appraisals required by the agencies’ appraisal rules to ensure their compliance with appraisal industry standards.