Operation Housing Mincemeat!

The desperate quest for housing is playing out across Australia, with renters fighting to find an affordable place, and being confronted with significant rent hikes, while others are trying to buy their way into the property market, despite tight lending conditions, and are fighting directly with some property investors who are still hoovering up more property as well as new migrants who are still arriving in their thousands. It’s a mess, and many are getting crusted in the process.

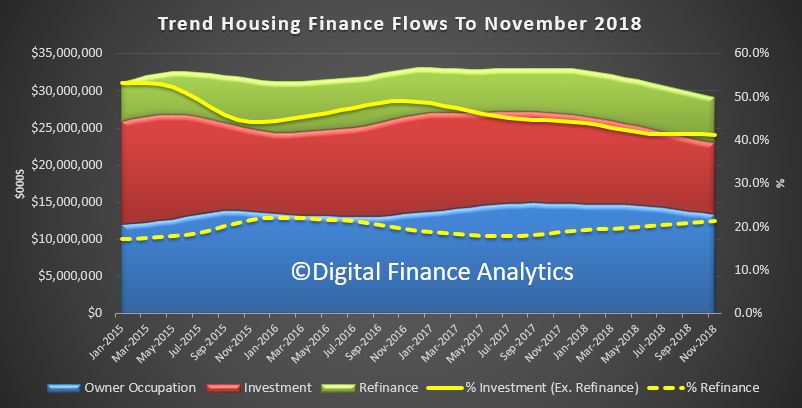
So, the latest data underscores the issue as the ABS released their lending indicators on Thursday, and they reported that for total housing new loan volumes fell 3.9% to $25.1b, after a fall of 4.1% in December. But it was still 8.5% higher compared to a year ago. Incomes of course are not growing at anything like that!

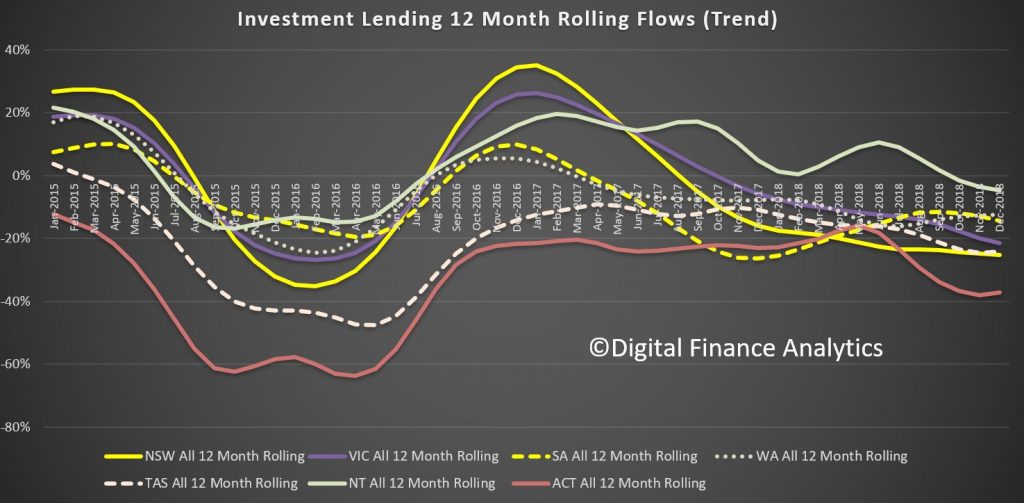
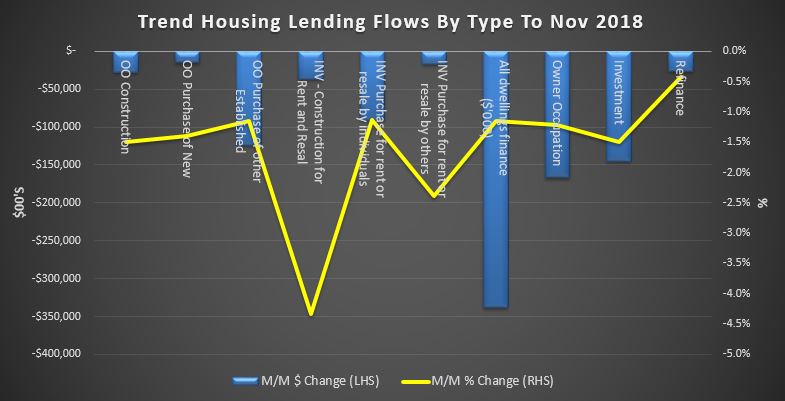
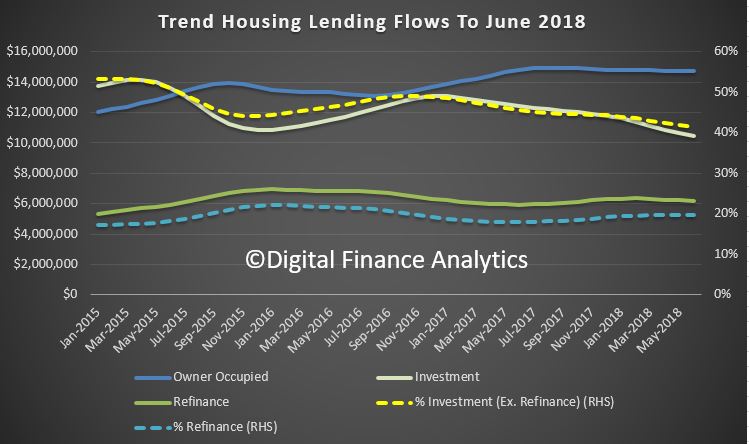
Within that, the total for owner-occupier housing fell 4.6% to $15.9b but was 3.4% higher compared to a year ago, while for investor housing new loans fell 2.6% to $9.2b but was 18.5% higher compared to a year ago.

The mortgage cliff, where cheap sub-2% loans were reset to much higher rates is coming towards the end of the road, although CBA also warned on Wednesday that debts servicing costs will continue to rise as the remaining cheap pandemic fixed rate mortgages reset to variable. And some of the cheapest fixes are yet to expire, according to my surveys. In addition, some cheap deals seem to have been extended on their original terms for some borrowers so the funding pressures will remain.

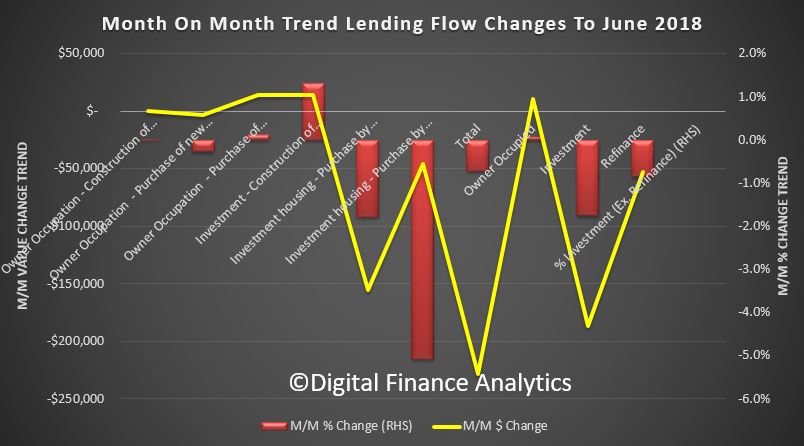
All up, the ABS said In January 2024 in seasonally adjusted terms, the value of external refinancing for total housing fell 5.0% to $16.1b and was 19.5% lower compared to a year ago, while for owner-occupier housing new loans fell 7.4% to $10.3b and was 24.3% lower compared to a year ago and for investor housing they fell fell 0.5% to $5.8b and was 9.1% lower compared to a year ago. One reason apart from the cliff problem is that lenders have reduced competitive cashback offers.

http://www.martinnorth.com/

Go to the Walk The World Universe at https://walktheworld.com.au/

Today’s post is brought to you by Ribbon Property Consultants.

Digital Finance Analytics (DFA) Blog
Operation Housing Mincemeat!
Loading
/

Mortgage Rate Rises Are Ahead

I caught up with Peter Marshall from comparison site Mozo.

He has been working in the Australian banking and finance industry for over 20 years and oversees Mozo’s extensive product database. He is regularly sought out for his expert commentary and analysis on banking and interest rates trends by print, radio and TV media.

Today we discuss the prospect of higher mortgage rates ahead and what people can do to prepare.

https://mozo.com.au/authors/peter-marshall

Go to the Walk The World Universe at https://walktheworld.com.au/

We Are Dancing To The RBA’s Tune… [Podcast]

We review the latest data from the RBA and APRA on lending and loan deferrals.

The latest edition of our finance and property news digest with a distinctively Australian flavour.

Go to the Walk The World Universe at https://walktheworld.com.au/

Live stream on Tuesday: https://youtu.be/pjxfUECUlLE

Digital Finance Analytics (DFA) Blog
We Are Dancing To The RBA's Tune... [Podcast]
Loading
/

Lending to households falls 2.4 per cent

The value of new lending commitments to households fell 2.4 per cent in January 2019, seasonally adjusted, according to the latest Australian Bureau of Statistics (ABS) figures on new lending to households and businesses.

The fall in lending to households in January follows a revised 3.6 per cent monthly fall in December 2018.

ABS Chief Economist, Bruce Hockman said: “Weaker lending for dwellings (-2.1 per cent) again drove much of the overall fall in lending to households, with further falls in lending for investment dwellings (-4.1 per cent) and for owner occupier dwellings (-1.3 per cent) in January.”

“Reflecting the impact of both supply and demand side factors, new lending for dwellings is down over 20 per cent from January 2018, the largest through the year decline since late 2008.”, he said.

This weaker lending activity was evident across the states and territories in January, with new lending for investment dwellings down in all states and territories. Only Queensland and the Northern Territory recorded rises in lending for owner occupier dwellings.

While there was also a fall in the number of loans to owner occupier first home buyers (-0.3 per cent) in January, this was more stable than the 3.2% fall in the number of loans to owner occupier non-first home buyers.

Lending to households for personal finance (up 1.2 per cent) was the only household lending category to record a rise in January, however new lending is down 16.0 per cent compared to January 2018, seasonally adjusted. The value of lending to households for refinancing fell 3.4 per cent.

In trend terms, the value of new lending commitments to businesses fell 1.3 per cent in January, but is up 2.5 per cent from January 2018.

Down, Down, Lending Is Down!

The ABS has released the first in its new combined series of household and business finance –  “ 5601.0 – Lending to households and businesses, Australia, Dec 2018″.

The new data required a rebuild of our analytics, but it is very clear that the rate of growth of new credit continues to ease across the board. The focus of the release is credit flows, the rate of new loans being written. The RBA of course reports the stock at the economy level, and APRA the Bank (ADI) stock. Today we look at the flow data.

Owner Occupied lending flows fell by 1.59% from November to December, down $310 million dollars. Investment lending fell 1.6%, down $125 million dollars and personal credit fell 1.17%, down $68 million dollars. Total credit flows to households fell 1.52% down $506 million dollars. Business credit flows fell 2.55%, down $866 million dollars and total credit flows dropped 2.03% by $1.38 billion dollars, to $66.5 billion dollars.

The share of investment loan flows for residential property was 28.5% of housing flows, and lending for business fell to 50.6% of all credit flows.

The credit impulse (the rate of change of credit growth) continues to ease, which signals a weaker economy, and lower home prices ahead. Significantly, owner occupied lending is slowing faster than investor lending now.

Within the housing categories the rolling 12 month growth rates in credit flows shows that owner occupied construction are down 16.7%, finance for new builds is down 14,2%, finance for established property is down 14.3% and refinanced loans is down 10.9% over 12 months. New investment loan flows fell 3.4% and refinanced investor loans was down 21.3%, which is a significant drop. These are the factors which feed into my overall home price models, and this downward momentum of the credit impulse is highly significant, and why I am looking for more home price falls ahead. Note again, its the owner occupied sector on the slide, not just property investors!

We can look at credit flows for investor purposes across the states. NSW is down more than 25%, VIC down 21.5%, SA down 14%, WA down 12% TAS down 24%, NT down 4.7% and ACT down a massive 37%; all over the past 12 months.

First time buyers continue at a lower rate as our tracker shows, with 17.7% of new loans for first time buyers, down from 18.3% last month, a drop of 1,976 transactions compared with last month, to 8,517.

In addition the number of first time property investor buyers dropped again.

The average loan size for a first time buyer fell to $337,260, indicating tighter lending standards, while other loans were bigger at $397,404.

Finally, personal credit flows were down again, with new revolving loans especially hard hit.

The Credit Tide Is Receding

In conclusion, there is nothing in this data to suggest increased momentum in credit, but then this is in December, and before the APRA statement that lending standards will remain tight (7% hurdle rate applies) and the Royal Commission left responsible lending rules where they were.

My conclusion is that the credit impulse will continue to slow. This will have a flow on effect to home prices and household consumption. The decade of credit driven expansion looks to be over for now. The problem is of course this will lead to weaker economic out-turns ahead, and falling home prices.

That said, credit is still growing unsustainably faster than income or inflation with housing credit at 4.9% growth over 12 month. But the rate of growth, as we showed here is easing back.

And I do not think the credit tap will be opened up “to 11” again anytime soon. Welcome to a new, but uncomfortable normal. One in which those with loans they should never have had in the first place continue to struggle with them, and new borrowers, should they chose to borrow, will need to jump through a whole series of higher hoops.

20-30% peak to trough falls in home prices anyone?

Housing Credit Growth Continues To Wane; Prices Will Follow

The ABS released their housing finance data to end November 2018. The trend estimate for the total value of dwelling finance commitments excluding alterations and additions fell 1.1%, or $338 million to $29.2 billion dollars. Owner occupied housing, excluding refinance fell 1.2% or $167 million to $13.4 billion and investment housing commitments fell 1.5%, or $145 million to $9.5 billion dollars. Refinanced loans were down 0.4% or $26 million to $6.2 billion. In trend terms, the number of commitments for owner occupied housing finance fell 0.2% in November 2018.

In trend terms, the number of commitments for the construction of dwellings fell 0.9%, the number of commitments for the purchase of new dwellings fell 0.6% and the number of commitments for the purchase of established dwellings fell 0.1%.

Looking in more detail at the movements, Owner Occupied construction fell 1.5%, down $28 million to $1.8 billion, the purchase of new owner occupied property fell 1.4% or $14.9 million, to $1 billion dollars. The owner occupied purchase of existing dwellings fell 1.2% or $123 million to $10.6 billion dollars. Investment construction fell 4.3% or $36 million to $0.8 billion dollars, investment purchases by individuals fell 1.1% or $90 million to $7.9 billion dollars and investment by other entities including self managed super funds fell 2.4% or $17 million to $0.71 billion dollars.

In original terms, the number of first home buyer commitments as a percentage of total owner occupied housing finance commitments rose to 18.3% in November 2018 from 18.1% in October 2018. In November 10,493 first time buyers purchased, 356 more than in the previous month.

The number of first time investors continues to fall, as measured by our surveys, with just 350 transaction written in the month, compared with 2,760 a year ago.

The month on month data shows the relative changes across the categories. Turning to the original stock data, we see total loans growing by 0.5% in the month with investor lending down to 33.26% of all loans. Total ADI loans stood at $1.17 trillion dollars, withe owner occupied loans at $1.1 trillion dollars and investment lending at $0.56 trillion dollars.

One final cut of the data is to look across the states – here we look at total owner occupied lending. We see a significant fall in NSW and VIC plus QLD, offset only a little by rises in TAS, ACT and SA. This in a nutshell explains why total credit is falling. Frankly the major markets of Sydney and Melbourne set to tone for the entire economy! We do not expect these falls to reverse anytime soon, and as credit drives home prices, the falls will continue. Recent APRA easing will have only small impact.

Finally, note that the ABS says November 2018 is the final issue of the Housing Finance, Australia (5609.0) and Lending Finance, Australia (5671.0) publications. Both publications will be combined into a single, simpler publication called Lending to Households and Businesses, Australia (5601.0).

Housing Lending Flows Contract In September

Further evidence in the lending slow down came through in spades today with the ABS releasing their housing finance statistics to September 2018.

Looking at the trend flows first, new lending for owner occupation fell 1.7% compared with last month, down $235 million to $13.78 billion.  Investment lending flows fell 0.8%, down $69 million to $8.96 billion, and owner occupied refinanced loans were flat at $6.24 billion.

Refinanced loans as a proportion of all flows rose to 20.8% and we continue to see this sector of the market the main battleground for lenders who are trying to attract lower risk existing borrowers with keen rates. Investment loans, were 39.4% of all new loans, up again from last month as owner occupied lending demand eases.

Looking at all the categories of loans month on month, we see lending for owner occupied construction down 1.2%, lending for the purchase of new dwellings down 2.2%, lending for the purchase of other existing dwellings down 1.7%, while investment lending for the construction of new property fell 2.5%, investment property for individuals fell 0.6% and investment lending for other entities, such as self managed super funds, dropped 2.2%. As a result total flows were down 1.1% compared with last month.

First time buyers were also down in number in September, falling by 8.8% to 8,693 new loans.  This was 18% of all loans, up from 17.8% last month.

Looking at the individual elements, overall first time buyers were down, although overall more loans were written with a fixed rate, in response to the battery of cheap rate deals which were on offer.

Our first time buyer tracker shows the lower trends, especially as the number of new first time buyer property investors continue to slide.

Finally, the overall loan stock rose in the month, in original terms, with owner occupied loans up 0.3% or $3.4 billion, and investment loans were flat, giving a total of $1.68 trillion, up 0.2%, and continuing the slowing trends.

We think lending growth will continue to slow, as prices fall further, and lending standards continue to tighten. Whilst some slack is being taken up by the non-bank sector, reduced credit means lower home prices ahead. We are entering the danger zone.

More Negative Lending Indicators

The ABS has released their data to July 2018 for Housing Finance.  Investors continue to fee the market, and even first time buyers are getting twitchy, while refinancing transactions props up the numbers a little. All as expected, and this underscore more falls in lending flow, and home prices ahead. The rate of decline is increasing.  Loan stock grew 0.26% in the month, but that was in the owner occupied segment. Investor loan stock fell.

The trend estimate for the total value of dwelling finance commitments excluding alterations and additions fell 0.6%. Owner occupied housing commitments was flat, while investment housing commitments fell 1.7%.

As a result the proportion of loan flows for investment property purposes continues to drift lower to 32.7%, the lowest in recent years, while there was no change in owner occupied lending and refinance rose just a little to 20%.

In trend terms, the number of commitments for the purchase of new dwellings fell 1.8%, the number of commitments for the purchase of established dwellings fell 0.2%, while the number of commitments for the construction of dwellings rose 0.2%. In fact that was the only positive indicator!

In trend terms,  overall, the number of commitments for owner occupied housing finance fell 0.2% in July 2018.

In original terms, the number of first home buyer commitments as a percentage of total owner occupied housing finance commitments fell to 18.0% in July 2018 from 18.1% in June 2018.

The number of FTB loans for owner occupied borrowers rose by around 50.  There was a small rise in the number of fixed loans, and the average FTB loan fell by $4,000 perhaps indicating tighter borrowing terms.

The number of FTB investors continues to fall away in line with the broader trends in the investor sector.

All this points to a continued tightening of lending standards and a likley continued decline in loan volumes – which is also a leading indicator of more home price falls ahead.


June Home Lending Flows Take A Dive

The ABS released their Housing Finance data to June 2018 today.

They reported that the trend estimate for the total value of dwelling finance commitments excluding alterations and additions fell 0.7%. Owner occupied housing commitments fell 0.2% and investment housing commitments fell 1.8%. In seasonally adjusted terms, the total value of dwelling finance commitments excluding alterations and additions fell 1.6%.

The proportion of loans for investment purposes, excluding refinance, was 41.4%, down from 53% in 2015. The proportion of refinanced owner occupied loans was 19.7%, similar to the past couple of months.

Looking at the changes month on month, owner occupied purchase of new dwellings fell 0.3%, while owner occupied purchase of established dwellings rose 0.1%, or $14,2 million.  Investment construction  lending rose 1.3%, or $14 million, borrowing for investment purposes by individuals fell 1.8%, down $154 million and investment by other entities fell 5.1% of $45.7 million. Refinance of owner occupied loans fell 0.9% or $53 million.

Overall around $31 billion of loan flows were written, down 0.7% in trend terms.

In original terms, the number of first home buyer commitments as a percentage of total owner occupied housing finance commitments rose to 18.1% in June 2018 from 17.6% in May 2018.

The number of loans fell 762 compared to last month, to 9,541. Within that we still some rises in NSW and VIC compared with a year ago, thanks to the recent FTB grants.  The proportion of loans written at fixed rates fell again.

Out First Time Buyer Tracker, which includes an estimate of first time buyers going direct to the investment sector continued at a low level, compared with a year ago.

Two final slides, first the original data showing the portfolio of loans outstanding at the banks registered an overall rise of $8 billion, and a fall in the proportion of loans for investment purposes to 33.7%, the lowest level for several years.

And the mix across states of owner occupied loans shows the strongest growth in Tasmania and Queensland, and falls in loan volumes most announced in ACT and Western Australia.

So the tighter lending conditions continue to bit, with investors less likely to get a loan. Some of this relates to demand (or lack of it) but also is being driven by the tighter lending requirements.

This is clearly seen in our surveys, where the number of rejected applications have risen significantly. This is especially true for those seeking to refinance an existing loan, including interest only loans.

The net portfolio growth, of around $9 billion, or 0.5% in the month in original terms, so overall lending remains quite strong, despite the weaker flows.