Following our recent update on household mortgage stress, it’s important to broaden our scope into other areas of household financial stress. Just as mortgage defaults rise, power disconnections rise too.
In this report Mitch Grande examines the evidence. Mitchell is a recent Graduate of Politics, Philosophy, Economics (Honours) at the University of Wollongong and is concerned with Australian public policy, and especially energy policy.
Disconnections:
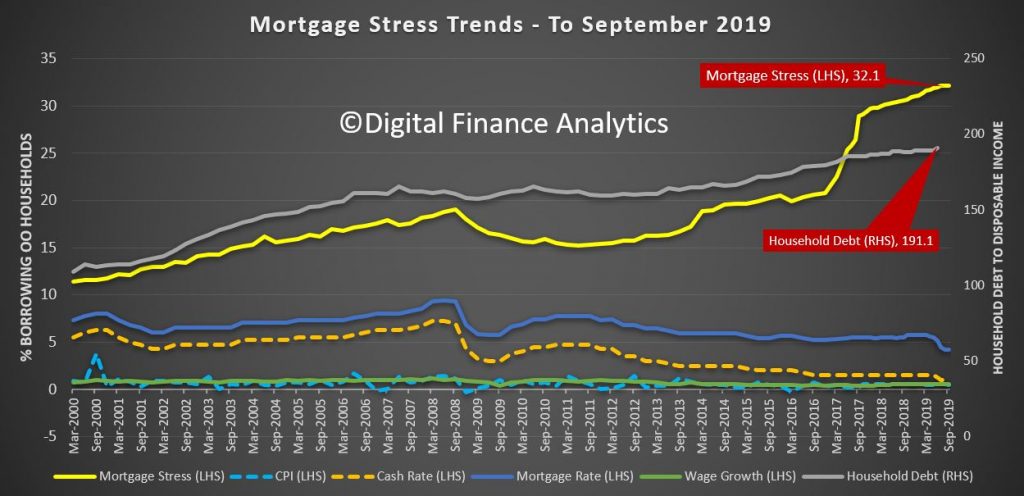
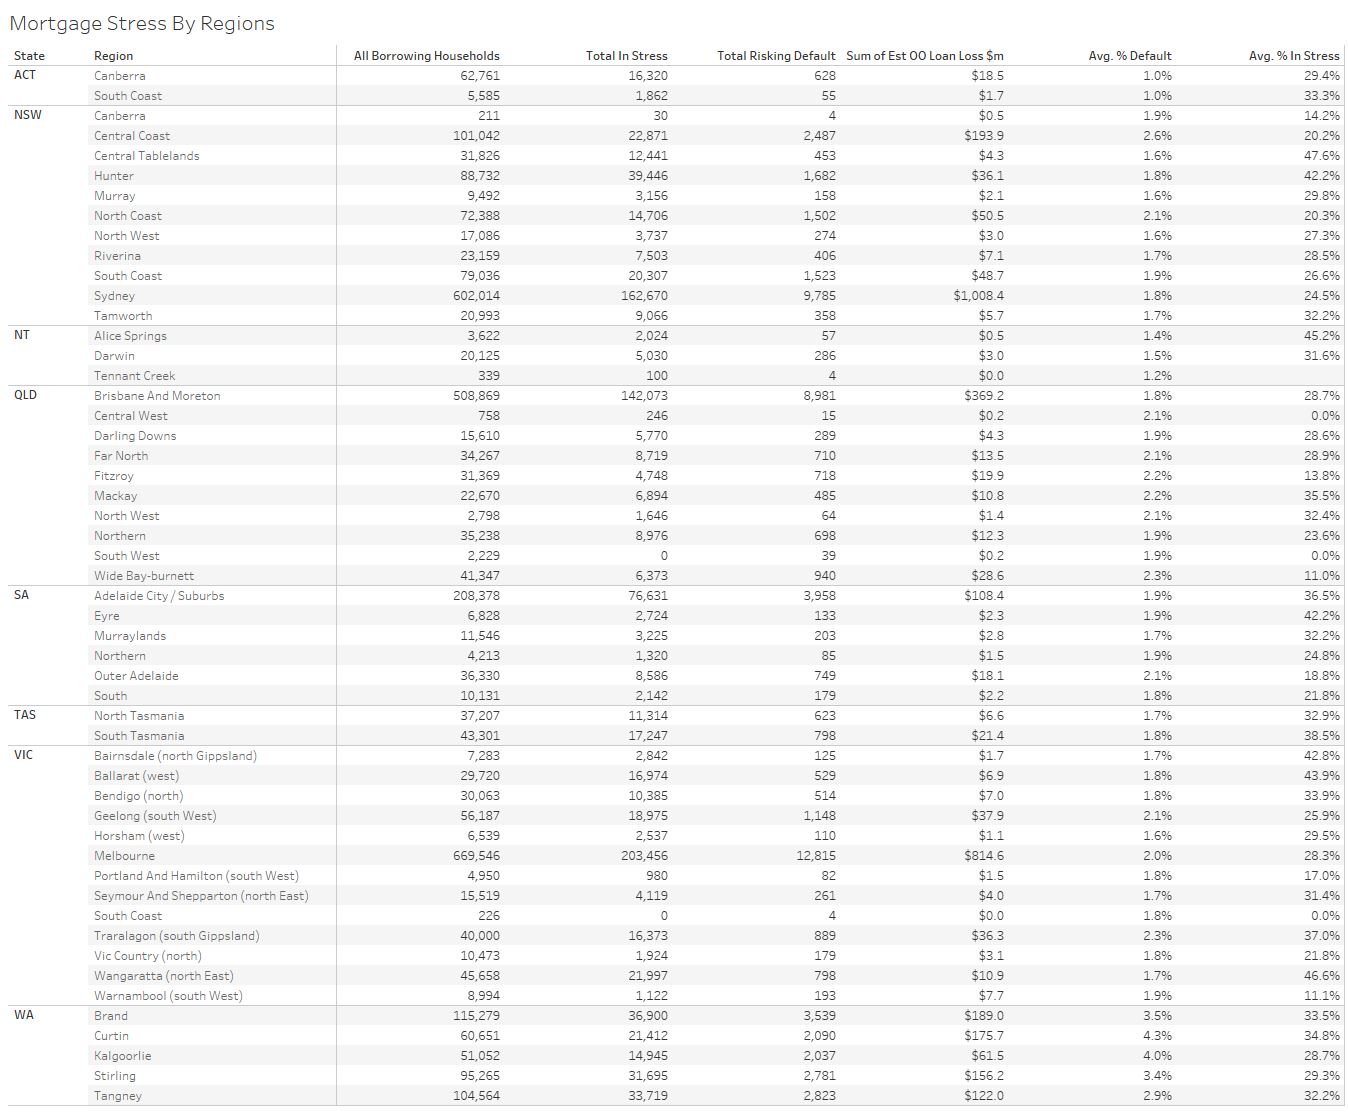
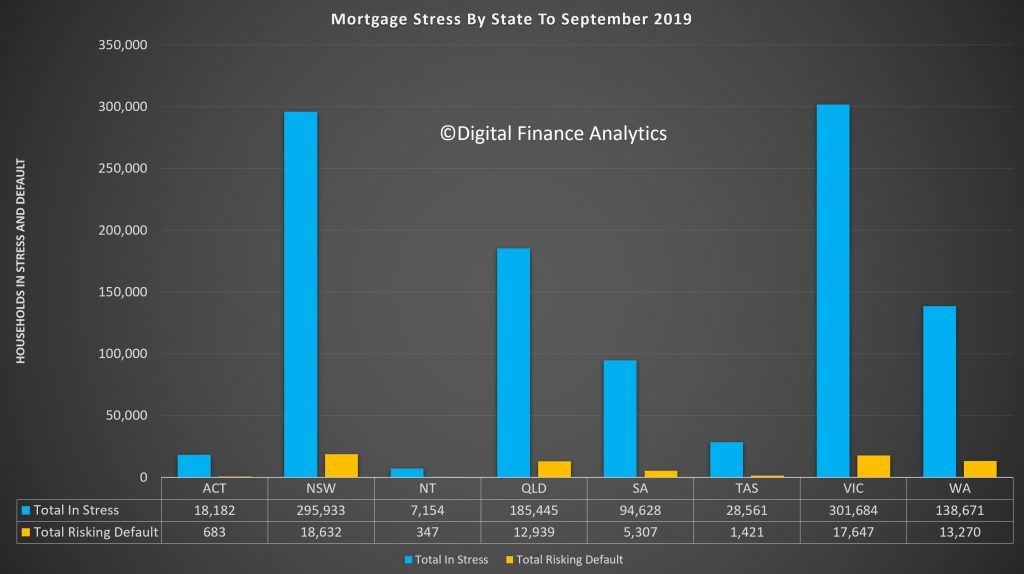
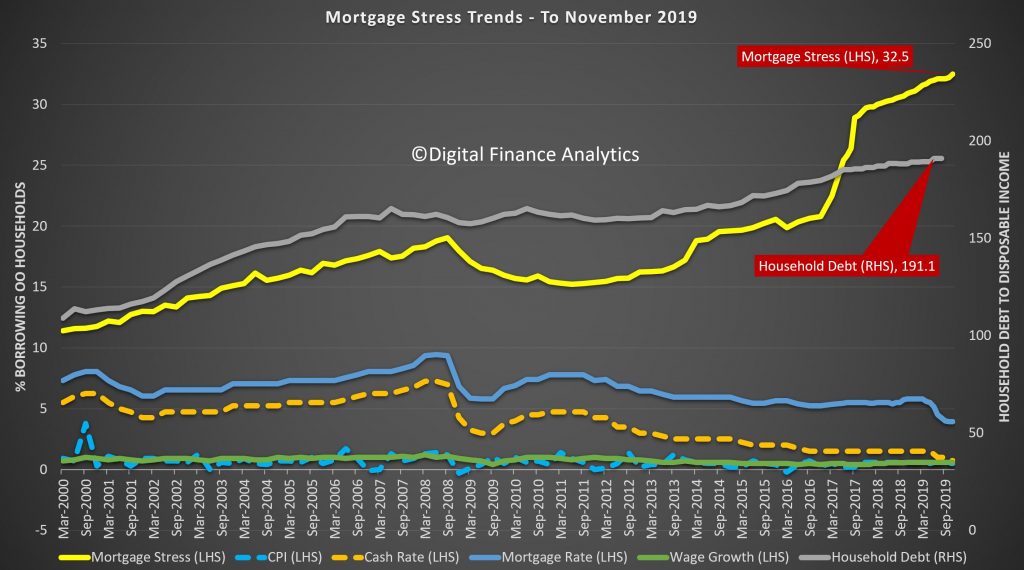
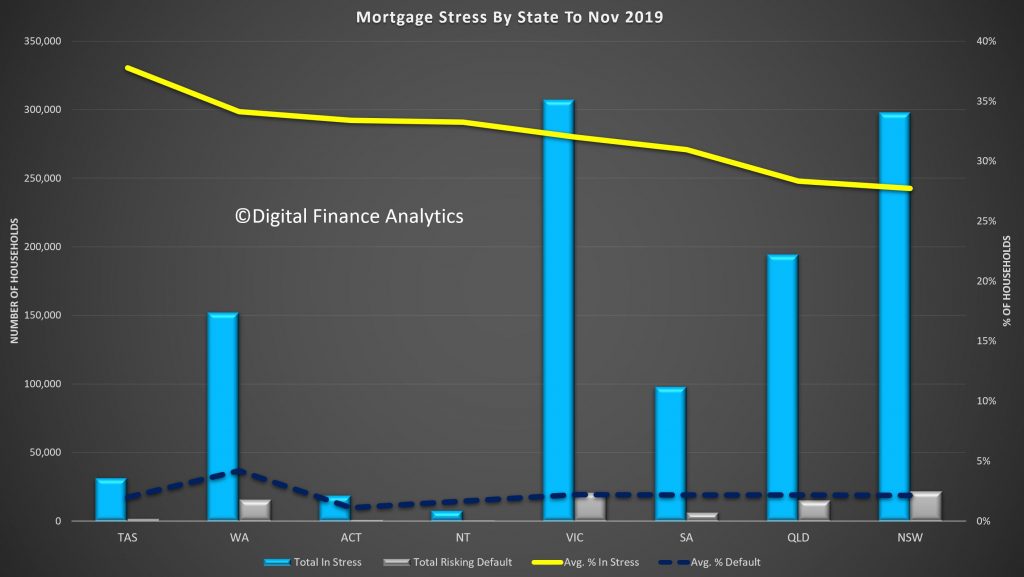
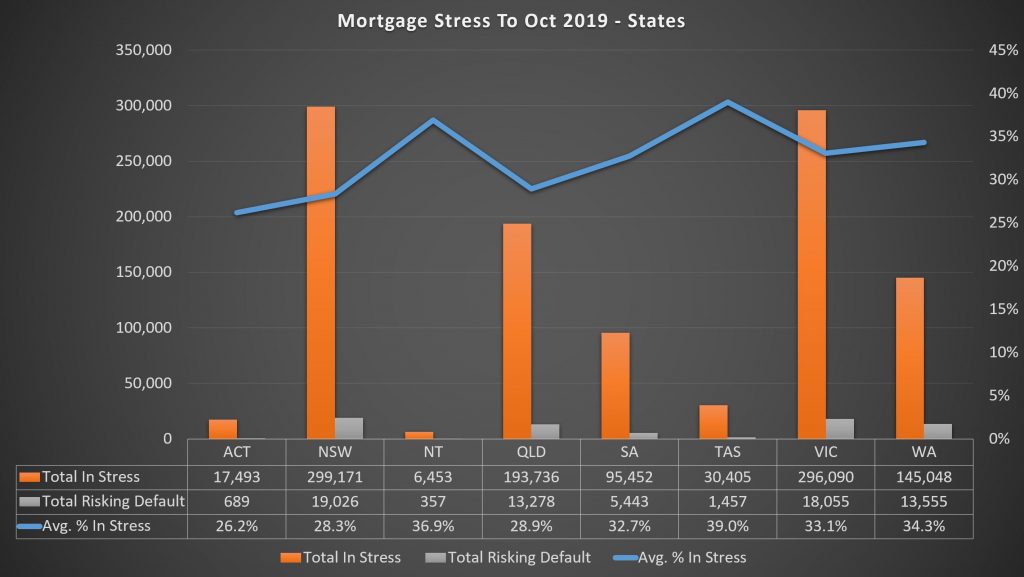
The ABC recently published an article on Western Australia’s record number of households having their power shut off. For measure, WA’s mortgage stress has reached 34.3% (145,000), as local economic conditions continue to deteriorate. We suspect mortgage stress is well correlated with households being disconnected from their power supply and compounding cost of living pressures through power bills.
The
article spoke of one 1 in 60 WA households being cut off following unpaid
bills. WA’s state-corporations and largest retailers, Synergy and Horizon
Power, stated that over 22,000 customers had their power shut off in the past
year. This is a two-fold increase in state disconnections in the last three
years. The article cites year-on-year increases to the average WA electricity
bill of +11% (2017), +7% (2018), and +1.75% (2019); while salaries at best
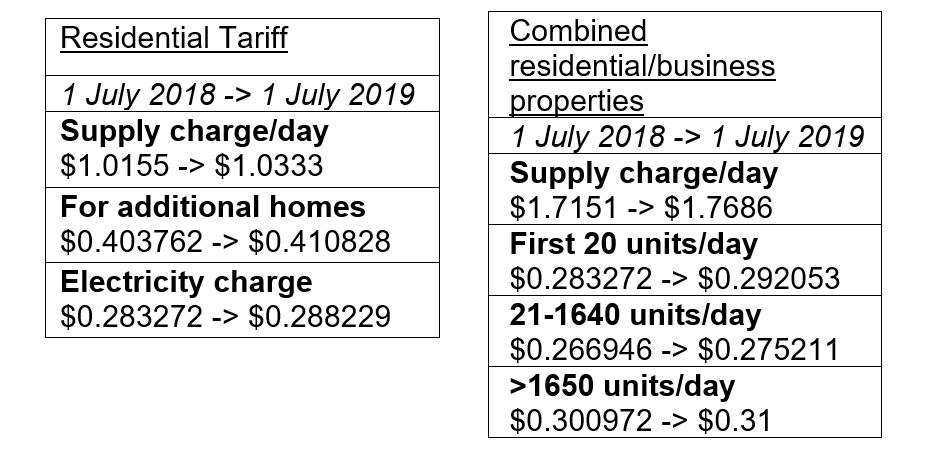
increased +1%. It is important to note that WA is not included in National
Energy Market operations and trading, and as such, the government regulates
Synergy and Horizon Power’s prices of residential and larger customers, setting
the fees and charges annually in the budget. Most recent changes are as follows:
Other research on household energy stress by Alviss consulting with St Vincent de Paul, which does not include Western Australia, examined disconnection data for Victoria, New South Wales, Queensland, and South Australia. In short, their research found many regional and rural hubs at risk, as these postcodes, especially in the last three years, have experienced the most disconnections. The reason behind the regional cost profile is burgeoning network costs, with polls and wires being old, inconsistent, and ‘gold-plated’ over much longer distances than metro customers.
The Alviss report categorises two types of disconnections: raised disconnections and completed disconnections. However, the ABC report on WA only speaks to “power being shut off”, so it is hard to compare the data uniformly. Nevertheless both reveal the same story of financial hardship in small rural postcodes, perhaps struggling with the agrarian shift and general economic stressors of poor revenue poor wages, high costs, and burdens. Both the ABC article and Alviss report speak to these at-risk households entering stress spirals, in which regional folk are ‘too proud to seek help’ in either welfare or drug and alcohol abuse.
The average postcode profile consisted of lower local incomes, higher unemployment rates, and relatively more housing affordability issues. A such, the average at risk household was demographically older, had less economic opportunities, and lower incomes.
State-by-state the Alviss report found that:
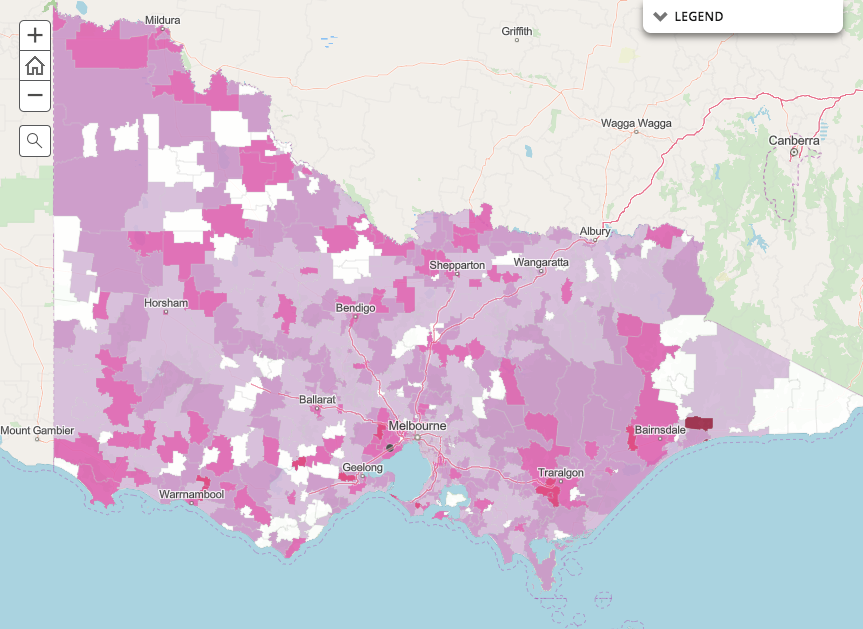
- Victoria had 43.8% of reported customers face raised and/or completed disconnections.
- Werribee (3030) topped the table with 10,424 raised and 5,097 completed.
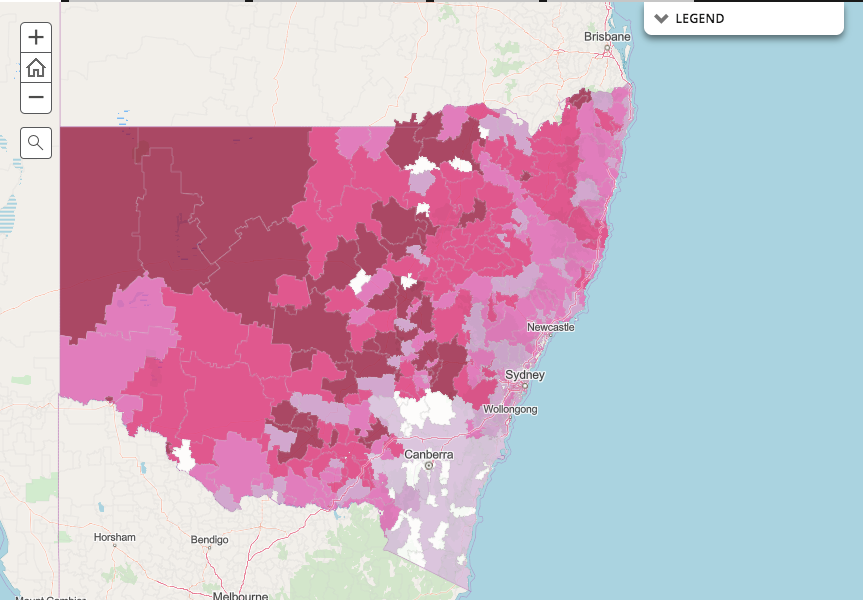
- NSW had 36.7% of its customers face raised and/or completed disconnections.
- Orange (2800) had the most with 17,902 raised and 6,435 completed.
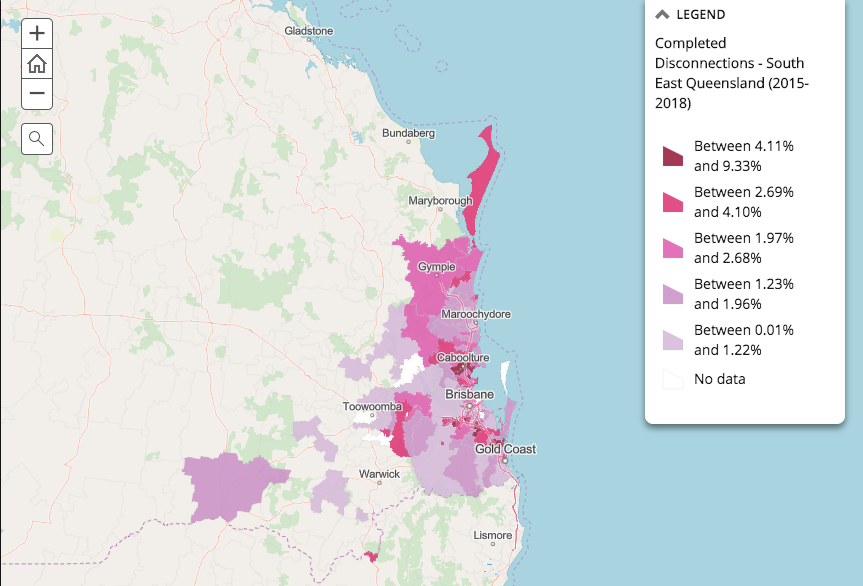
- South East QLD had 30.3% of its customers face raised and/or completed disconnections.
- Caboolture (4510) had 7,587 raised and 2,541 completed.
- But Logan (4114) had the highest completed with 2,552 of 7,152 raised.
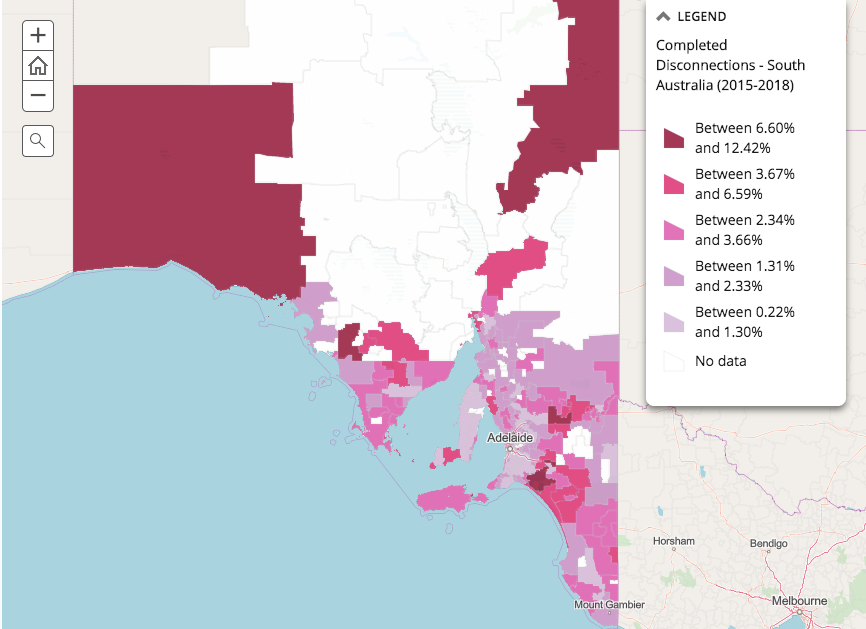
- SA had 30.2% of its customers face raised and/or completed disconnections.
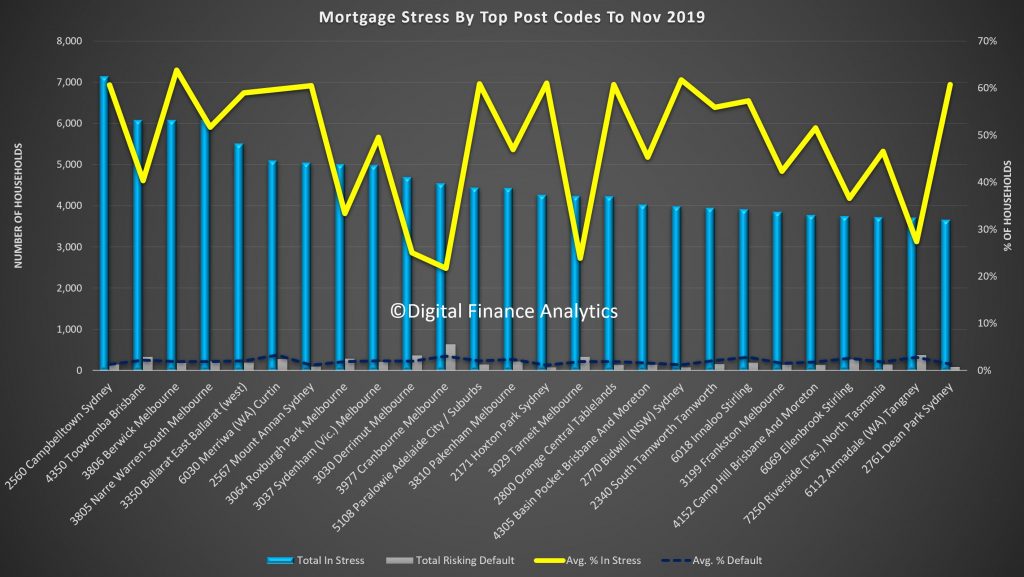
- Salisbury (5108) had 3,956 raised and 952 completed.
- But Elizabeth North (5113) had highest completed with 1,524 of 3,953 raised.
- This points to larger lingering issues in SA in which more than 10 of the top 30 disconnected postcodes are middle suburbs (5085, 5112, 5113, and 5114).
The higher completion of disconnection rates reflects far greater then understood financial hardship, retailers more readily disconnecting households, and networks being more readily and efficiently able to disconnect consumers. Here at DFA we have the data available to investigate this financial hardship, through the survey data on mortgage stress.
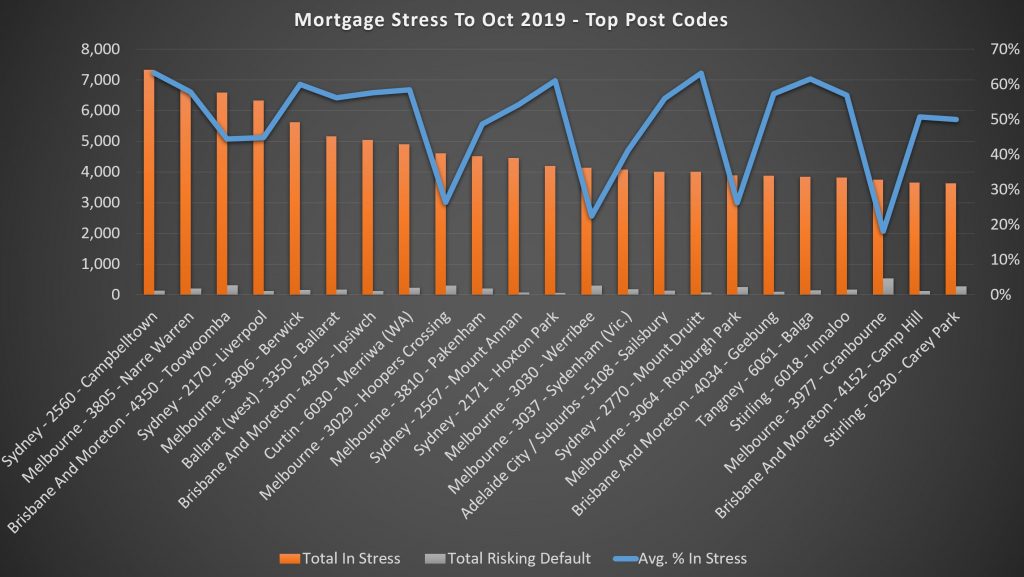
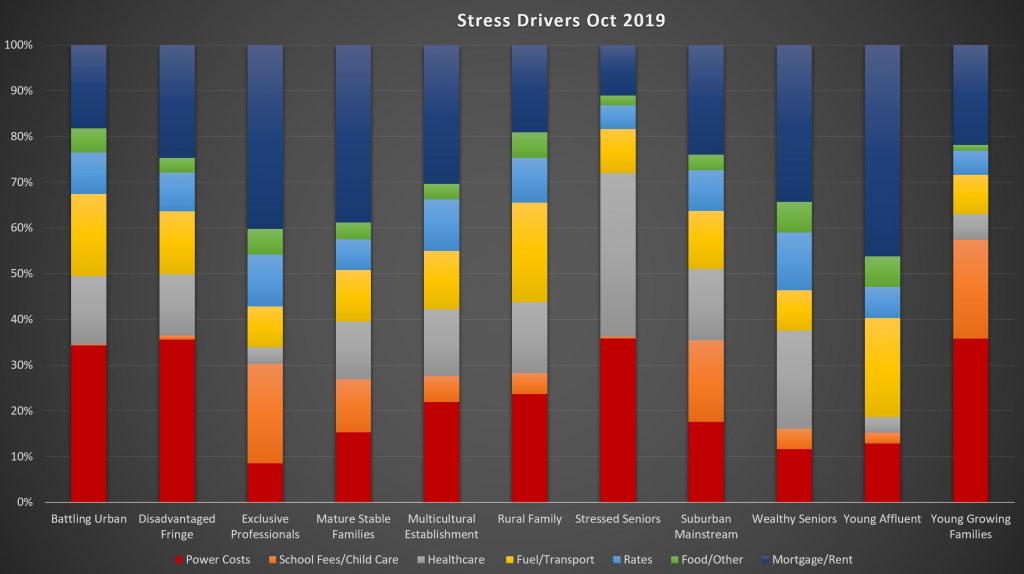
DFA survey data breakdown:
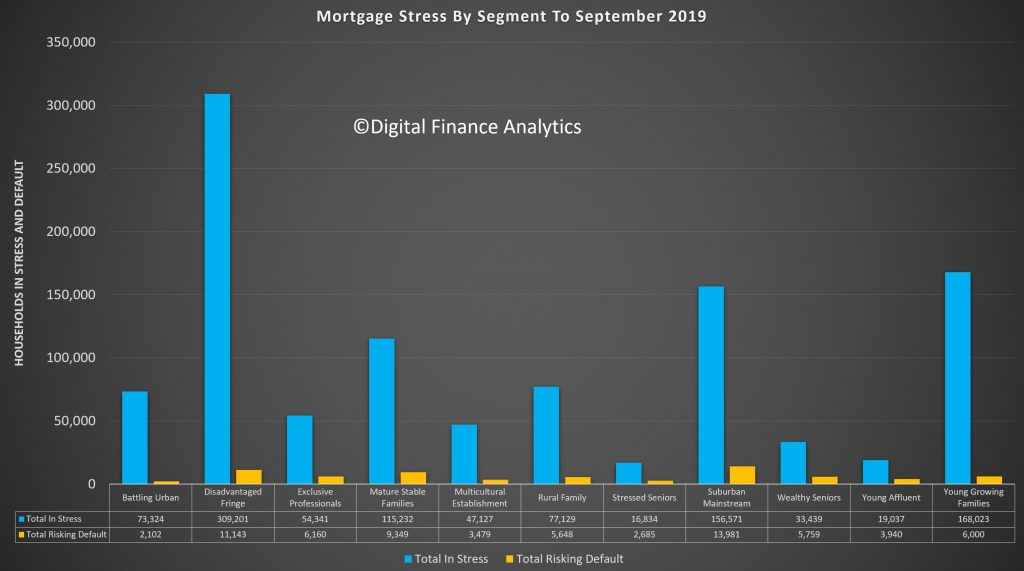
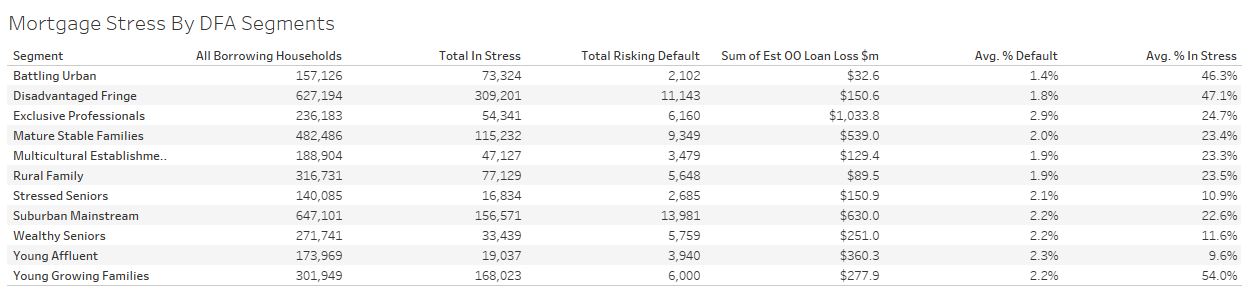
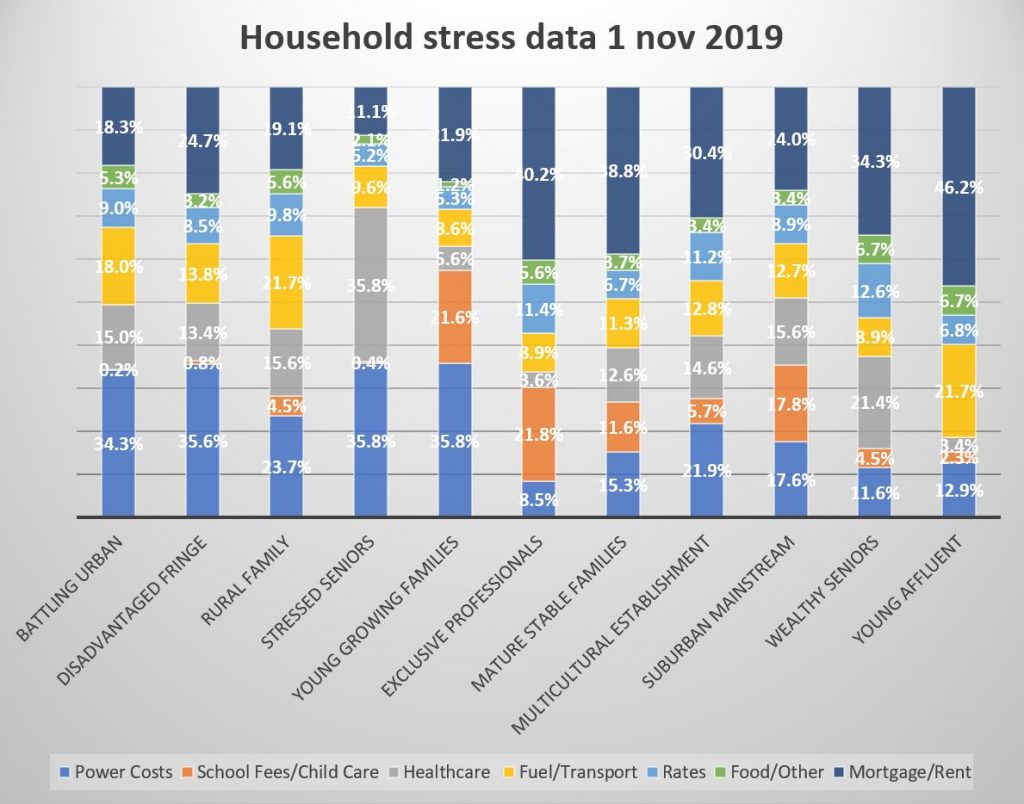
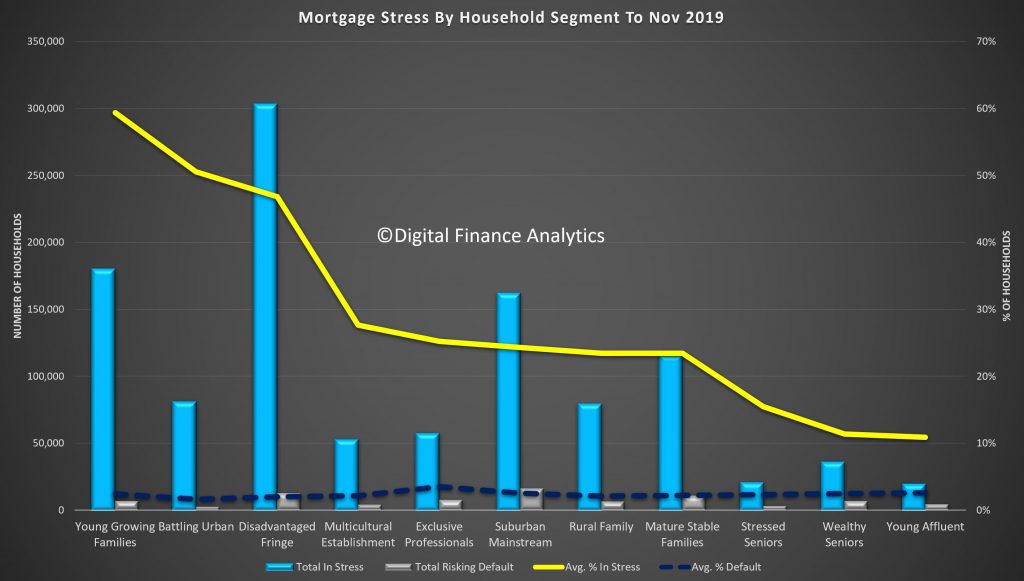
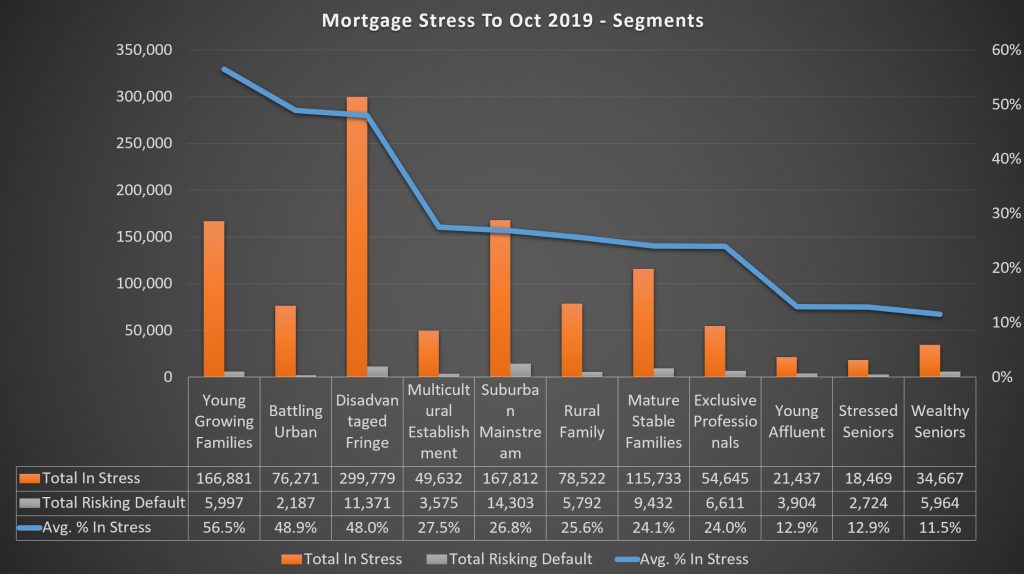
From our most recent DFA survey data, those most affected by power costs include:
- the Battling Urban (34.3% surveyed);
- the Disadvantaged Fringe (35.6%);
- Rural Families (23.7%);
- Stressed Seniors tied between power costs (35.8%) and healthcare costs (35.8%); and
- Young Growing Families (35.8%).
This comes, largely, as we might expect, with young families in growing urban areas, seniors and those in regional areas struggling with cash flow, and pockets of disadvantaged and battling segments overburdened by power costs. The distribution of these segments is largely consistent with the Alviss data, particularly in Rural New South Wales and the Battling Urban of South Australia.
All of these segments (except rural families) whose power costs were the largest stressor had mortgage/rent stress as their next most outstanding strain with:
- Battling Urban (18.3%);
- Disadvantaged Fringe (24.7%);
- Stressed Seniors (sans healthcare cost (35.8%)) with (11.8%); and
- Young Growing Families (21.9%); while
- 21.7% of Rural Families had fuel and transport costs as their next highest stressor, whereas mortgage/rent costs affected 19.1%.
In the other segments, which surveyed a higher cost than power costs, the distinction is clear:
- 40.2% of Exclusive Professionals had higher mortgage/rent cost stress than power costs (8.5%) with the next highest portion reporting school fees/childcare (21.8%);
- Mature Stable Families surveyed higher stress from mortgage/rent costs (38.8%) than power costs (15.3%) which was their next highest;
- Multicultural Establishments had higher mortgage/rent stress (30.4%) which was higher than power costs (21.9%), the next highest result;
- the Suburban Mainstream surveyed 24.4% mortgage/rent costs compared to power costs (17.6%), where their next highest stressor is school fees/childcare (17.8%);
- Wealthy Seniors with (34.3%) mortgage/rent costs, followed by healthcare (21.4%); and finally
- Young Affluent in mortgage/rent costs (46.2%) followed by their next highest, power costs (12.9%).
These segments, too, largely come as no surprise with Mature Stable Families not facing disadvantage, unlike the inner-city postcodes of South-East Queensland. Or, Wealthy Seniors facing some degree of housing affordability in Rural or Regional Victoria.
AEMC, AER, and Canstar:
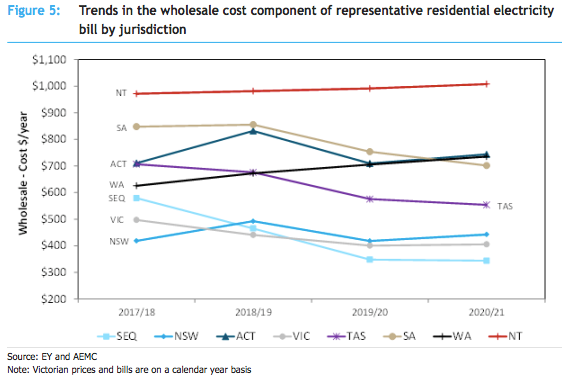
A 2018 Australian Energy Market Commission (AEMC) report modelled that in the next two years emerging wind and solar capacity will drive down residential wholesale prices by $55, offsetting marginal increases in the supply chain like coal plant retirements, burgeoning network costs, and minor environmental costs. The 2019 national weighted average consumption level for residential consumers was estimated at 4,596 kWh per year. And at this consumption level, the national average annual residential bill in 2017-18 was $1,384 exclusive of good and services tax (GST) and $1,522 inclusive of GST.
However, the lived reality for many households, on average, far exceeds these averages. One way we can be certain of this is the Australian Energy Regulator’s own data on disconnections: for NSW, SA, QLD, the ACT, and Tasmania 70,000 residential customers had their supply disconnected between 2017 and 2018. These disconnections are seasonally dependent, however more uniformly than we might expect: there are slightly more disconnections raised in autumn (27.8%) and summer (26.6%) than in spring (23.0%) and winter (22.6%). And then from the more recent Alvis report and ABC WA article, we find that renewables easing the wholesale price is not being felt – especially by regional and rural households. To be clear, the private development of renewables is making enormous strides in the alleviation of power costs, however, the rather incongruent policy leadership in a number of other spaces is directly counteracting this.
By taking a quick glance at Canstar, average annual bills are anywhere from $80 to $370 greater than the AEMC’S estimates for the same average consumption – and have increased.
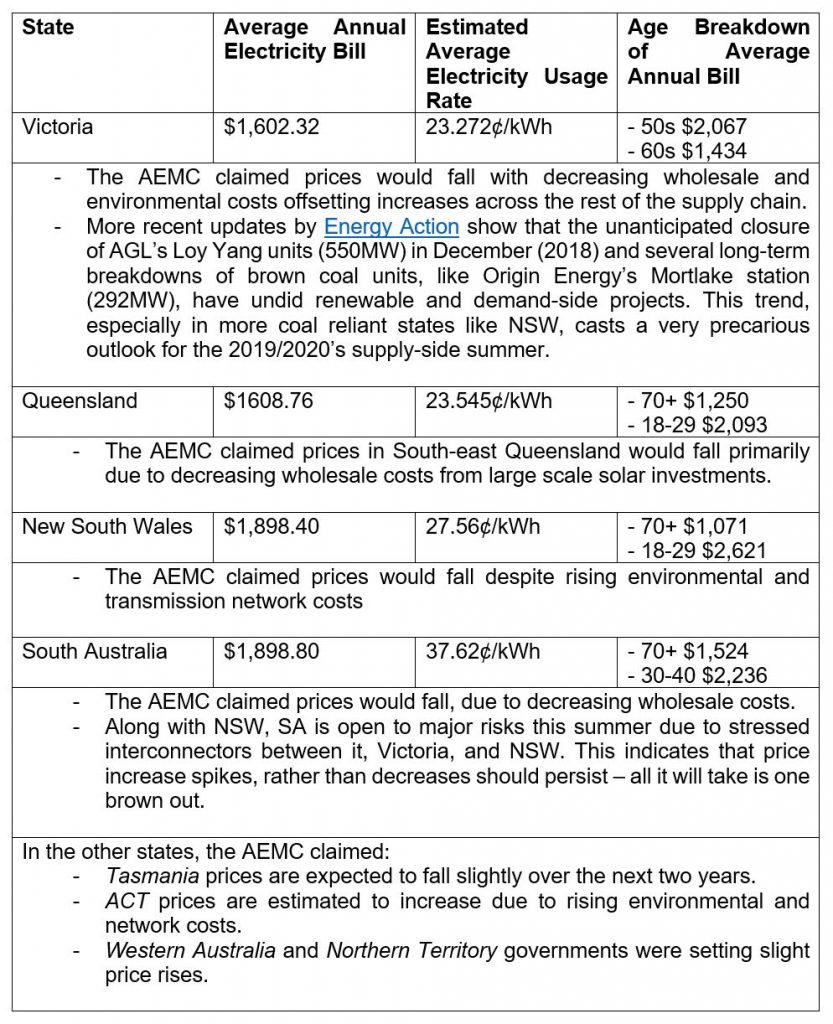
Despite the AEMC claiming observable declines in average household prices, postcodes and households across the National Energy Market experience higher real bills due to sluggish wages and are themselves burdened by inconsistent policy frameworks that fail to implement meaningful market-based solutions or improve the cost of living. The fact of the matter is that household disconnections in all states is increasing.
Recently, the AEMC published their annual report for 2018-2019, which showed that consumers who are willing and able, have engaged in consumer-side uptake of solar PV and batteries. This is causing a positive decentralisation of energy grids (e.g. microgrids, peer-to-peer, virtual powerplants) and alleviation of power prices. In short:
“The technology revolution offers opportunities and benefits for customers to take control of how they buy, sell and use energy. Over time, this should allow for greater utilisation of the existing stock of generation and network capacity, lowering average costs for all consumers.”
However, this is not without its challenges. The AEMC signal to a more complicated shape of daily consumer demand and daily generator supply due to the decentralised frequency and voltage; the necessity of a new power system management in replacing old and inadequate capacity; getting proper connectivity to new remote wind and solar projects; and the ever-elusive unpredictability of weather patterns on day-to-day demand. As well, those households who are unable to purchase household solar and/or batteries are beginning to be left behind, worsening bad market conditions.
In all, these challenges can be adequately met with coordinated and purposeful investment in solar/battery integration and security. For instance, improving grid access to those least-cost sources; fixing security challenges present in the system, like network infrastructure; or maintaining incentives vis-à-vis the needs of the system, like decentralised control of household’s bills with smart technologies all will alleviate prices.
The Federal Governments’ Policy Angle
Going into the election, the Coalition alluded to three policy options in order to lower power prices: removing standing offers (dubbed a loyalty tax); underwriting new reliable investment (painstakingly trying not to call it subsidies); and ‘big stick’ divestment policies aimed at big gen/retailers who either ‘price game’ or stray from Angus Taylor’s ‘reliable’ mantra. Rather critically:
“The Coalition’s fixation on energy prices is no doubt politically effective, as it both appeals to people’s hip pockets and works as a scare campaign against taking action on climate change. But it also obscures another significant, and not unrelated, economic reality.”
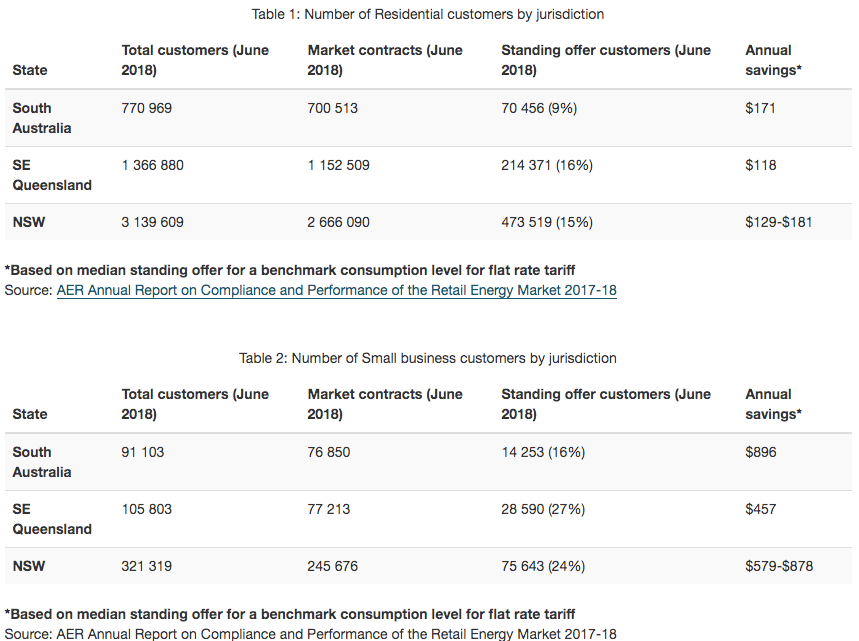
Coming from an ACCC report that “the standing offer is no longer working as it was intended and [that it] is causing financial harm to consumers…” the government claimed that: “On 1 July 2019, 800,000 Australian families and small businesses will benefit from lower electricity prices by moving to default market offer electricity contracts saving households up to $481 in South Australia and up to $663 in NSW and South East Queensland. Households changing to default market offers from standing offer tariffs will save up to $481 in South Australia and $663 in NSW and South-East Queensland…”
Not only is this marginal in the grand scheme of energy consumers, it has required an equalisation across the entire NEM. That is, people on “confusing discounts” will have those reduced in order to maintain retail profits, stating: “customers on standing offers and market offers that were above the default offer would be better off, customers on lower priced market offers would be worse off”. The AEMC and ACCC’s own data showed that the percentage of consumers on standing offers was declining rapidly and organically.
“All jurisdictions are likely to have less than 10 per cent of residential customers on standing offers within the next two years. The Commission also notes that there exists a segment of the market (approximately two to four per cent of all residential customers) who are on standing offers for only a short period when they move house or create a new connection and have not yet selected a market offer.”
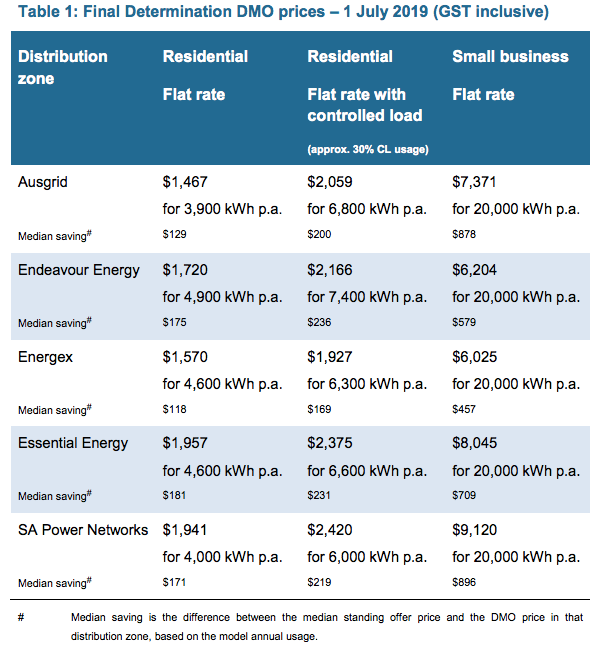
The Government signalled to “savings built on price cuts of up to 15 per cent secured by the Morrison Government for more than 500,000 families and small businesses from 1 January 2019 – and our ban on sneaky late payment fees that will save some customers up to $1,000 a year…” in that “small Businesses changing to default market offers from standing offers will save up to $457 in South-East Queensland, $878 in NSW and $896 in South Australia.” Despite this, disconnections and household power costs stress have uniformly risen.
The government and the ACCC urged consumers to still shop around for market offers that are almost always cheaper than these default market offers.
“In particular, higher proportions of rural and small business customers remain on standing offers. In contrast, the percentage of hardship customers on standing offers is approximately half that of all other residential customers.”
This is coupled with underwriting new “reliable” generation, expected to reduce NEM wholesale prices by a quarter by 2021 – however, whether the government is subsidising the right wholesale generation capacities is another question entirely (they’re not). As well, the government has introduced the Energy Assistance payments to welfare recipients which emphasises a price safety net: “banning retailers from offering confusing discounts, protecting customers in financial hardship and requiring energy retailers to notify customers when their discounts are about to finish or change.”
The government appears more concerned with tinkering with peoples’ demand (a la the first home buyers’ scheme). In doing so they are inflating average demand profiles, not managing the market-wide issues in supply.
Being seven months after the election, and five months since the default market offers were introduced, the AEMC optimistically signalled to wholesale price easing countered by burgeoning costs in the network and retail profiting – whereas, on average, the consumers’ bill has increased in the eyes of financial comparison cites and segments of the population surveyed by DFA report higher power cost stress.
The optimism is not lost in the media: with David Crowe, just in September, writing a piece stating that bills are falling $130 a year thanks to the Morrison governments’ “industry crackdown.” Crowe writes: “The price rules came into effect on July 1 and have already cut the standard offers for electricity customers, with some NSW households saving $130 a year. Some Victorian customers have seen their offers fall by medians of $310 to $430 depending on the retailer.” But immediately, Crowe states that not all customers are going to have reduced bills, just those that were on existing standing offers – meaning that those on existing discounted retail rates have since had their bills increased to equalise the burden. Whether this is observable in the mass of disconnection figures or household stress is uncertain.
In the face of this optimism is the reality that power costs continue to burden
a majority of segments in Australia and average bills continue to rise, as ad
hoc policies have all but decreased the average bill. This is mainly because of
the new policy directions under Taylor and Morrison, which deal more in threats
and subsidies than they do in proper market-based or evidence-based
policymaking. The governments new direction fails to address the largest
inflators of household power costs, which are the overinvested gold-plated
regulated asset base, burgeoning wholesale costs from aging coal-fired power,
and extraordinary retail costs/profits – the latter of which the ACCC and AEMC reject, simply because ‘the market is competitive’. In
that same report, the ACCC and AEMC flag the long-term risks due to legislating
default market offers, including:
- increased risk to retailers driving higher financing and overall costs
- lower levels of innovation leading to less available products and services
- higher barriers to entry and changes to consumer behaviour resulting in decreased competition.
AEMC were happy with retail competition (2019), for the market’s improved simplicity, stable price deals, and removing confusing offers creating “a more engaged market that is responding positively to greater product innovation and bundling – and producing positive outcomes.”
5. Final Remarks
As a portion of average household expenditure, electricity costs have risen to 50% from 2006 to 2016. The ABS found 10% of those surveyed reported difficulty in paying bills in 2015-2016. In 2013, ABS also found 10% “chose” to restrict heating and cooling. These figures alone reaffirm the DFA thesis that Australia is experiencing poor wage growth, underemployment, low productivity, record levels of private debt. And when this is applied to poor innovation in the energy sector, a maintenance of minerals-based growth, and a reluctance to properly do what is needed
Across all household types, less are able to pay electricity/gas. There is a negative association between net wealth and indicators of energy-related financial stress 1st quintile ‘chose’ to restrict heating / cooling. Renters and mortgage holders are at observably greater risk of energy-related financial stress, ‘choosing’ to forgo consumption. Solar panels substantially reduce their difficulties, however, it is only available to those who can afford it, while those who can’t are left to the market.
As the DFA data shows, the surveyed segments are divided along two key groups: those with Young Families in growing urban areas, Seniors and those in regional areas struggling with cash flow, and pockets of disadvantaged and battling segments who are overburdened by power costs. And on the other hand, those Exclusive Professionals, Mature Stable Families, Multicultural Establishment, Suburban Mainstream, Wealthy Seniors and the Young Affluent who are more burdened by mortgage/rent costs.
In summary, summer bodes very poorly, with shocks from old coal-fired power very likely spiking prices unpredictably along outdated yet gold-plated interconnectors. Any price movements across states, such as a brown out, through the NEM will be infectious, as interconnectors deteriorate and fail to distribute new renewable projects of higher efficiency. Existing coal generation is increasingly unreliable and expensive, as the fleet continues to retire, and governments fail to make investment into sufficient new generation or systems reliability. The policy void in wholesale and gas markets will mean that higher prices and system risk will continue, as the market and industry signals for proper investment and legislative certainty.
 Blog")