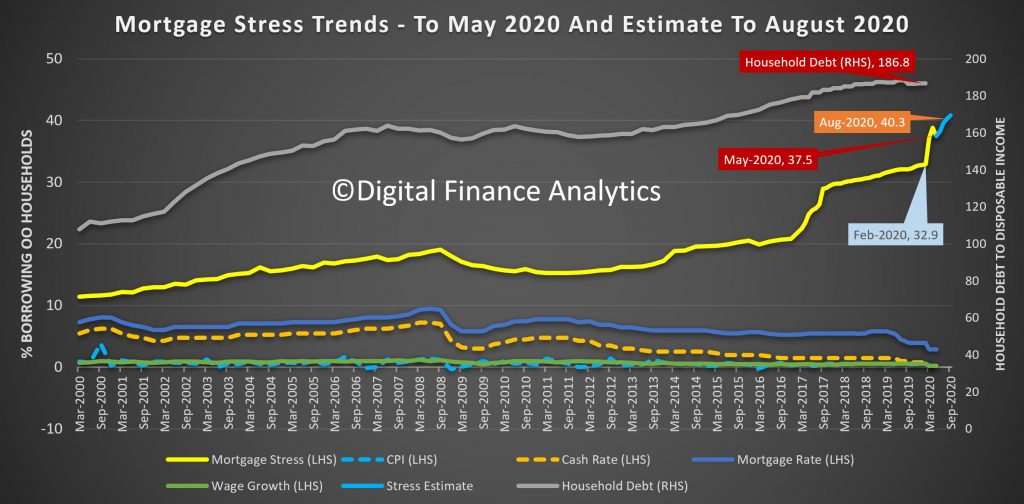
The latest DFA household survey results for May 2020, from our rolling 52,000 survey reveals a slight fall in households in mortgage stress, from over 38% last month to 37.5%. This still means 1.4 million households are experiencing cash flow issues, despise the Government support programmes and Bank repayment holidays. The full pack is available for download.
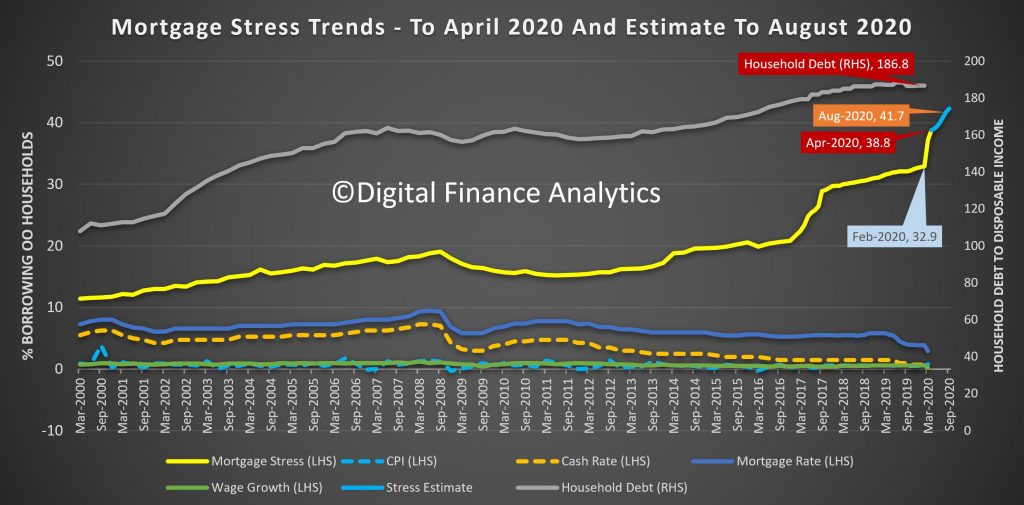
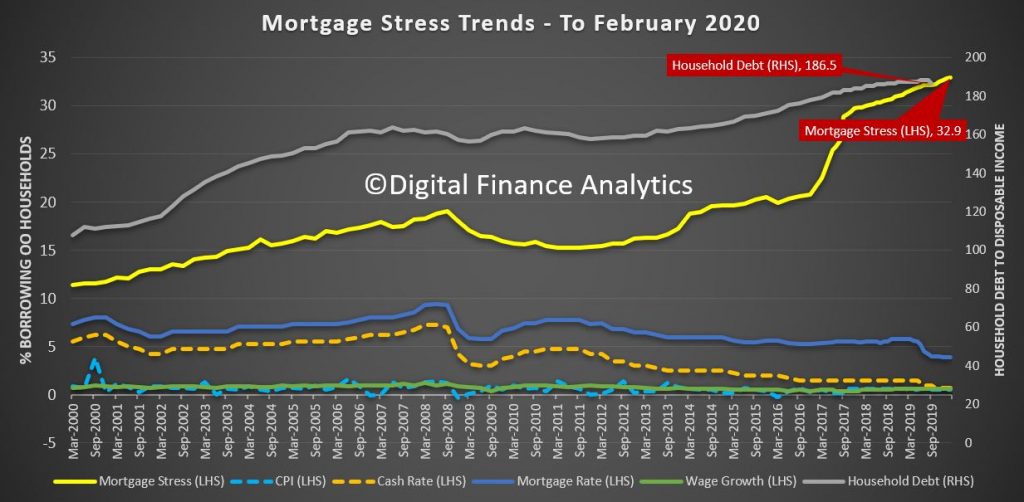
Before COVID, the rate was up to 32.9%, thanks to rising costs and flat incomes, and the rate would have been significantly higher without JobSeeker, JobKeeper and Bank repayment holidays. Ahead, of the September “cliff” when the supports are removed we are projecting a further rise to 40.3%, though if the supports are tapered, this might be lower in reality.
To assess mortgage stress we do not use a set percentage of income going on mortgage repayments, rather we look at total cash flow – money in and money out. If households are under water they are deemed to be in stress. More than 10% under water, then severe stress. Of course they may have assets like deposits, or put more on credit cards, but generally households under pressure spend less, hunker down, and some, 2-3 years later end up selling or even defaulting. Stress indicators are an early warning sign of potential issues ahead.
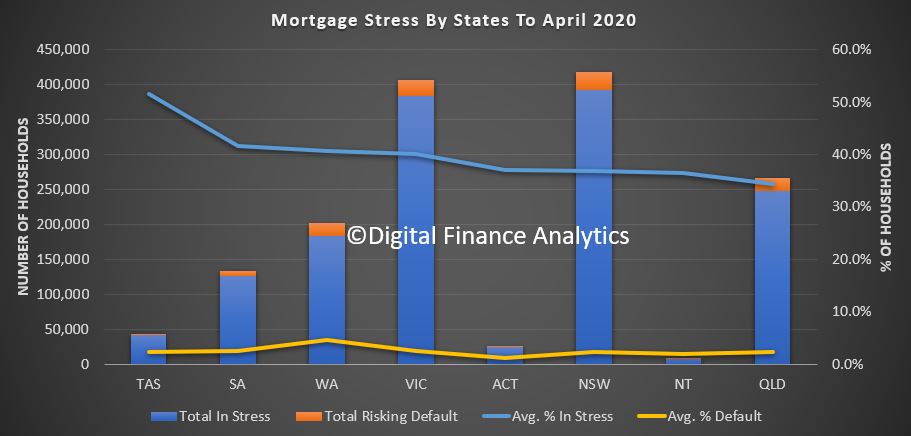
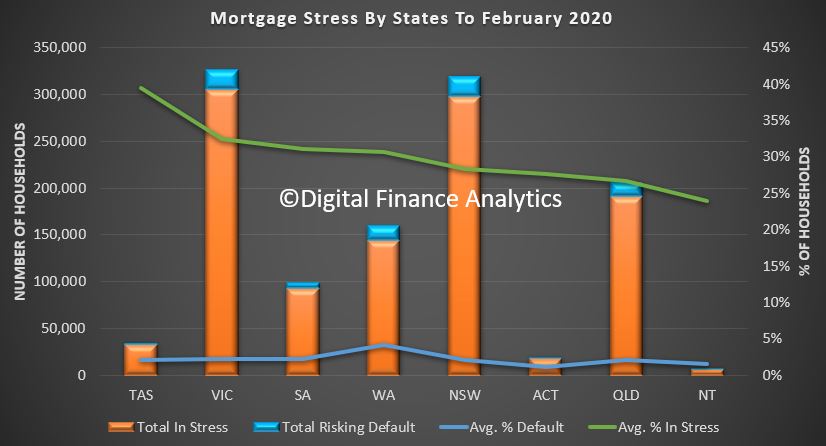
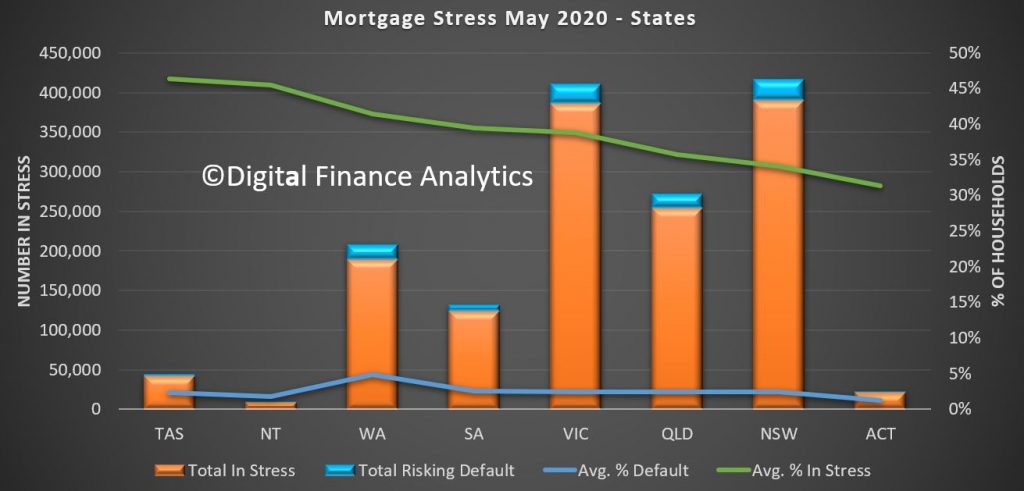
Across the states, Tasmania has highest proportion of households in stress (a function of lower incomes,recently rising home prices and mortgages and a stalled tourist sector in the state). The largest counts are found in NSW and VIC, whereas the highest default projection rates are found in WA.
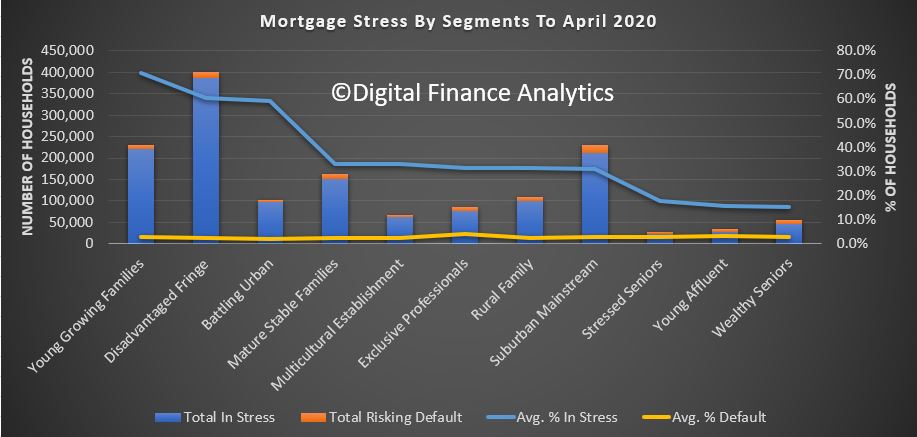
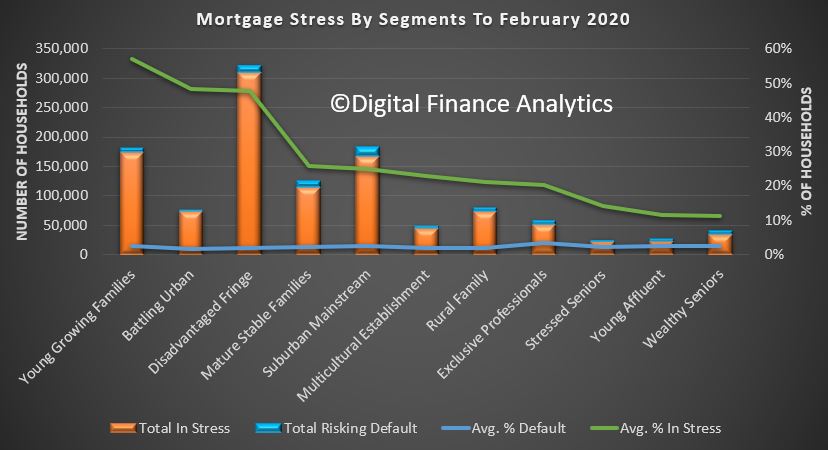
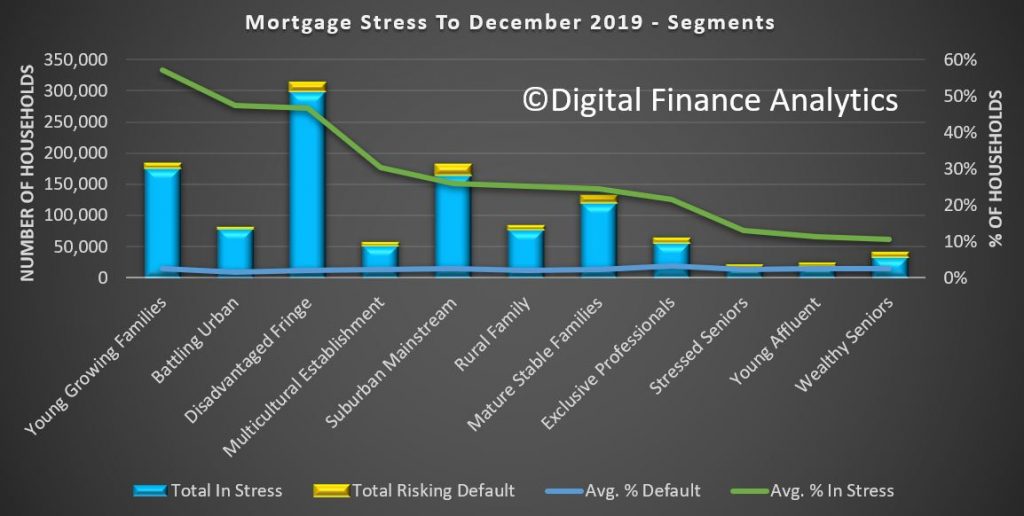
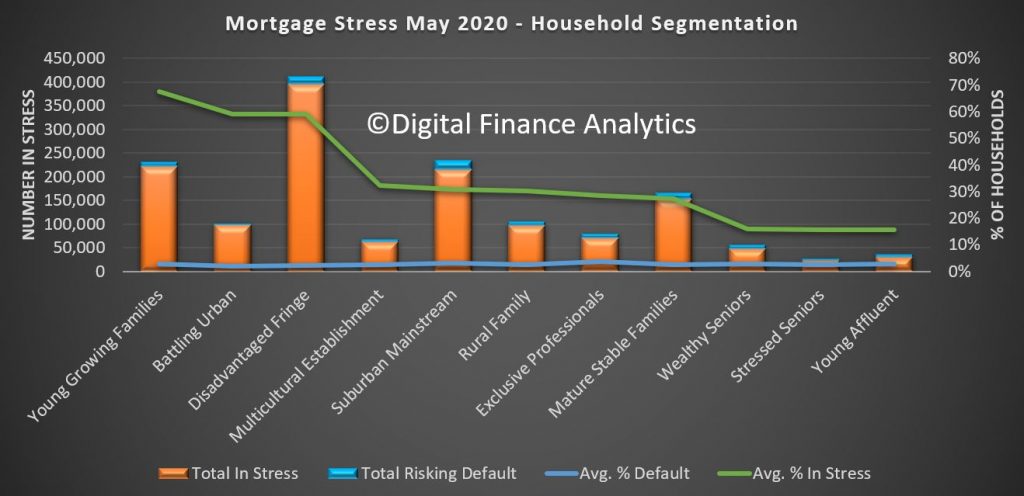
Across our segments, young growing families, including first time buyers, are the most stressed. However we also see a rise in “affluent stress”
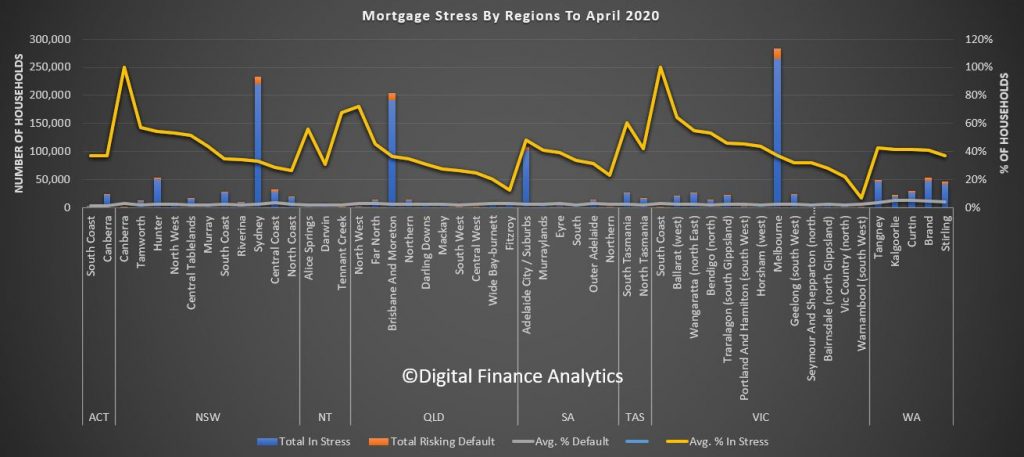
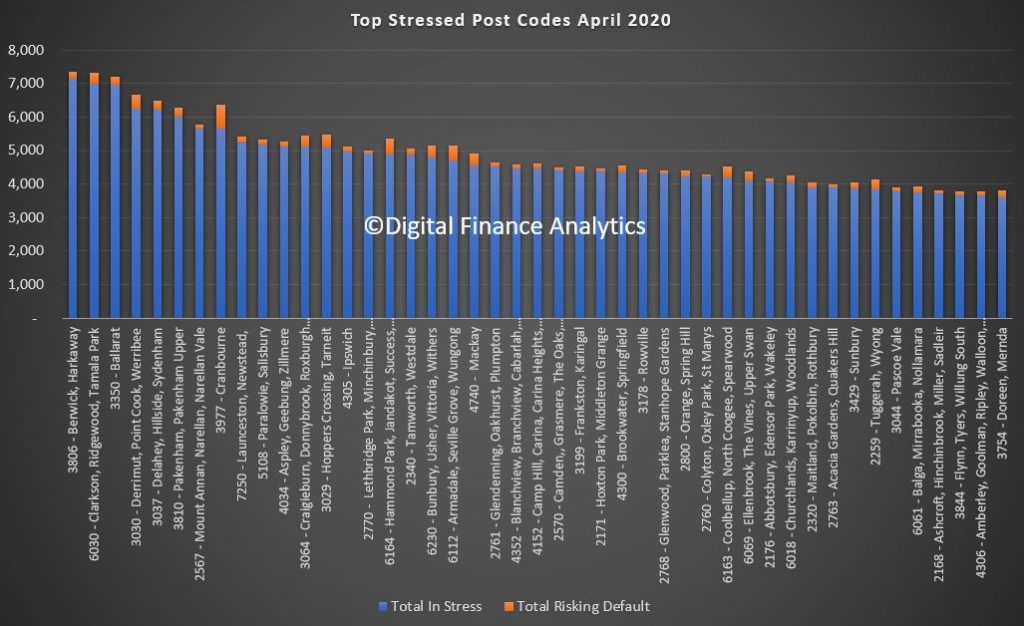
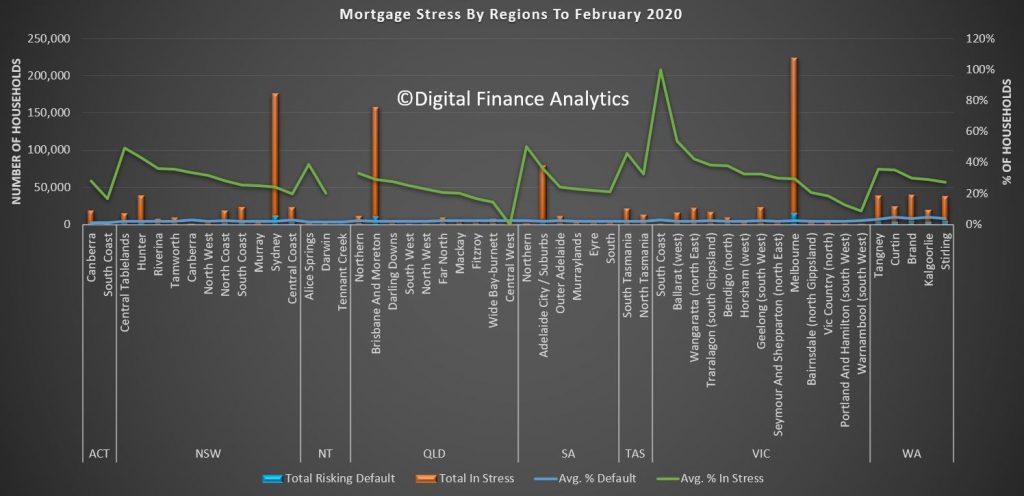
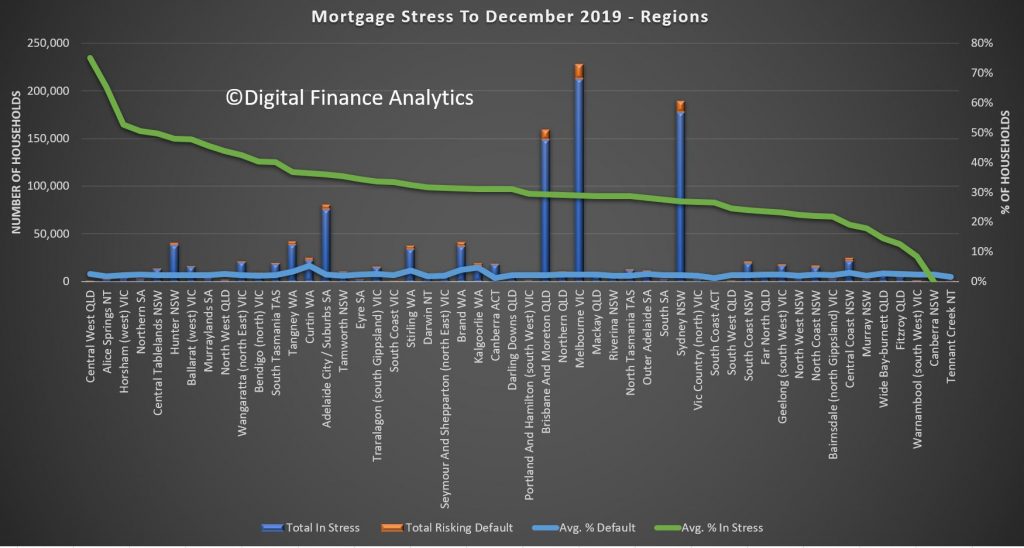
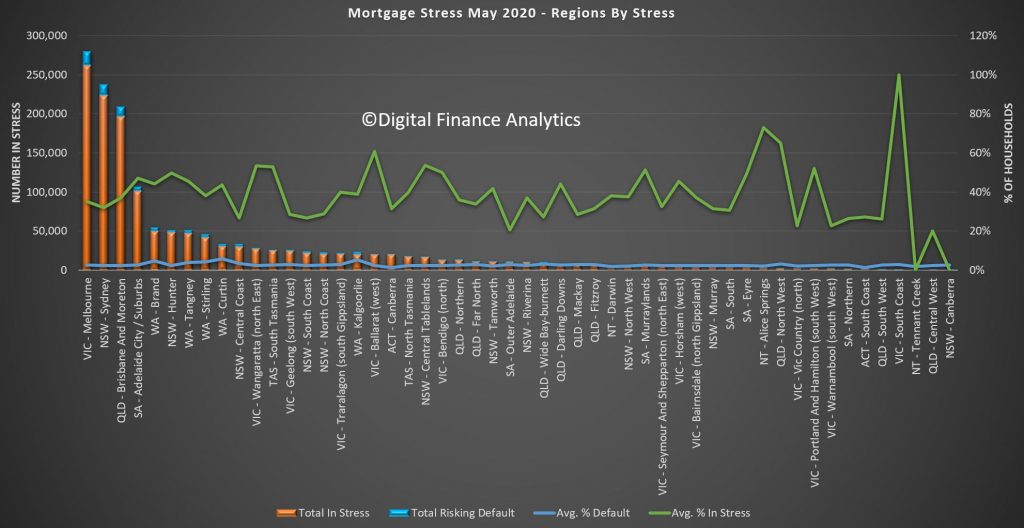
Stress exists across the regions, this is not just a major City story. In fact some of the most stressed areas include regional Victoria and New South Wales. The percentages of households in stress do vary.
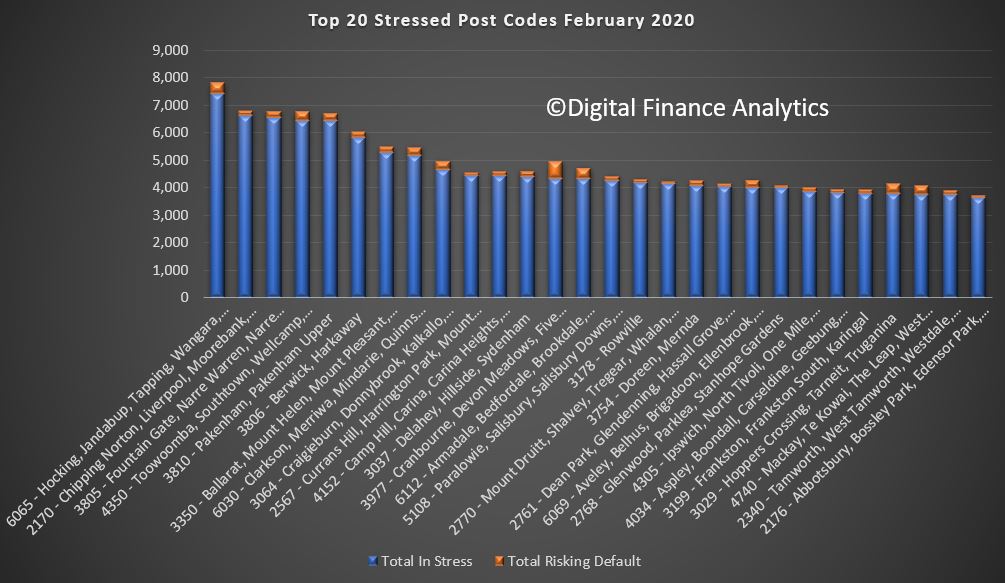
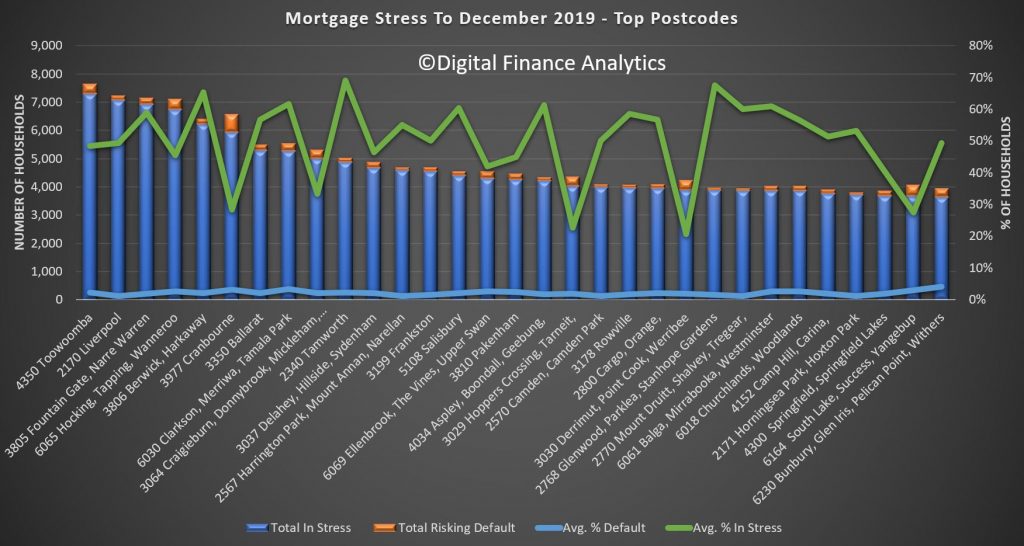
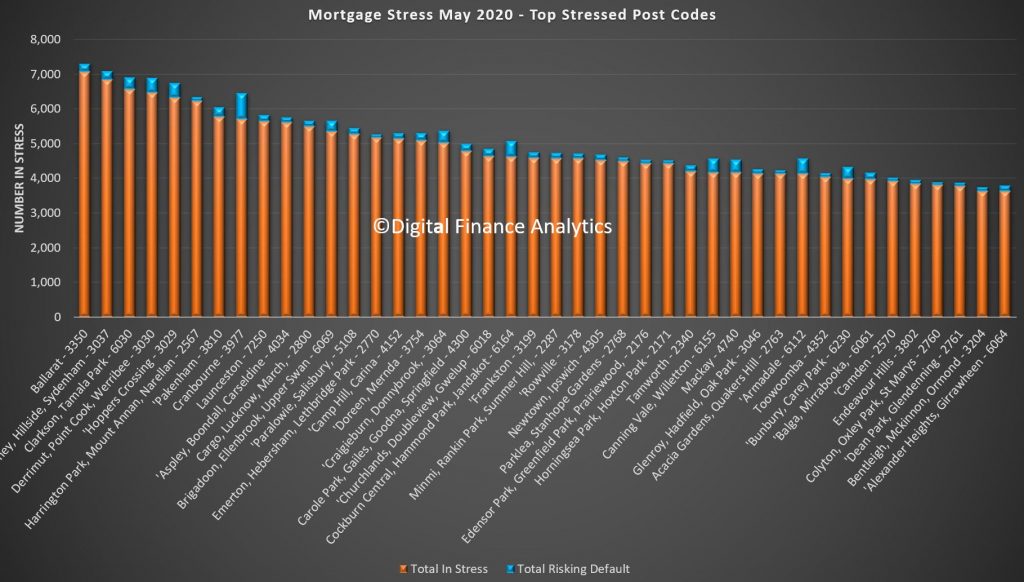
Nationally the most stressed post codes include Ballarat 3350, Hillside and Sydneham 3037, 6030 which includes Clarkson and Tamala Park, and 3030 Werribee and Point Cook. Many of these areas include large swathes of relatively newly built property on small urban estates. Cranbourne 3977 carries the largest number of households risking default.
You can look at the detail behind our analysis. Click on the image to load or save the PDF file. You will need to have Acrobat installed.
You can also watch our live show where we discuss mortgage stress and report on a range of individual households.
Finally, I discussed our research with Nucleus Wealth in their Podcast Series:
This is the edited edition, with behind the scene sequences added. The original edition, with live chat is available here: https://youtu.be/Q_6Bo_JYBJw
Digital Finance Analytics (DFA) Blog
DFA Live On Mortgage And Rental Stress - HD Replay Edition [Podcast]
Tonight I reveal the latest analysis of mortgage and rental stress and answer questions live. The show commences 20:00 Sydney time tonight. I will have the postcode level data available for almost all areas of Australia, together with heat maps and default analysis.
The latest DFA mortgage stress data, derived from our rolling household surveys reveals than an additional 100,000 households joined the cash-flow stressed in April, bringing the percentage of households to more than 38%, which equates to more than 1.4 million.
The trajectory is still set to reach more than 41% by August. Our estimates take account of the enhanced JobSeeker, JobKeeper and Bank mortgage repayment holidays. Given the ABS reported around 650-700,000 employed people have lost work since mid-March, we expected these increases to track close to our estimates.
A reminder, we define mortgage stress in cash flow terms, rather than a set proportion of income. One other factor in play is that many households relied on multiple incomes and the loss of just one is sufficient often to push people into stress. Defaults are likely to follow, but not immediately, as people draw on savings, put more on credit, or simple hunker down for a time.
Across our segments, young growing families, at more than 70%, are at risk, follower by those battling on the urban fringe. But we continue to see a growth in more affluent households also being hit.
Across the states, Tasmania contains the highest levels of mortgage stress, thanks to the over-reliance on tourism and recent price rises relative to income. Some lenders have become more cautious here, with many investors unable to secure a mortgage repayment holiday.
Across the regions we see pockets rising in regional areas, as well as the main urban centres. Mortgage stress is not just a big-city disease.
By postcode, Melbourne post code 3806, Berwick and Harkaway now leads the way with more than 7,000 households in the district under pressure. VIC figures strongly with the top 5, with 3350 Ballarat, 3030 Werribee and 3037 Sydenham all impacted. Second though behind 3806 is WA code 6030 which includes Clarkson and Tamala Park. Most of these areas are high growth development corridors, where prices and incomes are above average. Within these areas there are also a sizable number of property investors.
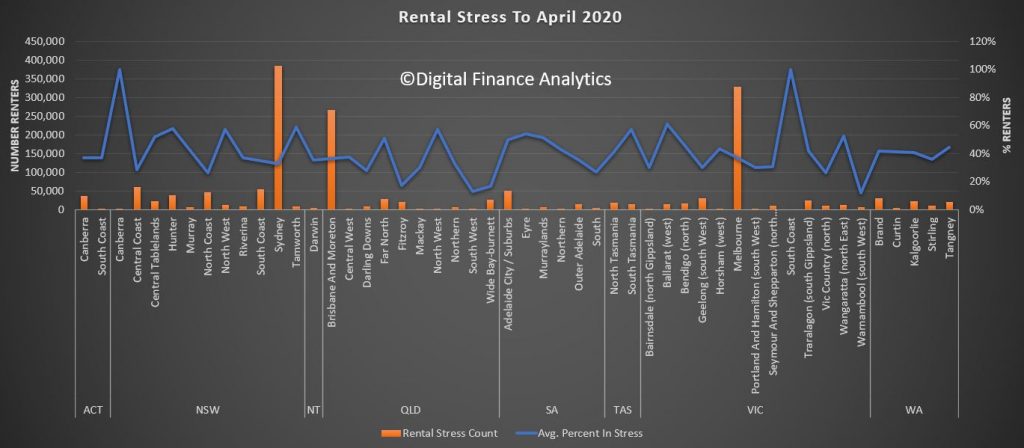
Finally, there are 1.7 million households in rental stress – defined again in cash flow terms. This equates to nearly 40% of all renting households. The regional variations are again quite stark with stress peaking in Canberra and the South Coast (where bush fire damage remains).
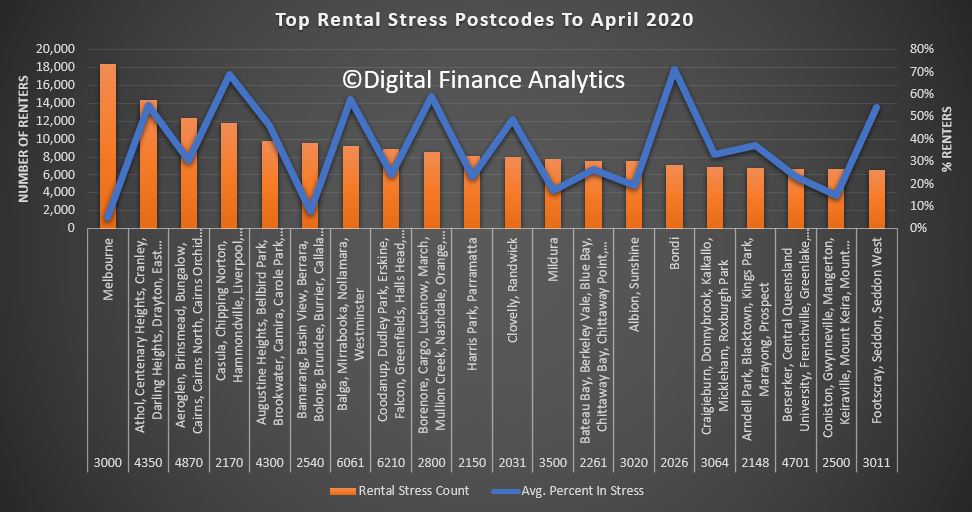
Melbourne post code 3000 recorded the highest count of rental stress, thanks to large numbers of high-rise units being built there, the loss of student and AirB&B clients and simple oversupply. But post codes in Queensland and NSW are also badly hit.
Given the trajectory of the economic downturn, we expect stress to continue to build. The most significant question is the impact of the “cliff” in September where mortgage repayments and rental default freezes, at the same time when Government support schemes all are expected to terminate. Given that the June unemployment figure will likely to 10% (the true figure much higher) and according to the RBA unemployment will remain elevated through 2021, there is little prospect of the trends reversing anytime soon, even at current low interest rates.
Individual households will need to consider cutting their losses in these circumstances and as a result we expect the supply of rental property will rise, and a hike in property to list will follow later.
This has the hallmark of a long slow” U” not a “V” shaped recovery.
The official story is that lower interest rates are translating to reduced financial stress in the community. The true story, as revealed in the latest edition of our mortgage stress analysis is that more households are up against it, with a record 32.9% of mortgages households wrestling with cash flow issues. This translates to 1.08 million households in stress, and more than 82,000 risking default in the months ahead.
Many households are chasing their tails, in that while mortgage repayments are dropping – for some, rising living costs and flat real incomes are compounding their financial pressures. There was a sharp downturn in take home pay, thanks to bushfires and the virus is beginning to hit businesses, (who in turn are less able to pay and retain staff, especially those on “flexible” contracts).
Across our master household segments, the highest proportion of households under pressure are “Young Growing Families”, which includes many recent first time buyers, “Battling Urban” – those older households living in the main urban corridors, and “Disadvantaged Fringe” households, those living in the often new fringe developments are also at the top of the list. That said, stress takes no prisoners, in that even some wealthy households, and more mature families are also under pressure.
Across the states, the highest proportion of households are in Tasmania, where the recent run up in prices, against high costs and low wages is a nasty cocktail. As yet though defaults remain low here. Western Australia has a significantly higher level of defaults, because the financial pressures have been running for years. The largest counts of stressed households are located in Victoria and New South Wales, with Queensland also seeing a further rise. Defaults are expected to rise again.
Across the regions, there are considerable variations, with a significant spike in some areas following the recent bushfires.
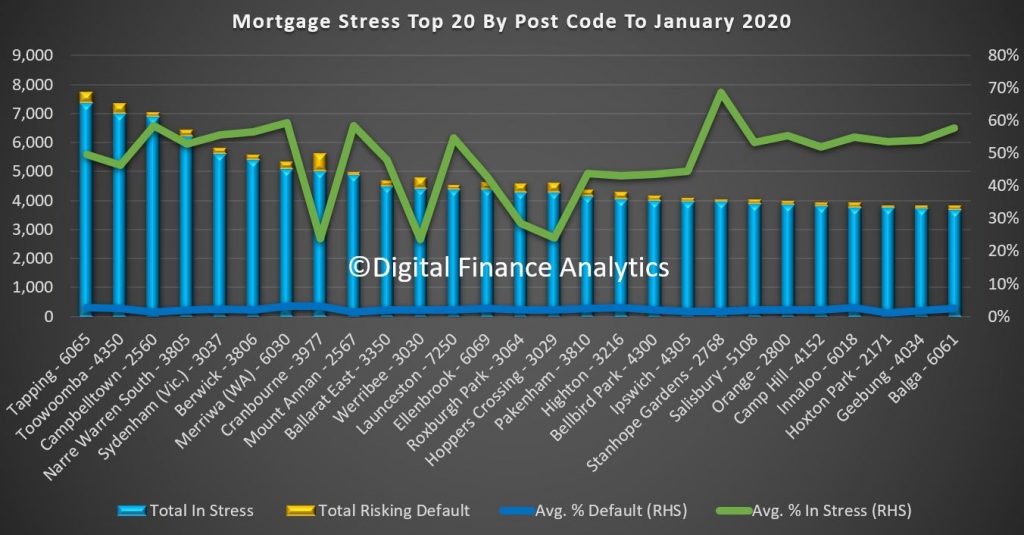
The top 20 post codes reveals that WA post code 6065 which includes Tapping and Hocking tops the list this month, with more than 7,000 households impacted. Liverpool, 2170, in New South Wales, Narre Warren 3805 in Victoria and Toowoomba 4350 in Queensland are all at the top of the list. The common theme here is significant and recent higher density development, large mortgages and over priced real estate (and supported by insufficient infrastructure).
As always we remind households that maintaining a cash flow record is an essential tool to managing a household budget – there are good tools available on ASIC’s Money Smart Web Site. Less than half of the households surveyed know their financial status. Careful prioritisation, and repaying higher interest debts first often makes the most sense, especially when wages growth will remain sluggish (and before the economic impact of the virus really hits). Finally, refinancing may provide short term relief, but without a change in behaviour this will not be long lasting.
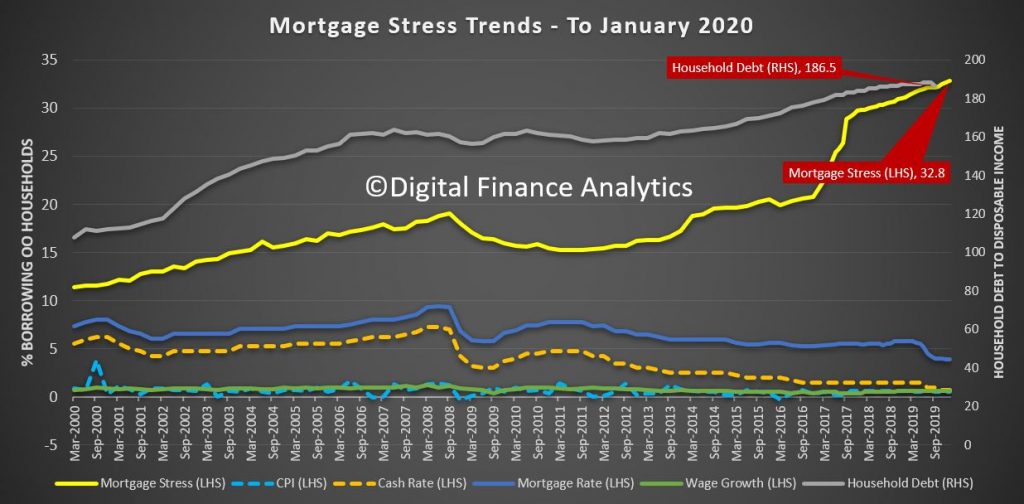
The latest results from our household surveys to end the end of January reveals that mortgage stress continues to push higher with 32.8% of households now impacted, representing more than 1.1 million borrowing households. In addition expectations of defaults are up to more than 83,400 over the next 12 months.
These results are of no surprise, given the ongoing pressure on incomes and rising costs, despite somewhat lower mortgage rates for some borrowers. The banks of course are deeply discounting rates for new loans, but many borrowers are unable to access these “cheap” deals and are stranded on more expensive rates.
Whilst some households who are not stressed continue to pay mortgages down ahead of time (which is why many claim all is well in mortgage-land), the hard fact is that one third of households are facing ongoing financial pressures. These households are not reducing their debt, rather in some cases they are turning to additional finance to try and bridge the cash-flow gap. Or they are raiding savings if they have them, and are putting more on credit cards.
We analyse mortgage stress in cash-flow terms. If a household is paying out more each month including the mortgage repayments, compared with income received, they are in stress. This is not defined by a set proportion of income going on the mortgage. They may have assets they could sell, but nevertheless in cash-flow terms they are underwater.
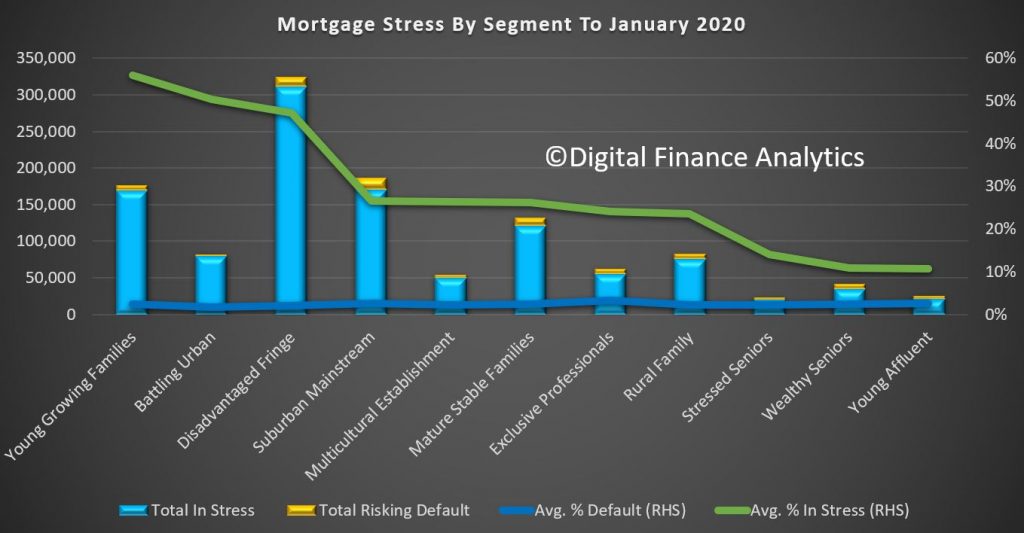
Mortgage stress continues to be visible across most of our household segments, with more than half of young growing families exposed (56%), and this includes a number of recent first time buyers.
Those in the urban fringe, especially on new estates are also exposed (50%) but the largest cohort are in the disadvantaged fringe, where incomes are below average as well. More than 300,000 households in this group are exposed, comprising 47.2% of all household in this segment.
Stress also appears in our more mainstream groups, though at a lower level, and we also see our most affluent segments over-leveraged, with 24% of Exclusive Professionals (the most affluent group) and 10.7% of Young Affluent households impacted. In fact our predicted bank losses are more extreme in these groups, as they have larger mortgages and multiple properties.
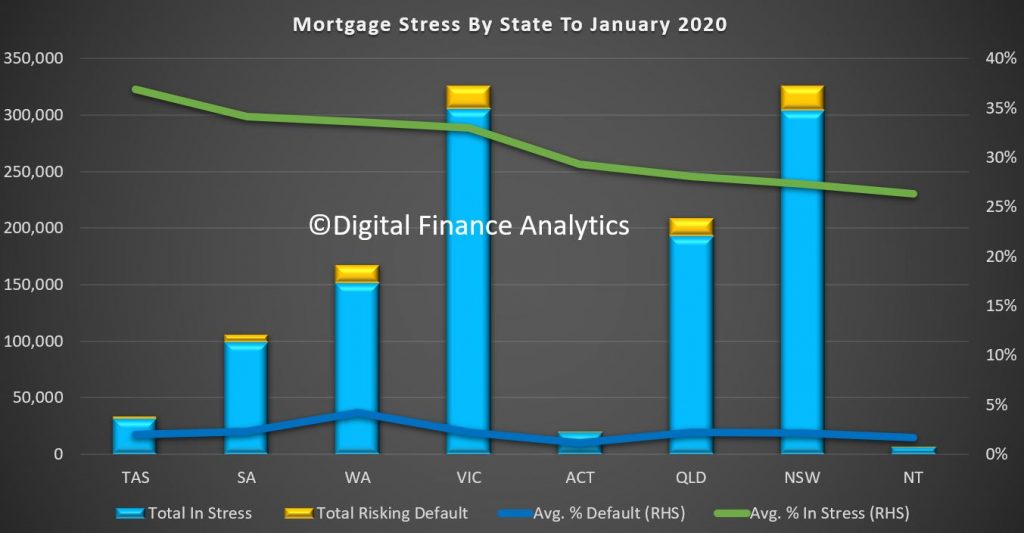
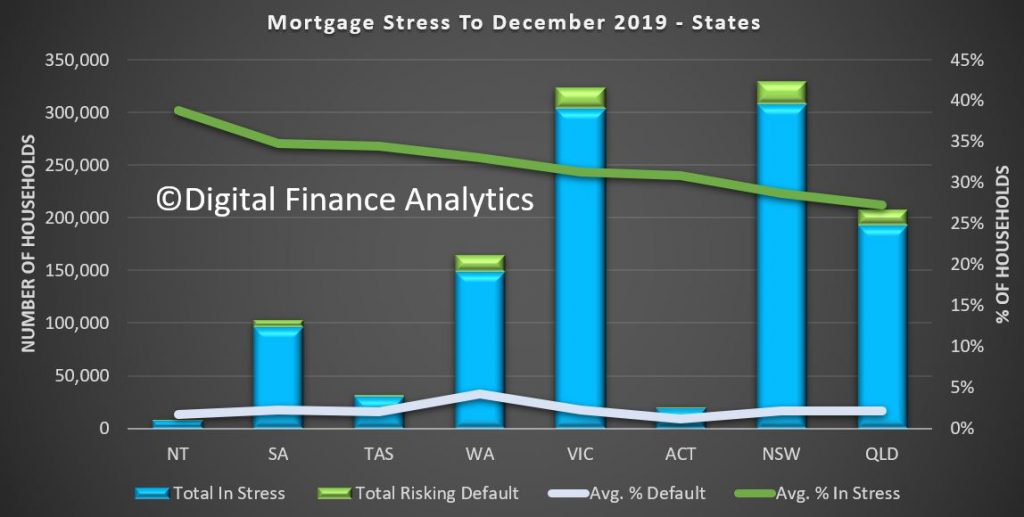
Across the states, 36.9% of households in Tasmania are registering as stressed, which equates to 31,700 households exposed, followed by South Australia at 34.1% (99,700) and Western Australia at 33.6% or 152,000 households. In TAS and SA prices have remained elevated relative to income and housing affordability continues to deteriorate. Victoria has more than 305,000 household in stress, or 32.9%, while Queensland has 193,000 (28.1%) and New South Wales 304,000 (27.3%). The highest rate of default (a forward-looking estimate over the next 12 months) is in WA at 4.2%, while the national average is 2.2%.
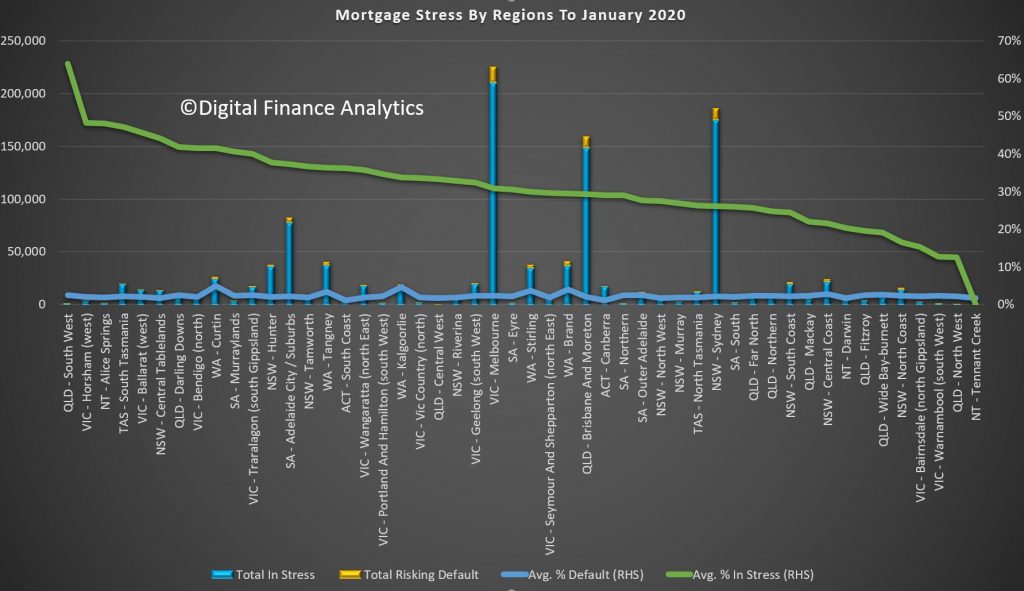
Across the regions, Regional Queensland, Horsham (VIC), Alice Springs and the Southern Half of Tasmania recorded the highest proportion exposed. But the main urban centres of Melbourne, Sydney, Brisbane and Adelaide had the highest counts. Default rates were highest in Curtin WA at 5% and Brand WA (4%). This is driven by multiple years of poor economic performance across the state and underscores that mortgage stress is a precursor to defaults, which tend to occur significantly later. The majority are still working, though income is under pressure. Given current economic headwinds and settings, we expect defaults to continue to rise.
Finally, across the most stressed post codes, WA 6065, which includes Tapping, Wangara and Wanneroo recorded 50% of households in stress, or 7,360 households, followed by Queensland postcode 4350, the area around Toowoomba with 7,000 households in stress, NSW post code 2560, the area around Campbelltown with 6,900 households in difficulty, or 59% of households, and then Victorian post code 3805, the area around Narre Warren, with 6,200 households in stress, which is equivalent to 53% of households.
Most of these areas are fast-growing highly developed suburbs, often on the fringes of our major centres, with many relatively newly built properties on small lots, and often with little local infrastructure. As a result, a significant proportion of income goes on transport costs, and so despite many households having above average incomes, their larges mortgages and high expenses are putting them under continued severe pressure.
Finally, a couple of comments for those in stress, bearing in mind many we survey seem unaware of their plight, because they do not maintain a cash flow. So step one is to draw up a cash flow of money in and money out – ASIC’s Money Smart web site has some excellent tools. Next prioritise spending, and focus on repaying high interest debt (like credit card debt). Third, be cautious of refinancing and restructuring as while this may provide a short term path to relief, unless households in difficulty change their behaviour, it will not be a long-term fix. And finally, do not count on income growth ahead, as given the current economic conditions across the country, we expect wages to remain lower for longer.
And this is a warning too to those contemplating the new first owner incentives. Be conservative in your cash flow estimates, do not count on automatic income acceleration. This would be a path to mortgage stress sooner rather than later.
We plan to publish some stress geo-mapping in a later post.
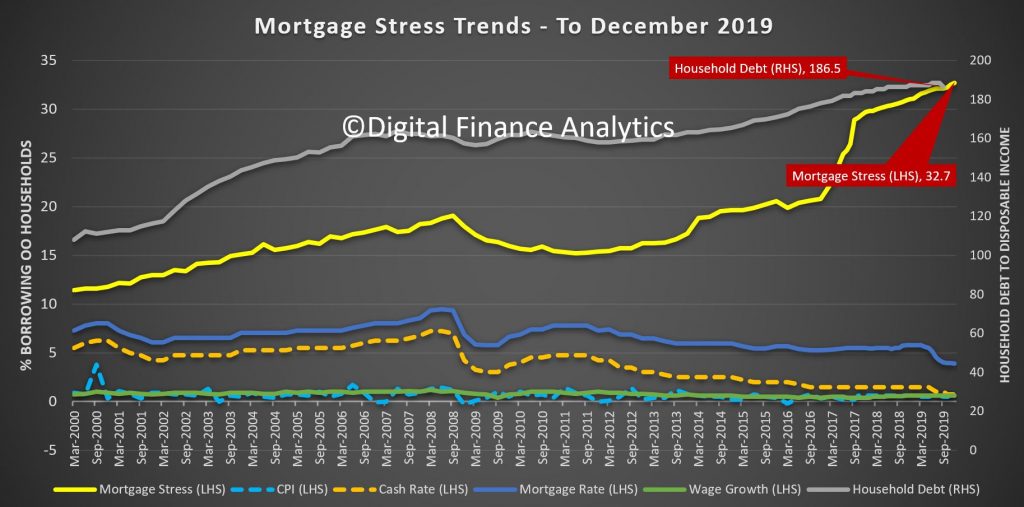
We are releasing the results of our rolling household surveys, which were completed before the latest round of bushfires started raging. Nevertheless, the results are a concern because the total number of households registering as financially stressed rose again, to 32.7% of borrowing households. This represent 1.1 million households across the country and a predicted default count of 83,220, despite lower cash rates, and some deeply discounted mortgages.
Stress is assessed in cash-flow terms, and when money in is not sufficient to cover the costs of the mortgage and other regular outgoings, the household is flagged as stressed. Granted they may have the capability to tap into deposits, pull down on credit cards, or even sell property, but on a regular basis they are in strife. We find a significant gap between those we assess as at risk, and those who believe they do have financial difficulty. Many adopt the head in the sand approach and hope things will improve, but given the current economic outlook, we think that is a courageous stance to take.
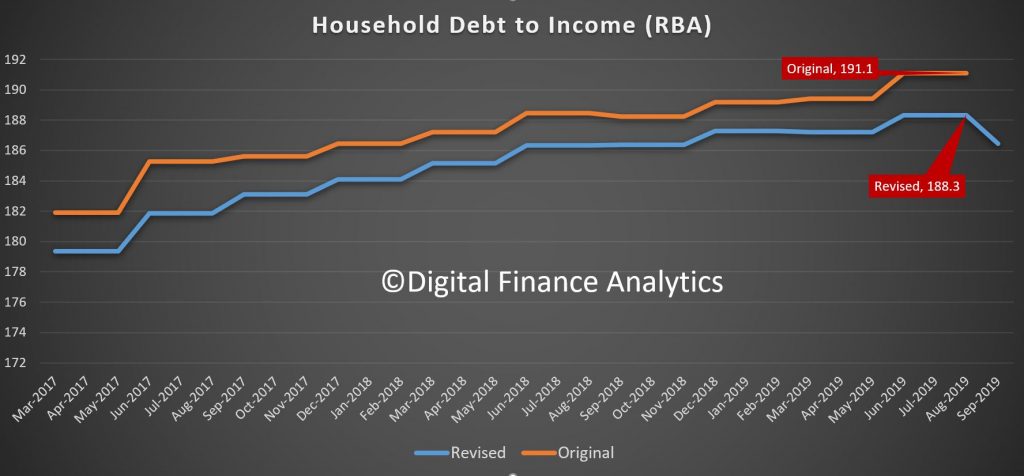
The RBA reported their E2 Selected Household ratios to September just before Christmas and weirdly, the entire debt to income ratio series was restated lower, not just the current quarter, but back through the series. As a result the average debt to income ratio dropped from 191 to a still high 186.5. We always have a issue with this series because it includes small business and households without borrowings, but the downshift in the series is quite significant, and unexplained. I have written to the RBA asking for an explanation. Note this is not the first time the series has been revised down, yet they do not include any explanation in the dataset.
Across the states, NT, SA and TAS recorded the highest proportion of households in difficulty, though WA has the highest default probability risk over the next 12 months at 4.2%, whereas the three most populous states, VIC, NSW and QLD sat at 2.2%. Victoria proportionally to New South Wales has a higher mortgage stress reading.
Among the DFA household segments, 57% of young growing households are in mortgage stress, and within this group there is a large cohort of first time buyers. 2.5% of these households risk default in the next 12 months.
47.5% of battling urban households are also in mortgage stress, and 1.7% risk default ahead. Many of these households occupy properties in the urban fringe, often on newish high density estates. The largest cohort is the disadvantaged fringe group, with 300,000 households in stress and 13,00 risking default. Stress continues to build in our more affluent segments too, with young affluent households at 11.3%, or 4,400 households and exclusive professionals at 21.5% in stress and 3.4% risking default. Losses from this exclusive group are expected to be as high as $1 billion dollars, and is the most value exposed group from a lender perspective.
Across the regions, the Central West of Queensland has 75% of households in stress, but only 300 households, followed by Alice Springs at 65% with around 2,000 households exposed.
In the larger urban centres Adelaide has 35.9% of households exposed, which equates to 75,000 households, followed by Brisbane and Moreton Bay at 29.2% or 148,000 household, Melbourne at 28.9% or 213,000 households and Sydney at 26.9% with 178,000 households under stress.
And across the top post codes, Toowoomba 4350, is the highest count at 7,300 households, or 48%, followed by Liverpool 2170 at 49% or 7,080 households, Fountain Gate and Narre Warren 3805 with 6,918 households or 59% and in WA Hocking, Tapping and Wanneroo with 45% of households equating to 6,732.
Given the current economic settings we expect stress to continue to rise. And shortly we will be looking at the latest household financial confidence index from DFA, which continues to highlight challenging times for more and more households.
But in closing, as I often say, households would do well to draw up a cash flow, to identify money in and money out, determine which spending is essential and prioritise accordingly. And remember, if you are in financial difficulty banks have an obligation to assist, so go talk to them, early. Avoid the head in the sand posture, as it leaves other parts horribly exposed!!

 Blog")