US Production Index Lower Than Expected

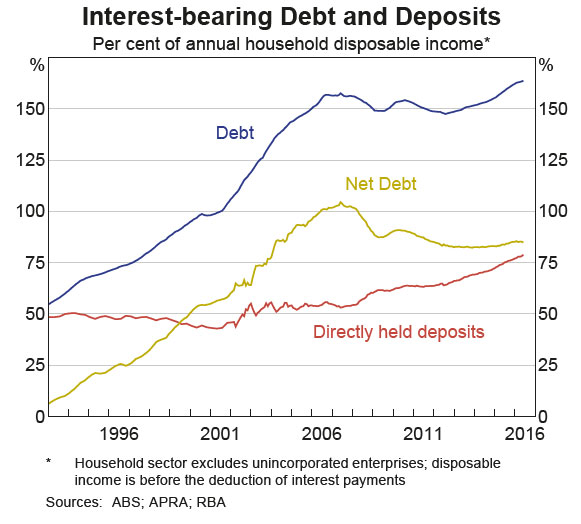
Latest figures from the US Federal Reserve shows that industrial production decreased 0.4 percent in August after rising 0.6 percent in July. The market reacted to this data, taking it as an indicator that a rate rise was less likely in the short term.

us-produciton-aug-2016

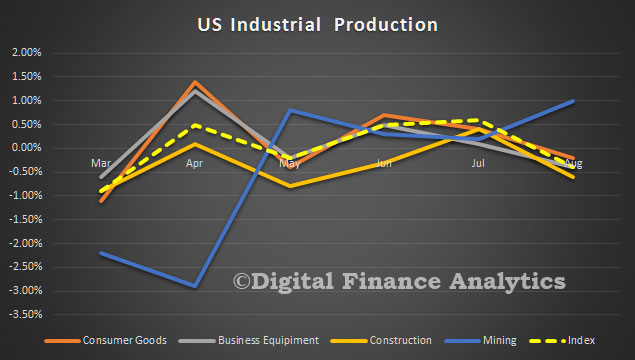
Manufacturing output declined 0.4 percent in August, reversing its increase in July; the level of the index in August is little changed from its level in March. Following two consecutive monthly increases, the index for utilities fell back 1.4 percent in August. Even so, the index was 1.7 percent above its year-earlier level, as hot temperatures this summer boosted the usage of air conditioning.

The output of mining moved up 1.0 percent in August, its fourth consecutive monthly increase following an extended downturn; the index, however, was still about 9 percent below its year-ago level. At 104.4 percent of its 2012 average, total industrial production in August was 1.1 percent lower than its year-earlier level. Capacity utilization for the industrial sector decreased 0.4 percentage point in August to 75.5 percent, a rate that is 4.5 percentage points below its long-run (1972–2015) average.

Market Groups

The indexes for all major market groups declined in August. The output of consumer goods decreased 0.2 percent as a result of a large drop in consumer energy products and a small decline in consumer non-energy nondurables. The output of consumer durables was unchanged; a gain in automotive products was offset by declines in all of its other components. Business equipment posted a decrease of 0.4 percent, as gains of 1 percent or more for transit equipment and for information processing equipment were outweighed by a cutback of nearly 2 percent for industrial and other equipment. The output of defense and space equipment declined 0.6 percent. The indexes for construction supplies and business supplies moved down 0.6 percent and 0.8 percent, respectively. The production of materials decreased 0.5 percent: Both durable and energy materials posted declines, while the output of nondurable materials was unchanged. The reduction in the index for durable materials reflected similarly sized losses across all its major categories.

Industry Groups

Manufacturing output declined 0.4 percent in August; the index was also 0.4 percent below its level of a year earlier. In August, the production of nondurables moved down 0.2 percent, and the indexes for durables and for other manufacturing (publishing and logging) fell 0.6 percent and 0.7 percent, respectively. Many durable goods industries posted declines of nearly 1 percent or more, with the largest drop, 1.9 percent, recorded by machinery. Within nondurables, gains for food, beverage, and tobacco products and for paper were more than offset by declines elsewhere; the largest decrease, 2.1 percent, was recorded by textile and product mills.

The index for mining moved up 1.0 percent in August, with a decline in coal mining outweighed by increases in the indexes for oil and gas extraction, for oil well drilling and servicing, and for metal ore and nonmetallic mineral mining.

Capacity utilization for manufacturing decreased 0.4 percentage point in August to 74.8 percent, a rate that is 3.7 percentage points below its long-run average. The operating rate for nondurables moved down 0.2 percentage point; the rates for durables and for other manufacturing (publishing and logging) each declined 0.5 percentage point. The operating rate for mining moved up 1.0 percentage point to 76.2 percent, while the rate for utilities decreased 1.3 percentage points to 80.4 percent.

ABC 7:30 Does Lenders Mortgage Insurance

7:30 did a segment tonight on Lenders Mortgage Insurance (LMI). As we discussed in an earlier post there are a number of issues which make LMI a complex area.  The segment includes comments from DFA.

Households wising to borrow at an LVR above 80% will be required to pay a significant insurance premium to get a mortgage – Lenders Mortgage Insurance. This extra cost may be bundled into their overall mortgage, or will be a large additional cost.

Many households are not clear on what is truly covered by the LMI in case of default. Whilst LMI may protect the bank, households are not necessarily protected.

In addition, the costs of LMI are not necessary transferable, and there are some industry concentration risks caused by the limited market of providers, over and above the captive insurers within the banks.


Social media and defamation law pose threats to free speech, and it’s time for reform

From The Conversation.

Recent discussion about freedom of speech in Australia has focused almost exclusively on Section 18C of the Racial Discrimination Act. For some politicians and commentators, 18C is the greatest challenge to freedom of speech in Australia and the reform or repeal of this section will reinstate freedom of speech.

social-media-pic

There are many challenges to freedom of speech in Australia beyond 18C, for example defamation law. Defamation law applies to all speech, whereas 18C applies only to speech relating to race, colour or national or ethnic origin.

The pervasive application of defamation law to all communication creates real risks of liability for publishers. Large media companies are used to managing those risks. But defamation law applies to all publishers, large and small. Now, through social media, private individuals can become publishers on a large scale.

A significant reason that defamation law poses a risk to free speech is that it is relatively easy to sue for defamation and relatively difficult to defend such a claim. All a plaintiff will need to demonstrate is that the defendant published material that identified the plaintiff, directly or indirectly, and that it was disparaging of their reputation.

In many cases, proving publication and identification is straightforward, so the only real issue is whether what has been published is disparaging of the person’s reputation. Once this has been established, the law presumes the plaintiff’s reputation has been damaged and that what has been published is false.

It is then for the publisher to establish a defence. The publisher may prove that what has been published is substantially accurate, or may claim that it is fair comment or honest opinion (but the comment or opinion must be based on accurately stated facts), or may be privileged. Truth, comment and privilege are the major defences to defamation.

One of the main criticisms of 18C is that it inhibits people from speaking freely about issues touching on race. In essence, this criticism is that 18C “chills” speech.

The ability of the law to inhibit or “chill” speech is not unique to 18C. The “chilling effect” of defamation law is well-known. Precisely because it is easier to sue, than to be sued, for defamation, the “chilling effect” of defamation law is significant.

Defamation claims based on social media publications by private individuals are increasingly being litigated in Australia. In 2013, a man was ordered to pay A$105,000 damages to a music teacher at his former school over a series of defamatory tweets and Facebook posts. In 2014, four men were ordered to pay combined damages of $340,000 to a fellow poker player, arising out of allegations of theft made in Facebook posts. In the former case, judge Elkaim emphasised that:

… when defamatory publications are made on social media it is common knowledge that they spread. They are spread easily by the simple manipulation of mobile phones and computers. Their evil lies in the grapevine effect that stems from the use of this type of communication.

More defamation cases arising out of social media can be anticipated. Indeed, the cases that make it to court represent only a fraction of the concerns about defamatory publications on social media. Many cases settle before they reach court and still more are resolved by correspondence before any claim is even commenced in court.

There are several ways in which defamation law might be reformed in Australia that could promote freedom of speech, particularly for everyday communication.

Currently, plaintiffs suing for defamation in Australia do not have to demonstrate that they suffered a minimum level of harm at the outset of their claims. Publication to one other person is sufficient for a claim in defamation, and damage to reputation is presumed. Defamation law is arguably engaged at too low a level in Australia.

English courts have developed two doctrines to deal with low-level defamation claims. It is worth considering whether these should be adopted in Australia.

The first is the principle of proportionality. This allows a defamation claim to be stayed where the cost of the matter making its way through the court would be grossly disproportionate to clearing the plaintiff’s reputation. A court would view such a claim as an abuse of process.

There has been some judicial support for this principle in Australia, most notably Justice McCallum in Bleyer v Google Inc, but there has also been judicial criticism and resistance.

The other English development is the requirement that a plaintiff prove a level of serious or substantial harm to reputation before being allowed to litigate.

Australian law does have a defence of triviality, but it is difficult to establish because of the terms of the legislation. It also only applies after the plaintiff has established the defendant’s liability. By contrast, the threshold requirement of serious or substantial harm can stop trivial defamation claims before they start.

Another way in which the balance between the protection of reputation and freedom of speech online could be effectively recalibrated is by developing alternative remedies for defamation.

Notwithstanding previous attempts at defamation law reform, it remains the case that an award of damages is still the principal remedy for defamation. Yet people who have had their reputations damaged would probably prefer a swift correction or retraction, or to have the material taken down, or have a right of reply, than commencing a claim for damages.

Currently, people can negotiate these remedies by threatening to sue, or suing, and hoping they can secure these remedies as part of a settlement. Australian law has no effective small claims dispute resolution system for defamation in the way that it does for other small claims, such as debts. More effective and more accessible remedies are another aspect of defamation law reform worth exploring.

The discussion about freedom of speech in Australia recently has been unduly narrow. Every Australian has an interest in freedom of speech, not only about issues of race. Every Australian also has an interest in the protection of their reputation.

It is time to widen the focus of the treatment of free speech under Australian law. Defamation law is an obvious area in need of reform on this front.

Author: David Rolph, Associate Professor of Media Law, University of Sydney

The housing market is looking worryingly like a pyramid sales scam

From The UK Conversation.

Are you on the property ladder? You might want to look again. That comforting metaphor of an aspirational route to economic security has come to dominate our thinking, but what if it wrongly describes the phenomenon? There has been a steady decrease in the number of first-time house buyers since 1980, with the biggest drop of 47% occurring from 2007 to 2008. It may be that the British housing market now resembles the classic pyramid scheme scam that rewards those at the top and punishes the fools who dive in too late or can’t dive in at all.

I’m certainly not the first to think of the housing market in this way. As journalist Gabby Hinsliff observed:

Rather like pyramid-selling scams, housing markets need a constant stream of fresh-faced hopefuls coming in at the bottom in order to keep delivering big returns at the top.

So is this really true, and if it is, should we continue to tolerate such a mainstream social practice which seems to be so ethically dubious?

A losing game

The classic pyramid scheme is essentially a sales scam. Someone is recruited and pays a fee to join a team ostensibly flogging something – health supplements, perhaps, or even providing no product or service at all. This recruit then gets a cut from the fees paid by the salespeople he or she newly recruits. They then do the same. Very quickly, the scheme reaches saturation point.

Two more generations of suckers? EPA/HANNAH MCKAY

So how does this relate to the housing market? Let us begin with an essential feature of pyramid schemes: most people lose. This involves the membership factor in which new recruits pay a progressively higher fee to get onto the pyramid. In other words, the pyramid is driven by a top-down dynamic. Those at the lowest level try to recoup what they paid to become members by making a profit off those wishing to gain access to the scheme. Chronologically, those who come later have a greater risk of losing.

Under the current economic system, those pensioners sitting on six-bedroom townhouses in chic parts of London, bought for pennies in the post-war period, are our equivalent of pyramid scheme bosses – through no fault of their own, of course.What makes the housing market more restrictive than a classic sales scam is that its sale item is finite in supply. There may be an almost unlimited supply of health supplements in the example above, but with housing there is only so much land available. This makes entry into the scheme more competitive, and by virtue of that, it has the effect of increasing demand.

In short, most people lose in the housing market because most people who do not own property can never really afford to do so. Despite government efforts to help, first-time buying has continued to struggle, and the odds of finding an affordable price are stacked against non-owners. They may even find that those most willing to buy property already own some. Indeed, such speculators know that the more they buy up land, the more it will tend to be in higher demand.

Saturation

There is a second essential feature of pyramids: most people lose because there is no one left to pay the higher fee. In effect the market reaches saturation point. In housing, this happens because non-owners, who usually constitute the majority of the population, cannot find the means to make the high fee payments – in other words, a mortgage deposit and monthly payments. And this is where the ethically dubious nature of the scheme emerges.

In classic pyramids, the good or service being sold is not really important. With the housing market, the good in question is essential. One can easily live without health supplements, for example. Yet, show me one person who can live and work without access to land or shelter. In other words, at the sake of making a profit for the few, the majority of people are denied access to land, which is access to the opportunity to flourish.

It will have damaging effects more broadly, too. In a build-up of the housing market, the allure of property investment is so high that money is diverted to buying property rather than to production. Without investment in production, non-owners do not see an increase in their wages. If we go back to the pyramid scheme set-up, investment in production is like telling a salesperson to concentrate on selling the vitamin supplements, rather than on recruiting more salespeople into the scheme, which is where the easy money lies.

No knockdown prices here. stockcreations/Shutterstock

Why fund a new business and wonder about whether it is going to succeed when you can buy the land on which either the business relies or on which its employees rely in order to live? If investing in property means diverting money from production and wages, then the economic system is bound to break. In other words, we are all bound up in this giant pyramid scheme whether we like it or not; whether we own property or not; whether we are suckers are not.

The obsession with maintaining the everlasting growth in the housing market places the economy in a stranglehold and engenders something that looks very much like a pre-crash phase. It’s not just the non-owners who lose, but because production itself takes a hit, property owners also lose in terms of property investments which do not make a return.

So why hasn’t the housing market caused the economy to break once and for all? Well it certainly came close in 2008, but our economic system seems flexible enough to make adjustments that keep us afloat. However, these adjustments are makeshift reactions to a system’s fundamental problems rather than a remedy. Why not fix the problems? Why not raze the pyramid that is the housing market? To do that would require a philosophical change: an appeal to understanding how land (and thus housing) constitutes a unique kind of primary good that cannot be subject to the same kinds of conventions as capital.

Author: Todd Mei, Lecturer in Philosophy, University of Kent

ASIC releases guidance on review and remediation

ASIC has released guidance on review and remediation conducted by Australian financial services (AFS) licensees providing personal advice to retail clients.

Piggy-Bank-3

This follows Consultation Paper 247 Client review and remediation programs and update to record-keeping requirements (CP 247), issued in December 2015 (refer: 15-388MR).

The guidance reflects work done with industry over the past several years where ASIC has worked with advice licensees with large remediation programs to shape the scope and nature of remediation arising from systemic advice issues.

The key principles set out in the guidance are:

  • review and remediation is likely to be appropriate where a systemic issue has occurred that may have caused loss or detriment to clients
  • the scope of review and remediation should ensure it covers the right advisers, the right clients and the right timeframe
  • the process of review and remediation should be comprehensive, timely, fair, and transparent. There should be clearly defined principles to guide the process and an appropriate governance structure
  • effective, timely and targeted communication is key to ensuring that clients understand the review and remediation and how it will affect them; and
  • clients should have access to an EDR scheme if they are not satisfied with the remediation decision made.

‘ASIC wants to ensure that advice licensees proactively address any systemic problems caused by their conduct and, where necessary, put processes in place to remediate their clients for loss suffered in a way that is timely, fair and transparent,’ ASIC Deputy Chairman Peter Kell said.

‘Advice firms that take effective and timely steps to fix problems if something goes wrong will be much better placed to retain the trust and confidence of their clients,’ said Mr Kell

In the 2015-16 financial year, ASIC secured over $200 million in compensation and remediation for financial consumers and investors across the areas it regulates.

While the guidance is directed at licensees who provide personal advice to retail clients, review and remediation takes place in many other sectors of the financial services industry. The principles set out in the guidance should be applied to other review and remediation where relevant.

ASIC will shortly release an amendment to Class Order [CO 14/923] Record-keeping obligations for Australian financial services licensees when giving personal advice together with a report summarising the key feedback ASIC received in response to CP 247, and our response to that feedback.

$500,000 non-concessional cap scratched

According to the Financial Standard, the Federal Government has reworked its 2016 Budget measures on superannuation to drop the $500,000 lifetime non-concessional cap and alter several other policies.

Audit-Pic

Treasurer Scott Morrison announced the changes this morning and said the government will replace the $500,000 proposal with a new measure to reduce the existing annual non-concessional contributions cap from $180,000 per year to $100,000.

The move will cost government revenue $400 million over forward estimates but Morrison said introducing eligibility for non-concessional contributions to those with less than $1.6 million in superannuation limits the cost of this change over the medium term.

He added: “In order to fully offset the cost of reverting to a reduced annual non-concessional cap, the Government will now not proceed with the harmonisation of contribution rules for those aged 65 to 74. While the Government remains supportive of the increased flexibility delivered by this measure, it can no longer be supported as part of this package, without a net cost to the Budget.”

Under the reworked package, individuals aged 65 to 74 who satisfy the work test will still be able to make additional contributions to superannuation. Morrison said this will encourage individuals to remain engaged with the workforce which is of benefit to the economy more generally.

Individuals aged under 65 will continue to be able to “bring forward” three years’ worth of non-concessional contributions in recognition of the fact that such contributions are often made in lump sums. The overwhelming bulk of such larger contributions are typically less than $200,000, Morrison said.

“Individuals with a superannuation balance of more than $1.6 million will no longer be eligible to make non-concessional (after tax) contributions from 1 July 2017. This limit will be tied and indexed to the transfer balance cap,” he said.

“This ensures that we focus the entitlement for after tax contributions to those Australians who have an aspiration to maximise their superannuation balances and reach the transfer balance cap in the retirement phase, where a zero tax on earnings applies.

“These measures mean that with their annual concessional contributions, Australians will be able to contribute $125,000 each year and, if taking advantage of the non-concessional “bring forward”, up to $325,000 in any one year until such time as they reach $1.6 million.

“While noting that less than 1% of superannuants now reach the proposed transfer balance cap of $1.6 million, these improvements will mean Australians will be given a clear and better opportunity to realise their aspiration to build their balance to the limit of the transfer balance cap.

“In addition, the commencement date of the proposed catch-up concessional superannuation contributions will be deferred by 12 months to 1 July 2018 to ensure the full cost of changes to non-concessional contribution arrangements are met over both the forward estimates and the medium term.”

Morrison added these measures will ensure that 96% of Australians remain better off or unaffected by the Government’s superannuation reforms “that will introduce greater flexibility and sustainability to our retirement income system.”

The Association of Superannuation Funds of Australia (ASFA) said it supports the government’s revised superannuation package announced this morning and urges the Parliament to pass the changes as soon as practical, in order to provide certainty for people saving for their retirement.

ASFA interim CEO Jim Minto said: “ASFA has long advocated for both a lifetime cap on non-concessional contributions and a limit on the total amount tax free in retirement. The revised superannuation proposals address both issues.

“The key message for savers is that they should have confidence in their super.”

Industry Super Australia chief executive David Whiteley said the policy shift was a “workable compromise.”

Household Cash Flows and Monetary Policy

The RBA released the September 2016 edition of the Bulletin today. The article “The Household Cash Flow Channel of Monetary Policy by Helen Hughson, Gianni La Cava, Paul Ryan and Penelope Smith is interesting, but possibly flawed.

It looks at the impact of households when the cash policy rate is changed. Lower interest rates can encourage households to save less and bring forward consumption from the future to the present (the inter-temporal substitution channel).

Lower interest rates can also lift asset prices, such as housing prices, and the resulting increase in household wealth may encourage households to spend more (the wealth channel). Additionally, lower interest rates reduce the required repayments of borrowing households with variable-rate debt, resulting in higher cash flows and potentially more spending, particularly for households that are constrained by the amount of cash they have available. At the same time, lower interest rates can reduce the interest earnings of lending households, which may, in turn, lead to lower cash flows and less spending for these households. These last two channels together are typically referred to as ‘the household cash flow channel’.

The analysis in this article focuses on a fairly narrow definition of the cash flow channel. It examines the direct effects of interest rates on interest income and expenses, but abstracts from monetary policy changes that have an indirect cash flow effect by influencing other sources of income, such as labour or business income.

rba-sep-2016-1Household disposable income, or cash flow, comprises wages and salaries, property income (including interest paid on deposits) and transfers, less taxes and interest payments on debt. The household sector in Australia holds more interest bearing debt than interest earning assets. Indeed, households have increased their debt holdings at a rapid pace since the early 1990s, mainly due to an increase in mortgage debt. For the household sector as a whole, the level of household debt now exceeds the level of directly held interest earning deposits by a significant margin. However, since the mid 2000s, slower growth in household debt and increases in interest-earning deposit balances (including balances held in mortgage offset accounts) has led to a decline in net interest bearing debt. This means that the household sector is a net payer of interest. Household net interest payments increased through the 1990s and early 2000s, mainly reflecting the rise in net household debt, but trended down from 2007 as interest rates and net debt declined.

The data shown above do not account for interest earning assets held in managed superannuation accounts, which have increased substantially since the early 1990s. The majority of these assets cannot be accessed until retirement.

This article finds evidence for both the borrower and lender cash flow channels, but the borrower channel is estimated to be the stronger channel of monetary transmission. One reason for this is that while there are roughly similar shares of borrower and lender households in the Australian economy, the average borrower holds two to three times as much net debt as the average lender holds in net liquid assets. Another reason is that the sensitivity of spending to changes in interest-sensitive cash flow is estimated to be larger for borrowers than for lenders based on statistical analysis using household-level data.

Overall, the estimates suggest that the cash flow channel is an important channel of monetary transmission; the central estimates indicate that lowering the cash rate by 100 basis points is associated with an increase in aggregate household income of around 0.9 per cent, which would, in turn, increase household expenditure by about 0.1 to 0.2 per cent through the cash flow channel.

We have a couple of issues with their analysis. First, recent events have shown that when the cash rate is cut, the benefit is not necessarily passed through to households, thanks to weak competition in the banking sector. When it is, the benefit is often not equally shared between borrowers and savers, and not all savers benefit equally. In fact, looking at the trends in recent years, savers have been taken to the cleaners, as banks repair and protect their margins. So benefits are overstated.

The second issue is households will be impacted by the confidence surrounding a rate move. If they become less confident, they will be less likely to spend, preferring to save for later. So a rate cut often lowers household spending – this is one of the significant reversals we have seen recently – and central banks are still trying to get to grips with the implications. The link between low interest rates and household spending, yet alone broader economic growth appears broken.

So, whilst the article is a good attempt, we think it overstates the benefits of cash rate cuts in the current cycle.

Trend Unemployment Unchanged At 5.7%

Monthly trend employment in Australia increased in August 2016, according to figures released by the Australian Bureau of Statistics (ABS) today.

emp-aug-2106

In August 2016, trend employment increased by 9,900 persons to 11,965,100 persons – a monthly growth rate of 0.1 per cent. Trend part-time employment growth continued, with an increase of 10,200 persons, while full-time employment decreased by 400 persons.

”The latest Labour Force release shows continued strength in part-time employment growth, with the majority coming from increasing male part-time employment. Since December 2015, there are now around 105,300 more persons working part-time, compared with a 21,500 decrease in those working full-time,” said the Program Manager of ABS’ Labour and Income Branch, Jacqui Jones.

The trend monthly hours worked increased by 1.7 million hours (0.1 per cent), although it remained below the high in December 2015, reflecting the shift in full-time and part-time employment.

In considering the contribution of the Census to employment, the ABS confirmed that it will have resulted in an increase in hours that were worked during the month, more than the persons in employment. “Of the majority of the persons who were employed for the Census, most already had another job, but worked more hours during the month,” Ms Jones said.

The trend unemployment rate remained steady at 5.7 per cent. The participation rate was also unchanged at 64.8 per cent. Both of these figures have been relatively steady since May 2016.

The trend underemployment rate, which is a quarterly measure of employed persons who want and are available to work more hours, increased by 0.1 percentage points since May 2016, to 8.6 per cent in August 2016, the highest it has ever been.

Trend series smooth the more volatile seasonally adjusted estimates and provide the best measure of the underlying behaviour of the labour market.

The seasonally adjusted number of persons employed decreased by 3,900 in August 2016. The seasonally adjusted unemployment rate for August 2016 decreased by 0.1 percentage points to 5.6 per cent, and the seasonally adjusted labour force participation rate decreased by 0.2 percentage points to 64.7 per cent.

Home Loan Insights From Deep Segmentation

As we continue our journey into the depths of home loan segmentation analysis, using LTV, DSR and LTI ratios, we begin to see some insightful patterns emerging. Today we delve into our deep segmentation models.

We start by looking across the states and have sorted the results by DSR (Debt Servicing Ratio), as this is the most insightful lens, in our view. Households in NSW have the highest DSR, no surprise perhaps because home prices have risen strongly – so mortgages have grown – at a time when incomes have not. Remember DSR is based on current low interest rates, should they rise, the DSR will also raise. NSW also holds the prize for the highest average Loan to Income ratio, again because of the rise in market values, and mortgages. However, the average Loan to Value ratio is sitting at around 68%, compared with 72% in WA. DSR and LTI are the better indicators of potential risk, compared with LVR which only really comes into play as a factor if trying to sell into a downturn.

state-dsr-dtiNext we look at age bands. Younger households have on average higher DSR’s, and LVR’s. But it is worth highlighting that the highest LTI’s are residing in older households, because here whilst LVR’s are lower, limited incomes mean they are more exposed. We are seeing a significant rise in the number of households who still have a mortgage to pay off as they enter retirement.

age-dsr-dtiIf we look at the picture by $50k income bands we see that the highest LVR’s, LTI’s and DSR’s rest with households whose income is in the range $50-100k. Interestingly, LVR’s do not vary that much by income band, but both LTI’s and DSR’s improve with income. This is because more wealthy households are able to buy more expensive property, and service larger loans. Remember these cuts tell us nothing about the relative number of households or loans in each income band.

income-dsr-dti That analysis shows more than 46% of households with a mortgage have an income of $50-100k, and 26% have an income of $100-150k, whereas only 0.29% have an income of over $500k.

income-distTurning on our zonal segmentation, we see that households living in the inner suburbs have the highest DSR. This is because home prices are higher here, compared with outlying areas. Households in the regional and rural areas tend to have, on average, lower DSR, LTI and LVRs.

zones-dsr-dti  More than 12% of households live in the inner suburbs, compared with 26% in the outer suburbs and 22% in the urban fringe.

zone-countstSo to our master household segmentation. We use this to separate households based on a range of demographic indicators – which have proved reliable over many years. Young Growing families have the highest DSR (18.3) and the highest LVR (92.5%). Many have bought quite recently and are leveraged to the max. It is worth looking at the various measures across these segments as there are some fundamentally different things in play with different risk outcomes and sensitivities.

segment-dsr-dtiFinally, for today we look at the data through the lens of our technographic segmentation. We classify households into digital natives, migrants and luddites. The descriptions are self-explanatory, in that natives have always been digitally aligned, whereas migrants have adopted digital channels and luddites are resisting. Interestingly, natives have a higher DSR, LVR and LTI, compared with the other segments. This is because on average they are younger, and more likely to be in the main urban areas.

Such segmentation is important because Fintech’s need to understand where their potential markets are. We featured uno yesterday, a relatively new digital alternative to brokers. Digital natives would be directly in their sights.

techno-dsr-dtiNext time we will look at DSR, LVR and LTI by individual lenders – there are some interesting variations.

Shadow banking increases the risk of another global financial crisis

From The Conversation.

Banks may still be evading increased regulation by shifting activities to shadow banking. This system is well established as part of the financial sector, but it provides products that separate an investor from an investment, making it more difficult to evaluate risk and value.

Piggy-Bank-2

This lack of transparency increases the risk in our financial system overall, making it vulnerable to the types of shocks that caused the 2008 global financial crisis. A current example is the so-called “bespoke tranche opportunity” offered by shadow banks. This is similar to the notorious collateralised debt obligations, packages made up of thousands of mortgage loans some of which were sub-prime, blamed for the global financial crisis.

Shadow banking is comprised of hedge funds, private equity funds, mutual funds, pension funds and endowments, insurance and finance companies providing financial intermediation without explicit public liquidity and credit guarantees from governments. Shadow banking is usually located in lightly regulated offshore financial centres.

In the period leading up to the global financial crisis, a large portion of financing of securitised assets that allowed regulated banks to exceed limitations on their risk-taking was handled by the shadow banking sector.

To this day, shadow banking continues to make a significant contribution to financing the real economy. For example, according to the Financial Stability Board, in 2013 shadow banking assets represented 25% of total financial system assets. While the average annual growth in assets of banks (2011-2014) was 5.6%, shadow banking growth stood at 6.3%.

A comparison of country-based share of shadow banking assets between 2010 and 2014 reveals the largest rise for China from 2% to 8%, while the USA maintains its dominance of the shadow banking markets with around 40%.

The failure of private sector guarantees to help shadow banking endure the global financial crisis can be traced to underestimated tail risks by credit rating agencies, risk managers and investors. Credit rating agencies lack of transparency, when it comes to explaining their methods (often disguised as “commercial-in-confidence”), continue to make it difficult for a third party to check assessments.

An excess supply of inexpensive credit also contributed to risk before the global financial crisis of 2008. This was because investors overestimated the value of private credit and liquidity enhancements.

One of the key challenges for regulators now is to devise rules and standards requiring shadow markets to hold enough liquidity to be sufficiently sensitive to risk. However, where investors and financial intermediaries fail to identify new risks, it is less likely that the regulators – who have fewer resources – will succeed.

Raising capital requirements can limit the capacity of financial intermediaries to expand risky activities, although monitoring overall bank leverage may be better. This is because credit ratings cannot be relied upon in the presence of neglected risks. Similarly, monitoring rising exposure of regulated banks to shadow banking or untested financial innovations can also become part of the regulator’s arsenal.

But there remains a major problem that is unlikely to be resolved by any regulation. Regulation is meant to strike a fine balance between close supervision and allowing space for financial innovation because loss of diversity can create stronger channels of transmission and could expose financial systems to greater systemic risk.

Too little regulation encourages excessive risk taking, while too tight a regulation is bound to strangle the financial sector that provides the lifeline for the economy. Striking such a fine balance is next to impossible in a dynamic, global financial sector.

The Basel Accords, set up to strengthen regulation after the financial crisis, will continue to play a key role in helping manage systemic risk like this. For example regulations can collect data that would be useful in macroprudential regulation, taking action to reduce various risks and remaining alert to unfolding trends on the ground.

Regulators need to heed the trends in shadow banking as part of this, to ensure transparency. However the nature of this sector, the long chains and multiple counterparties with unclear financial obligations, will continue to make the job of the regulator very difficult.

Author: Necmi K Avkiran, Associate Professor in Banking and Finance, The University of Queensland