The Fallout From Low Interest Rates

The current environment of low growth and the resulting low interest rates are already having significant economic, legal and social repercussions.

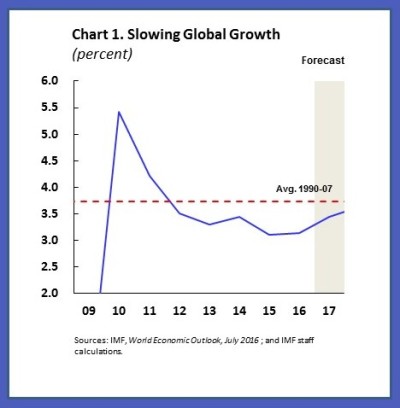
We are in a phase of weak growth and low interest rates – not only in Europe but in many mature economies. Without there being a final consensus, experts are providing a colourful bunch of possible explanations for the decline in growth potential over the past few years. Regardless of whether the causes are on the demand or supply side, there is broad agreement that the strong relative surplus of savings – some call it a savings glut – has resulted in a worldwide fall in long-term interest rates.

Piggy-BusinessIn a speech by Mr Yves Mersch, Member of the Executive Board of the European Central Bank, at the University of the Deutsche Bundesbank, Hachenburg, 27 October 2016, he looks at the economic, legal and social implications.

Impact of low interest rates on the economy

The low interest rate environment is having an impact on our lives in many different ways. Let us start with what you as central bankers of the future will certainly be most interested in: the economic challenges for the European Central Bank (ECB).

Low investment and an increased tendency to save have resulted in a fall in the equilibrium interest rate – the price at which savings and investment are in equilibrium. This is important because this interest rate plays an important role in the orientation of our monetary policy. But more about that later.

Perhaps the greatest risk in such an environment is that individual developments can reinforce one other: the expectation of lower growth in the future can lead to lower investment and excessive saving today.

As I have said before, it is important to avoid a Ricardian angst effect, meaning that persistently low interest rates result in savers developing a higher tendency to save in order to accumulate the same wealth as they would have at higher interest rates.

The fact that the gross savings ratio has been rising again recently in many euro are countries – standing currently at 17.5% in Germany, 14.4% in France – demands our attention.

The International Monetary Fund has put forward similar arguments, warning recently of a “low growth trap“.

Such a development would lead to even lower interest rates, as ever more savings would compete for ever fewer investment opportunities. Greater risks of deflation could ensue.

A central bank cannot disregard such risks. Our mandate is based on maintaining price stability, which is defined as an inflation rate of below, but close to, 2% over the medium term. If we see this objective at risk, we must act.

Let us remind ourselves how monetary policy traditionally works.

In his main work “Geldzins und Güterpreise” (1898), Knut Wicksell investigated the influence of monetary policy on investment and savings behaviour, as well as on the economy. He stated that if the key interest rate is reduced to below the natural interest rate, savings are lower and consumption is higher. The natural rate is “the loan interest rate at which this reacts in an entirely neutral way to goods prices.”

As a result, aggregate demand increases. This will raise the incentives for businesses to invest and they will demand more loans. If the demand for loans is so large that it is not met by the existing savings, the gap will be filled by newly created money.

Interest rate cuts thus lead to loan creation, investment and greater consumption. Investment will lead to higher salaries. As a result, the prices of goods will rise more rapidly. Conversely, higher interest rates dampen demand and price increases.

In short: if the market rate is lower than the natural rate, inflation will tend to occur, and when the opposite is true, then disinflation or even deflation are likely to result.

The problem of a lower equilibrium rate is that it limits a central bank’s leeway for supporting measures. If then in such an environment further economic shocks occur on the demand side, the central bank has to resort rather to unconventional measures, as it can only lower the policy rate to a limited extent.

The package of measures taken by the ECB reflects this situation. It consists of a mixture of conventional and unconventional measures: first of all, we have reduced the key rate to zero, and the rate on the deposit facility is even at -0.4%. In addition, we have launched an asset purchase programme and offered long-term loans to banks at favourable conditions which reward additional loan provision. The aim of all our measures is to keep market rates below their long-term level and thus create an incentive for investment and consumption.

Finally, we want to ensure that the inflation rate over the medium term returns to close to the 2% level. But as long-term interest rates are already at a very low level, market interest rates also have to be low and even negative in order to achieve an appropriate level of support.

In order to assess the effectiveness of our actions, it is important to observe our monetary policy measures not in isolation but as a whole: demand for loans is increasing and our staff estimate that inflation in the euro area will rise to 1.6% in 2018. In 2019 we should largely achieve our aim of below, but close to, 2%. In other words, our monetary policy is working.

However, we are also aware that our measures are having side effects and are keeping this in mind. In particular, we are aware of the fact that these side effects are heightened the longer we maintain our measures. We are therefore keeping a very close eye on the effects that the low or negative interest rate environment has on banks, insurers and savers.

Indeed, banks are complaining that the profitability of their sector is being affected by the low interest rate environment. This is particularly the case for banks whose business model depends heavily on net interest income. First of all, the margins derived from maturity transformation are declining because of the very flat yield curve. And secondly, deposit-based refinancing becomes less profitable, mainly because it is difficult to pass on negative interest rates to private customers.

Some banks have started to charge for deposits over €100,000. Ultimately, however, it will mean that some banks will have to adapt their business models to operate profitably in the long term.

Particularly in Germany there is a need for action. And this is not primarily due to the low interest rate environment. The German banking sector is one of the largest in the euro area, but at the same time the most inefficient. The cost-income ratio of German banks stands at 73%, significantly higher than the rest of the euro area.

And while other countries reduced the number of their banks by almost a quarter following the financial and economic crisis to reduce overcapacity, in Germany it was only 10%. Life insurance companies and pension funds which have promised their customers a nominal rate of return are also coming under pressure: they are finding it difficult to generate these returns in the current market environment. However, we are already seeing that the industry is adapting and focusing somewhat more on unit-linked products, and thus on the more dynamic capital market. However, it is not just banks, insurance companies and pension funds that are suffering from the low interest rates – savers in general are also affected. Private savers are asking whether, in the current environment, it is still worthwhile saving at all. In most cases they take the nominal interest rate of their deposits as a benchmark. In so doing, what they don’t take account of is the real purchasing power of their savings, namely what is left over after deducting the inflation rate. If we consider for instance the real rate of return on bank deposits of private households in Germany since 1991, these generally remained at less than 1%, and sometimes they were even negative. The real overall portfolio return shows large fluctuations over the same period as a result of different factors, and stood just above 1.5% on average between 2008 and early 2015.

In recent years, higher valuation gains above all have supported the overall rate of return, to which our asset purchase programme has also contributed. Because the scope for further valuation gains in the future is estimated to be fairly limited, analysts in Germany are assuming that overall returns in the coming year could decline or even be negative, also because of higher inflation.

These developments suggest that the low-interest phase may lead to a structural change in the financial system, which in turn could give rise to new risks.

Especially in the euro area countries which have been greatly affected by the financial and economic crisis, lending by some banks is still severely constrained by legacy assets resulting from crisis times. On the search for yield and reinforced by technological progress new participants are coming to the fore in these fields. In particular, non-banks, which also go by the unfortunate name of shadow banks, are increasingly active in the traditional banking business. At the same time, sound and liquid companies from the real economy are entering the intermediation market and providing their customers with services that used to be the preserve of banks.

While developments of this kind need not be a bad thing in principle, we should be vigilant and closely monitor the resulting risks. For example, lower lending standards or higher debt levels could result. We also have to bear in mind the liquidity risks and interconnectedness of the various sectors.

Despite all these side effects, I would like to emphasise that the benefits of our monetary policy so far are prevailing. But this situation could change the longer these special circumstances continue. Above all, we need to remember that reactions to interest rate cuts into negative territory do not necessarily follow a linear path.

Moreover, the longer the measures are in place, the less effective they may become. The fact that additional lending in the euro area is losing momentum and that German banks are saying that the negative deposit facility rate is constraining lending volumes warrants attention.

We must be vigilant that this development does not spread to other euro area countries.

So when it comes to deciding what our future monetary policy stance should be, we have to take this into account in our cost/benefit analysis. This applies to instruments, volumes and horizons.

Legal implications

Let me now turn to the legal dimension. I will make a distinction here between private law challenges and the legal framework to which the ECB is subject.

In the financial sector, there are many products whose remuneration is based on a variable interest agreement. This means that the interest rates are regularly adapted to the prevailing market interest rates. The legal position here is very unclear, since in Europe such agreements are subject not only to private law but also to regulatory requirements, based on the implicit assumption that interest rates are always positive in a market economy

This new phenomenon of negative interest rates creates uncertainty and leaves much room for interpretation. This could lead to high legal costs if the need for clarification becomes a matter for the courts.

The legal limits to our monetary policy are, on the other hand, very clearly regulated. The EU Treaties define the objective of our monetary policy measures: maintaining price stability. The ECB has a large measure of freedom in its choice of instruments to achieve this objective. However, it must ensure that the instruments chosen are necessary, appropriate and proportionate. In addition, it must be ensured that the European System of Central Banks (ESCB) “[acts] in accordance with the principle of an open market economy with free competition, favouring an efficient allocation of resources”.

And finally, we are prohibited from conducting monetary financing. This prohibition protects monetary policy against becoming a plaything of fiscal policy. So what may at first sight seem to be a restriction is, in reality, a strengthening of our mandate and our credibility.

All the measures that we have taken over the past few years fall within this legal framework. The European Court of Justice and the German Constitutional Court have confirmed that this is the case, provided that the self-imposed boundaries are observed. We would do well not to shift these boundaries at whim, as this would call the current legal certainty into question.

In the current environment, this means that we are doing and will continue to do everything within our mandate to ensure price stability in the euro area. But it also means that others have to play their part in putting the euro area back on a sustainable growth path over the long term. And I address these remarks principally to the governments of the Member States which need to make progress on the necessary structural reforms in order to make product and labour markets more flexible, to reduce red tape and where possible to invest in education, infrastructure and productivity improvements.

Breeding ground for populist movements

This brings me to my last point: societal change. Like the low interest rate environment in which we as a central bank are operating, the current social dislocation is being caused by, among other things, low growth and the resulting high levels of unemployment in many economic areas. The fact that the recent annual meeting of the International Monetary Fund and the World Bank addressed this issue earlier this month shows how important this issue has become.

The solution to these problems does not however lie in the hands of the central banks. As I said, we are only responsible for maintaining price stability. Fiscal redistribution, for example, for the purpose of a politically motivated correction of income differences has to be decided and implemented by democratically elected parliaments. The division of tasks is clear.

Nevertheless, the societal changes over recent years have had an impact on us, and we observe these developments with great concern.

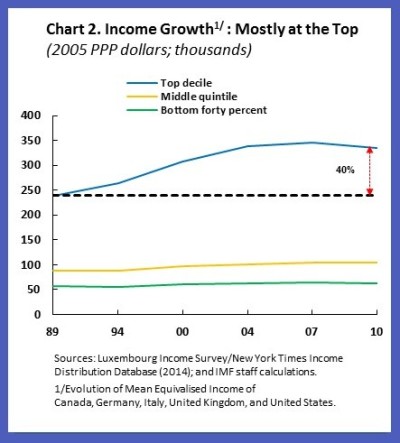
The fact is that many people in our society are finding globalisation difficult. They believe that it only benefits large companies, some of which pursue excessive tax optimisation and question protection rights for individuals – protection rights for those who are doing their bit for society. This sentiment, reinforced by the emotional reactions to the refugee crisis, has discredited the notion of open borders.

In addition, growing uncertainty about secure pension provisions, retaining the value of savings and the deteriorating economic outlook are a breeding ground for populist parties and movements. A growing number of people are ready to sacrifice economic and social freedom for what they believe to be greater security.

In such an environment, it will be more difficult for us, as a central bank, to explain our monetary policy decisions, particularly if some groups feel discriminated against by our decisions, such as savers in Germany. We must take these feelings seriously, although the interest rate on savings reflects the state of the economy and is not primarily the result of monetary policy measures

Our monetary policy measures have prevented the euro area from sliding into a new recession. In the long term our decisions help to stabilise the value of the currency and thus ensure more fairness in society. A Bundesbank study, for example, which considers whether and in what way monetary policy influences the distribution of income and wealth, concludes that it is highly questionable that the expansionary monetary policy measures taken in recent years have increased inequality overall.

The Low Growth Trap

Low growth, high inequality, and slow progress on structural reforms are important issues for the global economy. The political pendulum threatens to swing against economic openness, and without forceful policy actions, the world could suffer from disappointing growth for a long time. The IMF’s Christine Lagarde argues that forceful policy actions are needed to avoid a low-growth trap in the IMF Blog.

2016 will be the fifth consecutive year with global GDP growth below its long-term average of 3.7 percent (1990-2007), and 2017 may well be the sixth (Chart 1). Not since the early 1990s—when ripple effects from economic transition caused growth to slow—has the world economy been so weak for such a long time. What has happened?

Chart 1 with background

In advanced economies, real growth is running almost a full percentage point below the average of 1990-2007.

  • Many are still plagued by crisis legacies, such as private and public sector debt overhangs, and impaired balance sheets of financial institutions. The result has been stubbornly weak demand.
  • The longer demand weakness lasts, the more it threatens to harm long-term growth as firms reduce production capacity and unemployed workers are leaving the labor force and critical skills are eroding. Weak demand also depresses trade, which adds to disappointing productivity growth.
  • On the supply side, slowing productivity and adverse demographic trends are weighing on potential growth—a trend that started before the global financial crisis. And with little expectation of stronger growth tomorrow, firms have even less incentive to invest, which hurts both productivity and short-term growth prospects.

Emerging economies have also been slowing—but from an exceptionally fast pace of growth in the past decade. Their slowdown is therefore more a return to the historical norm. Developments within emerging economies are quite diverse. In 2015, for example, GDP in two of the four largest economies—China and India—grew between 7-7½ percent, while GDP contracted by close to 4 percent in the other two—Russia and Brazil. But there are important common factors:

  • One is the rebalancing of the Chinese economy from investment to consumption, and from external demand to domestic demand. While a stable Chinese economy growing at sustainable rates is ultimately good for the world economy, the transition is costly for trading partners that rely on Chinese demand for their exports. It can also trigger bouts of financial volatility along the way.
  • The second, related, development is the large decline in commodity prices, which has taken a toll on disposable income for many commodity exporters. The adjustment of commodity exporters to this new reality will be difficult and protracted. In some cases, it calls for a change in their growth model.

Weak global growth that interacts with rising inequality is feeding a political climate in which reforms stall and countries resort to inward-looking policies. In a broad cross-section of advanced economies, incomes for the top 10 percent increased by about 40 percent in the past 20 years, while growing only very modestly at the bottom (Chart 2). Inequality has also increased in many emerging economies, although the impact on the poor has sometimes been offset by strong general income growth.

Chart 2 with Background

Forceful policy actions are needed to avoid what I fear could become a low-growth trap. Here are the key elements of a global growth agenda as I see them:

  • The first element is demand support in economies that operate below capacity. In recent years, this task has been delegated mostly to central banks. But monetary policy is increasingly stretched, as several central banks are operating at or close to the effective lower bound for policy rates. This means fiscal policy has a larger role to play. Where there is fiscal space, record-low interest rates make for an excellent time to boost public investment and upgrade infrastructure.
  • The second element is structural reforms. Countries are not doing nearly enough in this area. Two years ago, the members of the G20 pledged reforms that would lift their collective GDP by an additional two percent over 5 years. But in the most recent assessment, the measures implemented to date are worth at most half this amount—so more reforms are urgent. IMF research shows that reforms are most effective when they are prioritized along countries’ reform gaps and take into account the level of development and position in the business cycle.
  • The third element is reinvigorating trade by reducing trade costs and rolling back temporary trade barriers. It is easy to blame trade for all the ills afflicting a country—but curbing free trade would be stalling an engine that has brought unprecedented welfare gains around the world over many decades. However, to make trade work for all, policymakers should help those who are adversely affected through re-training, skill building, and assisting occupational and geographic mobility.
  • Finally, policies need to ensure that growth is shared more broadly. Taxes and benefits should bolster incomes at the low end and reward work. In many emerging economies, stronger social safety nets are needed. Investments in education can raise both productivity and the prospects of low-wage earners.

It takes political courage to implement this agenda. But inaction risks reversing global economic integration, and therefore stalling an engine that, for decades, has created and spread wealth around the globe. This risk is, in my view, too large to take.


RBS Reports Loss of £469 million in Q3 2016

UK Bank, Royal Bank of Scotland has reported an operating profit before tax of £255 million, but an attributable loss of £469 million in Q3 2016.

This included restructuring costs of £469 million, litigation and conduct costs of £425 million (relating to US residential mortgage backed securities) and a £300 million deferred tax asset impairment.

This compared with a profit of £940 million in Q3 2015 which included a £1,147 million gain on loss of control of Citizens.

They reported a Common Equity Tier 1 ratio of 15.0% which increased by 50 basis points in the quarter and remains ahead of their 13% target.

The leverage ratio increased by 40 basis points to 5.6% principally reflecting the £2 billion Additional Tier 1 (AT1) issuance.

rbs-pic

  • RBS reported an attributable loss of £469 million in Q3 2016 compared with a profit of £940 million in Q3 2015 which included a £1,147 million gain on loss of control of Citizens. Q3 2016 included a £469 million restructuring cost, £425 million of litigation and conduct costs and a £300 million deferred tax asset impairment. The attributable loss for the first nine months of the year was £2,514 million and operating loss before tax was £19 million.
  • Q3 2016 operating profit of £255 million compared with an operating loss of £14 million in Q3 2015. Adjusted operating profit of £1,333 million was £507 million, or 61%, higher than Q3 2015 reflecting increased income and reduced expenses.
  • Income across PBB and CPB was 2% higher than Q3 2015, adjusting for transfers, and was stable for the year to date, as increased lending volumes more than offset reduced margins. CIB adjusted income increased by 71% to £526 million, adjusting for transfers, the highest quarterly income for the year, driven by Rates, which benefited from sustained customer activity and favourable market conditions following the EU referendum and central bank actions.
  • NIM of 2.17% for Q3 2016 was 8 basis points higher than Q3 2015, as the benefit associated with the reduction in low yielding assets more than offset modest asset margin pressure and mix impacts across the core franchises. NIM fell 4 basis points compared with Q2 2016 reflecting asset and liability margin pressure.
  • PBB and CPB net loans and advances have increased by 13% on an annualised basis since the start of 2016, with strong growth across both residential mortgages and commercial lending.
  • Excluding expenses associated with Williams & Glyn, write down of intangible assets and the Q2 VAT recovery, adjusted operating expenses have been reduced by £695 million for the year to date. Adjusted cost:income ratio for the year to date was 66% compared with 67% in the prior year. Across PBB, CPB and CIB cost:income ratio of 60% year to date was stable compared with 2015.
  • Restructuring costs were £469 million in the quarter, a reduction of £378 million compared with Q3 2015. Williams & Glyn restructuring costs of £301 million include £127 million of termination costs associated with the decision to discontinue the programme to create a cloned banking platform.
  • Litigation and conduct costs of £425 million include an additional charge in respect of the recent settlement with the National Credit Union Administration Board to resolve two outstanding lawsuits in the United States relating to residential mortgage backed securities.
  • RBS has reviewed the recoverability of its deferred tax asset and, in light of the weaker economic outlook and recently enacted restrictions on carrying forward losses, an impairment of £300 million has been recognised in Q3 2016. This action has reduced TNAV per share by 3p.
  • TNAV per share reduced by 7p in the quarter to 338p principally reflecting the attributable loss, 4p, and a loss on redemption of preference shares, 4p, partially offset by gains recognised in foreign exchange reserves.

Real Home Value Growth Varies Significantly

Talking about average home price growth is rarely helpful, it is important to get granular. So CoreLogic’s post on real home price growth by major centres is very helpful because it corrects growth for inflation.  Their analysis shows that real home values are now more than 20% lower than their peak in Perth and Darwin, but well up in Sydney. Over the longer term, Sydney and Melbourne are the only two capital cities in which real home values are now back above their previous peaks.  We have a multi-speed market.

The Australian Bureau of Statistics (ABS) released consumer price index (CPI) data for the September 2016 quarter earlier this week.  According to the data, headline inflation increased by 0.7% over the quarter to be 1.3% higher over the year.  Meanwhile, underlying inflation was recorded at 0.3% over the quarter and 1.5% higher over the past 12 months.  Both headline and underlying inflation have increased at a rate below the RBAs target range of 2% to 3%.  This would usually see the RBA cut interest rates to try and lift inflation however, the previous cuts in May and August, which had the same intent, have not successfully lifted inflation.  What those cuts did manage to do was re-energise growth in housing, particularly in Sydney and Melbourne.  For this reason there is some speculation as to whether the RBA will risk cutting interest rates again given concerns that a lower cash rate will fail to push the dollar lower and lift inflation but add further heat to an already strong housing market.

With the CPI data released, we can pair it with the CoreLogic home value index data to September 2016, in order to obtain an understanding of real growth in values.  Although headline value growth is lower than it was a year ago, so too is headline inflation which mean that real value growth, particularly in Sydney and Melbourne remains strong.

chart-1

The above chart highlights the real and nominal changes in home values across each capital city over the 12 months to September 2016.  In both real and nominal terms values have fallen over the past year in both Perth and Darwin while they have increased across each of the remaining capital cities.  There’s also been evidence that along with Sydney and Melbourne, where growth has been strong for almost four years now, value growth has also picked up in other cities such as Adelaide, Hobart and Canberra.

chart-2

If you look at the compound annual change in real home values over the past five, ten and 15 years, the 15 year time-frame in most capital city provides the strongest performance.  The clear exception is in Sydney where the last five years have resulted in the strongest annual returns.  In contrast, across all other capital cities except for Perth and Hobart the past five years have recorded the weakest annual growth across each of the three time-frame.  This result really highlights the strength of the Sydney market over the past five years and its relative weakness over the 10 years preceding.

chart-3

Since the end of 2008 (ie post GFC), growth in home values has significantly skewed towards the Sydney and Melbourne housing markets.  As highlighted in the above chart, when adjusted for inflation values are lower that they were at the end of 2008 in Brisbane, Adelaide, Perth, Hobart and Darwin.  Sydney and Melbourne have also seen a substantially greater increase in values relative to Canberra which was the only other capital city to have seen an increase in real home values.

chart-4

Sydney and Melbourne are the only two capital cities in which real home values are now back above their previous peaks.  After peaking all the way back in the March 2004 quarter, real home values in Sydney are now 35.3% higher in Sydney and in Melbourne they are 17.2% higher than their September 2010 peak.  All other capital cities are still recording real home values below their previous peaks.  The magnitude of these declines are recorded at: -10.2% in Brisbane, -5.3% in Adelaide, -20.2% in Perth, -15.6% in Hobart, -23.8% in Darwin and -1.0% in Canberra.  In some of these cities, values peaked many years ago, as far back as 2007 in Perth and Hobart and 2008 in Brisbane.

Although interest rates are low and in real terms homes have been becoming more affordable outside of Sydney and Melbourne it still hasn’t proved to be enough to lure substantial demand and subsequent growth across the other capital cities.  What this highlights is the importance of employment, what sets Sydney and Melbourne apart, outside of more expensive housing prices, is the fact that they both have strong economies which are creating jobs.  Housing affordability alone is no longer enough to attract an increasing level of housing demand, you need a strong economy and the jobs that go along with those strong economic conditions.

Perth and Darwin in particular are well into a fairly substantial value decline phase which is appears set to continue.  Since their respective market peaks in September 2007 and September 2010, real home values are now -20.2% and -23.8% lower respectively.

Payments Evolving Fast In Australia

The Australian Payments Clearing Association (APCA) has released their annual review.  APCA has 103 members including Australia’s leading
financial institutions major retailers, payments system operators and other payments service providers.

They say “this has been a landmark year for Australia’s digital economy. With accelerated adoption of electronic payment methods, fewer cash and cheque transactions and increased support for Fintech organisations, we’re at the forefront of a global trend”.

apca

  • Australians used their cards 12.1% more often, and spent 6.7% more on them than in 2015.
  • With 75% of facetoface transactions estimated to be “tap and go”, Australia leads the world in contactless uptake.
  • Direct entry transactions grew by 7.2% in number and 2.6% in value.
  • On average, every Australian over the age of 15 has 3 payment cards.
  • Online spending by Australians grew by 13.5%
  • There is 1 point-of-sale terminal for every 20 Australians over the age of 15.
  • This year, there were over 3.3 billion direct entry (direct debit and direct credit) transactions, a 7.2% increase on the previous year. The total value of
    direct entry transactions grew 2.6% to $14.4 trillion.
  • Debit cards at point-of-sale in Australia continue to grow strongly, with a 13.3% increase in number, and 8.9% increase in value this year.
  • Credit card volumes increased by nearly 9.8% this year, the strongest increase in the last decade, and a likely reflection of consumer confidence. Similarly, credit card values grew by 5% this year to $310 billion, up from $295 billion in 2015.
  • Australians spent $689,470 million on their payment cards in 2015, whilst Fraud accounted for 0.07% of this total.

The decline in cheques and cash is accelerating as ATM withdrawals dropped by 6.6%, compared to 4.9% in 2015 and Cheques use dropped by 17.2%, compared to 15.7% in 2015.

On the other hand, Australia has one of the highest smartphone
penetration levels globally, and 59% of Australians with smartphones have used them to pay for goods or services. Tablets are an important part of the puzzle. 71% of Australians over the age of 18 have made a payment using a mobile phone or tablet.

Investment continues in Fintech, with 70 members forming its peak body, and $438m invested in the Fintech market in Australia.

The New Payments Platform (NPP) is a major industry initiative to develop new infrastructure for Australian payments. It will provide Australian governments, businesses and consumers with a fast, versatile, data-rich payments system for making their everyday payments. The industry is taking a unique layered approach that separates the basic infrastructure, which connects all financial institutions, from “overlay” services – innovative, customised payment services. APCA is providing corporate services to NPP Australia Limited, the company it established in December 2014 to oversee the build and operation of the NPP.

In October 2015, NPP Australia reached agreement with Australia’s premier bill payment system provider – BPAY – to deliver the first overlay service to use the NPP once it is operational in the second half of 2017. This initial convenience service will let consumers immediately transfer funds to and from their banking accounts via their mobile phone, tablet, or via the internet.


Macquarie 1H17 Result – $A1,050 million Net Profit

Macquarie Group today announced a net profit after tax attributable to ordinary shareholders of $A1,050 million for the half-year ended 30 September 2016 (1H17), down two per cent on the half-year ended 30 September 2015 (1H16) and up six per cent on the half-year ended 31 March 2016 (2H16).

Net operating income of $A5,218 million for 1H17 was down two per cent on 1H16, while total operating expenses of $A3,733 million were up one per cent on 1H16. Around 60% came from international sources.

mbl-1h17-incomeMacquarie’s annuity-style businesses (Macquarie Asset Management, Corporate and Asset Finance and Banking and Financial Services), which represent approx. 70% of the Groups’ performance, continued to perform well with a full period contribution from AWAS/Esanda as well as a gain on the disposal of Macquarie Life compared to a pcp which benefited from significant performance fees in MAM (1H16) and gave a combined net profit contribution of $A1,639 down 15% on 1H16 and up 36% on 2H16.

Macquarie’s capital markets facing businesses (Macquarie Securities Group, Macquarie Capital and Commodities and Financial Markets) benefited from lower impairments and increased principal realisations in MacCap and CFM, offset by lower trading activity gave a combined net profit contribution of $A695m broadly in line with 1H16 and up 15% on 2H16.

Operating expenses were $A3,733m, up 1% on 1H16 and up 9% on 2H16.

Macquarie announced an interim ordinary dividend of $A1.90 per share (45 per cent franked), up from the 1H16 dividend of $A1.60 per share and down from the 2H16 dividend of $A2.40 per share, both 40 per cent franked. This represents a payout ratio of 62 per cent.

Key drivers of the change from the prior corresponding period (1H16) were:

  • An 18 per cent decrease in combined net interest and trading income to $A1,864 million, down from $A2,273 million in 1H16. The reduction was across a number of operating groups. MSG was impacted by limited trading opportunities due to market uncertainty. In CAF, there was an overall decline in net interest and trading income mainly driven by the timing of prepayments and realisations, and lower loan volumes in the Lending portfolio, as well as increased funding costs due to the AWAS portfolio acquisition, partially offset by the contribution from the Esanda dealer finance portfolio. CFM also reported lower net interest and trading income compared to 1H16 due to reduced client flow, particularly in oil. Partially offsetting these declines was increased net interest and trading income in BFS, mainly driven by volume growth in the Australian loan and deposit portfolios
  • A 21 per cent decrease in fee and commission income to $A2,202 million, down from $A2,794 million in 1H16. Performance fees were $A170 million in 1H17, down 73 per cent on 1H16 which benefited from significant performance fees of $A629 million, while mergers and acquisitions, advisory and underwriting fees of $A471 million in 1H17 decreased 12 per cent from $A537 million in 1H16 due to more subdued equity capital markets activity in most key regions. Brokerage and commissions income of $A419 million was also down on 1H16 as market uncertainty impacted the levels of client trading activity, particularly in Asia.
  • A 20 per cent increase in net operating lease income to $A476 million, up from $A397 million in 1H16, mainly driven by the AWAS portfolio acquisition in CAF.
  • Other operating income of $A684 million in 1H17 increased significantly from a charge of $A83 million in 1H16. The primary drivers were increased gains on the sale of investments and businesses; and lower provisions for impairment mainly due to reduced exposures to underperforming commodity-related loans in CFM. Gains on the sale of businesses and investments included a significant gain from BFS’ sale of Macquarie Life’s risk insurance business, as well as increased contributions from Macquarie Capital, CFM and MAM, partially offset by a loss on the sale of BFS’ US mortgages portfolio.
  • Total operating expenses increased one per cent, driven by increased non-salary technology expenses mainly due to elevated project activity as well as a change in approach to the capitalisation of software expenses in relation to the Core Banking platform in BFS, offset by decreased brokerage, commission and trading-related expenses mainly due to decreased trading-related activity, while employment expenses remained broadly in line with 1H16.

Staff numbers were 13,816 at 30 September 2016, down from 14,372 at 31 March 2016.

The income tax expense for 1H17 was $A438 million, down 17 per cent from $A530 million in 1H16 mainly due to a decrease in operating profit before income tax, as well as changes in the geographic composition of earnings, with increased income being generated in Australia and the UK, and lower income in the US. The effective tax rate of 29.4 per cent was down from 33.1 per cent in 1H16.

Total customer deposits increased by 5.7 per cent to $A46.1 billion at 30 September 2016 from $A43.6 billion at 31 March 2016. During 1H17, $A4.0 billion of new term funding was raised covering a range of sources, tenors, currencies and product types.

Macquarie Group’s financial position comfortably exceeds APRA’s Basel III regulatory requirements, with Group capital surplus of $A3.7 billion at 30 September 2016, which was down from $A3.9 billion at 31 March 2016.

The Bank Group APRA Basel III Common Equity Tier 1 capital ratio was 10.4 per cent (Harmonised: 12.6 per cent) at 30 September 2016, down from 10.7 per cent at 31 March 2016. The Bank Group’s APRA leverage ratio was 5.6 per cent (Harmonised: 6.5 per cent) and average LCR was 169 per cent.

mbl-1h17-ratios

Operating group performance

Macquarie Asset Management delivered a net profit contribution of $A857 million for 1H17, down 25 per cent from $A1,139 million in 1H16, and up 70 per cent from $A505 million in 2H16, mostly due to performance fees and investment-related income. Performance fee income in 1H17 decreased 72 per cent from a particularly strong 1H16 of $A609m, and increased 102 per cent from $A84 million in 2H16, and included performance fees from Macquarie Atlas Roads (MQA), Macquarie Korea Infrastructure Fund (MKIF), Australian managed accounts and from co-investors in respect of infrastructure assets. Investment-related income included gains from the partial sale of MIRA’s holding in MQA, gains on sale of unlisted real estate holdings in MIRA and income from the sell down of infrastructure debt in Macquarie Specialised Investment Solutions (MSIS). Base fee income was broadly in line as investments made by MIRA-managed funds, growth in the MSIS Infrastructure Debt business and positive market movements in MIM, were largely offset by small net AUM outflows in the MIM business, asset realisations by MIRA-managed funds and foreign exchange impacts. Assets under management of $A491.3 billion decreased two per cent on 30 September 2015.

Corporate and Asset Finance delivered a net profit contribution of $A521 million for 1H17, down 15 per cent from $A611 million in 1H16. The decrease was mainly driven by lower income due to the timing of prepayments and realisations as well as lower loan volumes, which resulted in a reduced contribution from the Lending portfolio. This was partially offset by profit from the AWAS portfolio acquisition and the acquisition of the Esanda dealer finance portfolio in the prior year. The AWAS and Esanda acquisitions have been successfully integrated and continue to perform in line with expectations. CAF’s asset and loan portfolio of $A38.1 billion increased 17 per cent on 30 September 2015.

Banking and Financial Services delivered a net profit contribution of $A261 million for 1H17, up 54 per cent from $A170 million in 1H16. The improved result reflects increased income from growth in Australian lending, deposit and platform volumes, as well as a gain on sale of Macquarie Life’s risk insurance business.

This was partially offset by a loss on the disposal of the US mortgages portfolio, increased costs mainly due to elevated project activity as well as a change in approach to the capitalisation of software expenses in relation to the Core Banking platform, and increased impairment charges on loans, equity investments and intangible assets ($A78m). BFS deposits of $A42.2 billion increased nine per cent on 30 September 2015 and funds on platform of $A62.1 billion increased 33 per cent on 30 September 2015. The Australian mortgage portfolio of $A28.6 billion increased four per cent on 30 September 2015, representing approximately two per cent of the Australian mortgage market. Business lending grew by 8%.

Macquarie Securities delivered a net profit contribution of $A18 million for 1H17, down from $A240 million in 1H16. 1H16 benefited from strong trading revenues, particularly in Asia, while trading opportunities in 1H17 were limited due to market uncertainty. Macquarie was ranked No.1 in Australia for IPOs and No.2 for equity, equity-linked and rights deals in calendar year 2016.

Macquarie Capital delivered a net profit contribution of $A205 million for 1H17, up 21 per cent from $A170 million in 1H16. The increase was predominately due to increased income from principal realisations, lower M&A, advisory and underwriting fees and increased operating expenses. During 1H17, Macquarie Capital advised on 201 transactions valued at $A65 billion including being adviser to Brookfield Infrastructure, together with its institutional partners, on the acquisition of Asciano Limited; adviser on behalf of Seoul Tunnel Co., Ltd. in connection with Seoul Jemulpo Tunnel Project; adviser to Siris Capital on its acquisition of Polycom and sole bookrunner and sole lead arranger on the debt financing to support the acquisition; and capital raising and acquisition in conjunction with CFM of a 50 per cent principal investment in the 299MW Tees Renewable Energy Plant.

Commodities and Financial Markets delivered a net profit contribution of $A472 million for 1H17, up 67 per cent from $A282 million in 1H16. The result reflects an increase in income generated from the sale of equity investments and a reduction in provisions for impairment compared to prior periods. This was partially offset by reduced commodities-related net interest and trading income compared to 1H16, which benefited from higher levels of volatility across a number of commodities, particularly oil. CFM continued to experience strong results across the energy platform, particularly from Global Oil and North American Gas, and increased customer activity in foreign exchange, interest rates and futures markets due to ongoing market volatility. Macquarie Energy maintained its Platts ranking of No.3 US physical gas marketer in North America.

Outlook

Macquarie currently expects the year ending 31 March 2017 (FY17) combined net profit contribution from operating groups to be broadly in line with the year ended 31 March 2016 (FY16).

The FY17 tax rate is currently expected to be broadly in line with FY16.

Accordingly, the Group’s result for FY17 is currently expected to be broadly in line with FY16.

The Group’s short-term outlook remains subject to a range of challenges including:

  • market conditions
  • the impact of foreign exchange; and
  • potential regulatory changes and tax uncertainties

Mr Moore said: “Macquarie remains well positioned to deliver superior performance in the medium-term due to its deep expertise in major markets, strength in diversity and ability to adapt its portfolio mix to changing market conditions, the ongoing benefits of continued cost initiatives, a strong and conservative balance sheet and a proven risk management framework and culture.”

Have We Passed Peak Build?

The monthly HIA survey of Australia’s largest volume builders reveals that total seasonally-adjusted new home sales increased in September 2016, the second consecutive month of growth.

hia-sept-2016Within the month, growth was driven by detached house sales which rose by 3.8 per cent, while sales of units eased back by 0.8 per cent over the same period. However, Victoria was the only state to record an increase in new home sales over this period with 14.0 per cent growth in sales over the past year.

In fact, detached house sales fell in four out of the five states covered by the report, an exact reversal of the situation in August. During September 2016, the largest fall in sales was recorded in South Australia (-23.0 per cent), followed by Western Australia (-17.2 per cent), New South Wales (-12.9 per cent) and Queensland (-2.6 per cent).

“During September, HIA’s New Home Sales grew by 3.8 per cent, a further increase on the 2.9 per cent rate of growth over the previous month,” remarked HIA Senior Economist, Shane Garrett.

“However, the mix of available indictors suggests that new home building activity has now passed its peak and that the 2015/16 financial year will not be matched in terms new dwelling starts. This is particularly the case for multi-residential sales, which have eased by 6.2 per cent during the September 2016 quarter compared with the same period a year earlier”.


AMP Significant Reinsurance Deal Announced, Takes Hit

AMP Limited today provided an update on its Australian wealthprotection business and reported cashflows and assets under management (AUM) for the thirdquarter to 30 September 2016.

amp-pic

In addition, AMP announced two significant actions as part of its update to address the marketconditions for wealth protection in Australia:

  • the implementation of a significant reinsurance arrangement with Munich ReinsuranceCompany of Australasia Limited (Munich Re), and
  • strengthening of best estimate assumptions across both AMP Life and NMLA effective31 December 2016.

AMP Chief Executive Craig Meller said: “We’ve seen consistent deterioration in the insurance sector over the course of 2016 and, despite the progress on claims transformation to date, it has significantly impacted the performance of our wealth protection business.

“Today’s actions are designed to re-set the wealth protection business. They will improve the group’s earnings stability, free-up capital and help bring into focus the growth potential of AMP.

“While cashflows remained subdued during the third quarter, they were impacted by the ongoing uncertainty in superannuation legislation leading to lower consumer confidence in the system,advisers adjusting to the enhanced regulatory environment and recent investment market volatility

“However AMP is optimistic that the recent superannuation reforms will reverse this trend.”

Business update for the Australian wealth protection business

The series of actions AMP announced today will, subject to regulatory approval, release capitalfrom the wealth protection business and provide greater earnings stability across the group.In more detail they are:

Significant reinsurance deal

AMP’s focus is to reposition the wealth protection business in Australia as significantly less capitalintensive with market-leading products and a transformed claims philosophy and process.

AMP Life has executed a binding quota share agreement with Munich Re to reinsure 50 per cent of $750 million of annual premium income of the AMP Life retail portfolio (including income protection and lump sum business). The agreement will commence on 1 November 2016.

The agreement creates the potential to release up to $500 million of capital from AMP Life subject to regulatory approval. This initial tranche of reinsurance will reduce the magnitude of earnings volatility from the Australian wealth protection business for the AMP group.

The estimated net impact from the agreement on the Australian wealth protection business profit margins is a $25 million reduction annually from FY 17.

AMP intends to pursue further tranches of reinsurance when time and conditions suit.

Strengthening of best estimate assumptions and goodwill impairment

The challenges AMP has faced in its Australian wealth protection business over the last three years have been accentuated in 2016 by deteriorating experience across the life insurance sector.

This has been driven by a range of factors in a period of unprecedented external scrutiny.

This trend has continued into Q3 2016 resulting in an experience loss of $44 million.

Having reviewed experience against long-term trends, AMP has come to the view that the current trends are structural in nature. In response, AMP expects to strengthen best estimate assumptions across both AMP Life and NMLA (including retail and group income protection, claims and lapses)from year end.

As a result, the following underlying profit impacts are anticipated:

  • capitalised losses and other one off experience items in the order of $500 million in FY 16,and
  • reduction in Australian wealth protection profit margins for FY 17 in the order of $65 million.

The anticipated assumption changes will reduce the Australian wealth protection embedded value at FY 16 by approximately $1.0 billion at a 5 per cent discount margin. The reinsurance agreement results in a negligible change in embedded value (prior to any capital release from AMP Life).

Goodwill attributable to the Australian wealth protection business is expected to be fully impairedby $668 million when preparing the 2016 year-end financial statements. This reflects a decline inthe potential recoverable amount for the Australian wealth protection business in line withreductions in embedded value.

The impairment charges will not impact AMP’s FY 16 underlying profit.

Note that all items above are approximate, unaudited and subject to change as full year reporting processes are completed. The Part 9 consolidation of NMLA with AMP Life is on track and will notbe impacted by the assumption changes or goodwill impairment.

Wealth protection experience for Q3 2016

Experience losses for Q3 16 were $44 million compared with experience losses of $42 million in1H 16, reflecting:

  • retail income protection experience losses of $18 million
  • retail lump sum experience losses of $8 million
  • group insurance claims experience losses of $12 million, and
  • lapse experience losses of $6 million.

Q3 16 experience reflected ongoing challenges in the market environment, seasonality of lapsesand lower than expected Group Salary Continuance and income protection terminations.

2H 16 wealth protection experience guidance/

AMP’s Australian wealth protection business continues to operate in a difficult market environment.As a result, if year to date trends continue into Q4 16, in addition to the impacts of potential bestestimate assumption changes, experience losses for the Australian wealth protection business in2H 16 are likely to be in the order of $75 million. However, experience by its nature will be volatile from period to period.

FY 17 wealth protection guidance

FY 17 profit margins for the Australian wealth protection business are expected to be impacted bya combination of strengthened assumptions ($65 million) and execution of the reinsuranceagreement ($25 million). As a result, profit margins in FY 17 are expected to reduce byapproximately $90 million.

Q3 16 Cashflows and AUM update

Australian wealth management net cash outflows were $327 million for the quarter, down from net cashflows of $241 million in Q3 15, driven by the uncertainty in superannuation legislation,advisers adjusting to an enhanced regulatory environment and recent investment market volatility driving weaker inflows in retail products. AMP is optimistic that recent government announcements will reverse the trend in superannuation contributions.

Internal inflows were $4.4 billion in Q3 16 ($4.3 billion in Q3 15) representing 61 per cent(57 per cent in Q3 15) of total cash inflows.

Total AUM was $118.1 billion, up 3 per cent from $115.0 billion at the end of Q2 16 (up 6 per centfrom $111.1 billion at Q3 15). The increase since June 30 reflected positive investment market movements during the quarter. Average AUM increased by 3 per cent to $117.8 billion from Q3 15

AMP’s leading wrap platform North reported net cashflows of $1.1 billion in Q3 16, up 2 per centfrom Q3 15. 49 per cent of North’s net cashflows were externally sourced. North AUM grew to$25.2 billion at the end of the quarter, up 8 per cent from $23.4 billion at the end of Q2 16 and increased by 32 per cent from $19.1 billion at Q3 15.

AMP Flexible Super reported net cash outflows of $83 million in Q3 16, down from net cashflows of$274 million in Q3 15, driven by increasing preference for North by new and existing pension customers and the weaker industry environment. Flexible Super AUM increased by 2 per cent inQ3 16 to $15.7 billion and increased 8 per cent from $14.4 billion at Q3 15.

Corporate superannuation reported net cash outflows of $69 million in Q3 16 down $96 million from Q3 15. The prior period benefited from member transitions from a large mandate win which did not repeat in Q3 16.

External platform net cash outflows were $454 million in Q3 16 compared to net cash outflows of$493 million in Q3 15. This improvement in net outflows was largely the result of lower net cashout flows from advisers who left Genesys offset by lower platform inflows as advisers continue touse North as the preferred platform.

SuperConcepts now supports 54,910 administration and software funds representing 9.5 per centof the market. Growth of 40 per cent in the quarter was driven by the acquisition of additional SMSF software clients as part of the strategic partnership with accounting software provider Reckon, announced in August. Administration funds in the quarter fell 336 to 16,440.Total reported assets under administration grew by $3.9 billion in the quarter to $22.2 billion primarily from a strategic collaboration with a big four accountancy firm.

AMP Capital net cash outflows for Q3 16 were $208 million, comprising external cash inflows of$498 million for the quarter and internal net cash outflows of $706 million.

External flows benefited from strong flows into the China Life AMP Asset Management Company(CLAMP) offset by redemptions from the China Growth Fund and the loss of a $500 million lowmargin passive equities mandate. Overall, external net cashflow performance continues to reflecta shift from lower to higher margin asset classes.

AMP’s share of the CLAMP alliance delivered strong flows of $786 million in the third quarter.This partially reflects timing impacts around money market fund flows, as well as new fundlaunches during the quarter.

AMP Capital AUM at the end of Q3 16 was $162.5 billion, up 1 per cent from $160.4 billion at theend of Q2 16 (and $157.5 billion at Q3 15). Average AUM increased 2 per cent over the quarter to$163.2 billion.

AMP Bank’s loan book increased 3 per cent to $16.6 billion at the end of Q3 16 from $16.0 billion at Q2 16. The deposit book increased $1,116 million (10 per cent) in Q3 16 relative to Q2 16.

AMP New Zealand financial services’ net cashflows of $122 million were $63 million lower than in Q3 15 reflecting lower KiwiSaver flows and a reduction in one off transfers of clients onto NZ financial services platforms. New superannuation cashflow mandates are expected in Q4 16following other providers opting not to enter the updated regulatory regime required by the Financial Markets Conduct Act.

Australian mature

Australian wealth protection annual premium in-force (API) increased 3 per cent in Q3 16 to$1,984 million compared to $1,927 million in Q2 16. The increase in API was primarily driven by a4.6 per cent increase in individual lump sum.

Dividend and capital update

The AMP Limited board will decide on the final 2016 dividend in February 2017, based on the conditions at that time.

Due to the one off and largely non-cash nature of the changes announced today, the Board intends to exclude these impacts on current profits when determining the final 2016 dividend. It will also consider AMP’s enhanced capital strength and future earnings sustainability.

AMP’s policy remains to pay dividends on a payout ratio of 70-90 per cent of underlying profits.

The impact of anticipated best estimate assumption changes will absorb approximately$270 million of regulatory capital. This will be covered from within existing capital surplus and thecapital release expected from the Part 9 life company consolidation which will be in the order of$100 million.

AMP maintains a strong balance sheet and is well capitalised. The proceeds from the reinsurance agreement are anticipated to increase the existing surplus to AMP’s minimum regulatory requirements, which at 30 June 2016 was $1.9 billion. Consequently AMP will consider a range of capital management alternatives including a return of surplus capital to shareholders.


ANZ advises of additional FY16 Specified Charges

ANZ will announce its 2016 Full Year financial results on 3 November 2016. In advance of that announcement, the Group advises it will be recording additional specified charges in relation to the following items.
Derivative Credit Valuation Adjustment (CVA) – Institutional Markets Business.

anz-picANZ has enhanced the methodology for the calculation of CVA, a valuation adjustment made to determine the fair value of derivative instruments. The refined methodology makes greater use of market credit information and more sophisticated exposure modelling and is aligned with leading market practice. A $168 million1 charge (net of tax) will be recorded as a reduction to Institutional Markets revenue and will appear in the Specified Items table for comparative purposes. Of this, $25m relates to movements in CVA in the 2016 financial year with the remainder related to a once off adjustment for prior periods to mark to market the current derivative portfolio.

Restructuring Charge

ANZ will be recording a further $100 million (net of tax) in restructuring charges to support the evolution of the Group’s strategy, underpinning further productivity through reshaping the workforce, reducing complexity and duplication. The Group will outline the use of this charge in more detail in the FY16 results materials, and it will appear in the Specified Items table as per the restructuring charge taken in the First Half.

Total Second Half Specified Items Charges

Total Specified Items in the Second Half will be $360m (net of tax). In addition to the items outlined above this includes the second half impact of changes in the application of the Group’s software capitalisation policy and pro forma adjustments for the Esanda Dealer Finance divestment announced in ANZ Interim Results.

Tables were provided in the Consolidated Financial Report and Dividend Announcement at the First Half Result to identify the impact of Specified Items on Cash Profit in order to allow comparison with prior periods. A template in the same format, updated to include the Second Half Specified Items is included with this News Release to assist the market with its preparations ahead of the FY16 results release.

anz-proforma

Mobile Moves to Majority Share of Google’s Worldwide Ad Revenues

From eMarketer.

Google, which is set to report Q3 earnings this week, now makes more ad dollars from mobile than from the desktop globally, according to eMarketer’s latest estimates of ad revenues at major publishers. But in its home market of the US, that revenue flip is still in the (very near) future.

Google Net US Ad Revenues, by Device, 2015-2018 (billions and % of total)The shift in share of Google’s US ad revenues from desktop to mobile was sharp between 2015 and 2016. Last year, eMarketer estimates, just shy of 60% of the search giant’s net US ad revenues came from desktop placements. This year, it will be almost exactly 50/50, with desktop revenues eking out a 0.6-percentage-point edge. But by 2018, more than 60% of Google’s net US ad revenues will be thanks to mobile spending.

Google is already passing this milestone this year on a worldwide basis: About 59.5% of the company’s net global ad revenues will come from mobile internet ads this year, up from about 45.8% in 2015. By 2018, nearly three-quarters of Google’s net ad revenues worldwide will come from mobile internet ad placements.

This year, Google will generate $63.11 billion in net digital ad revenues worldwide, an increase of 19.0% over last year. That represents 32.4% of the worldwide digital ad market, which this year is worth $229.25 billion.

Google continues to be by far the dominant player in worldwide search advertising. eMarketer estimates the company will capture $52.88 billion in search ad revenues in 2016, or 56.9% of the search ad market worldwide.

On the display side, Google is second to Facebook. It will generate $10.23 billion in display ad revenues worldwide this year, or 12.9% of total display spending.

YouTube Net US Ad Revenues, 2015-2018 (billions, % change and % of Google net ad revenues)YouTube net ad revenues will grow 30.5% this year to reach $5.58 billion worldwide. In the US, YouTube is the leading over-the-top (OTT) video service, with 180.1 million users this year. That represents 95.7% of OTT video service users in the US. Net ad revenues on the site will reach nearly $3 billion this year in the US, according for almost 10% of Google’s net ad revenues in the country. That share will rise slightly by the end of eMarketer’s forecast period.

“Google’s accelerating ad revenues have been driven by capitalizing on usage and marketing trends like mobile search, YouTube’s popularity and programmatic buying,” said eMarketer senior forecasting analyst Martín Utreras.

“We see data and advertising at the heart of Google’s new product offerings,” said Utreras. “The new devices are not only aimed at diversifying Google’s revenues but also at enriching Google’s advertising targeting capabilities as consumers engage and share information with Pixel, Google Assistant, Daydream View, Chromecast and other Google ecosystem devices. We see this as contributing to both device sales and advertising revenues in the future.”