Our Super System Ranked Just Third

Despite retaining its third-place ranking behind Denmark and Netherlands in the 2016 Melbourne Mercer Global Pension Index (MMGPI), Australia has sustained a slight drop in the rating of its pension system for the second consecutive year.

2016-global-scorecardWhilst not alarming, narrowly missing out on the Index’s A-grade ranking by receiving a score between 75 and 80 for a sixth consecutive year indicates that despite being superior in many ways, further reform is required to ensure that Australia’s retirement system is considered world class, as is the case for Denmark’s and Netherlands’, which both retained their A-grade rankings.

Measures that were suggested to improve Australia’s system include:

  • Introducing a requirement for an income stream to comprise part of the retirement benefit;pension age relative to ongoing increases in life expectancy;
  • Increasing the preservation age;
  • Continuing to increase labour participation rate at older ages.

Australia’s overall Index Value saw a decline from last year’s 79.6 to this year’s 77.9. Author of the report and Senior Partner at Mercer, Dr. David Knox, attributed this to a “reduction in the net replacement rate”, caused by the federal government’s decision last year to defer the increase of the Superannuation Guarantee from its current 9.5 per cent to the proposed 12.

Despite its deferral affecting this year’s Australian adequacy rating, former Commonwealth Bank CEO and most recent Chairman of the Financial System Inquiry (FSI) Dr. David Murray AO insisted in his interview with Franklin Templeton Managing Director Ms. Maria Wilton, that an increased superannuation guarantee was necessary for a sufficient adequacy, given the tightening of the taxation arrangements around superannuation by the Federal Government.

“The nominal contribution rate [of the current superannuation guarantee] is 9.5 per cent. In effect, this is closer to 8 on an after-tax basis, and in adequacy terms” he believed this was insufficient. “You would have to get at least 11 after tax… on a pre-tax basis, allowing for the contributions tax, that’s around 14-15%”, Dr. Murray explained.

dsc_0131More alarmingly perhaps, Dr. Knox hinted at the fact that Australia’s score could undergo a further decline in future years, due to the Index not yet having taken into consideration the tougher 2017 Age Pension assets test, which will see a reduction in pension payments.

“At the moment, there is no allowance for the new assets test that comes on January 1 next year. I’m expecting our net replacement rate… to fall again”, Dr. Knox stated.

Despite these issues, Dr. Knox confirmed that the positives associated with the Australian pension system far outweighed the negatives, noting that a significant factor in Asian countries such as India, Singapore and Korea being the biggest improvers in the 2016 index ratings, was these countries considering the Australian system an archetypal source of recommendations.

These sentiments were endorsed by Dr. Murray, who deduced that “in a low growth world, with unfunded systems from much of the developed world” a country taking Australia’s third rank was “more likely to come from Asia” than anywhere else.

This year, 27 countries were included in the MMGPI, all of which obtained an index value based on more than 40 indicators, each belonging to one of three sub-indices; adequacy, sustainability and integrity. Covering almost 60% of the global population, one of its primary aims is to highlight the shortcomings in each country’s retirement income system, and suggest possible areas of reform.

THE VERY SIGNIFICANT IMPACT OF AGEING POPULATIONS ON GLOBAL PENSIONS

As well as dealing with annual rankings, this year’s edition of the MMGPI closely inspected the impact of an ageing global population, and how well equipped each country in the Index is to deal with this issue.

It was found that each country has experienced improvements, albeit to varying extents, in life expectancy over the last four decades. As outlined by Dr. Knox, when these projected increases in life expectancies are combined with recent marked decreases in fertility rates, the result is that “many countries are facing a significant [old] age dependency ratio over the next 25 years”.

“[In] 1980, we had almost 6 workers per older person, a couple of years ago, we had 4.7 and by 2040, we will have 2.3”.

It was found that of the countries in the Index, the one best placed to tackle this issue of an ageing population was Indonesia, due to the combined effects of its relatively low projected old age dependency ratio in 2040, and its preferable scoring on a range of mitigating factors, which it was explained by Dr. Knox, were very likely to offset the inevitability of having more aged.

These mitigating factors include:

  • Labour force participation rate for 55-64
  • Labour force participation rate for 65+
  • Amount of increase in the labour force participation rate for 55-64
  • Projected increase in the retirement period over the following 2 decades;
  • Pension fund assets as a % of GDP.

Professor Rodney Maddock, Interim Executive Director of the Australian Centre for Financial Studies, who hosted the Index’s official launch, echoed Dr. Knox’s thoughts, noting that an adjustment to both the retirement and pension eligibility age was necessary to ensure the continuing sustainability of Australia’s superannuation system: “Australians are living longer, living larger portions of their life in retirement and spending more in retirement, so we need to be well-placed to ensure fulfilling, adequately-funded retirements.”

From a more global perspective, perhaps in a much more dire state, is a nation such as Japan, which according to Dr. Knox, will have “one retiree for every 1.44 people of working age by 2040”, demonstrating the “alarming” projected old age dependency ratios in some nations.

Deutsche Bank Surprises On The Upside

From AFP Via The West Australian.

Troubled German lender Deutsche Bank reported Thursday a surprise 256-million-euro ($279 million) profit in the third quarter, compared with a loss of more than six billion in the same period last year.

db-logo-oct

Deutsche outdid the expectations of analysts surveyed by Factset, who had predicted it would book a loss of 949 million euros between July and September.

The group said revenues increased to 7.5 billion euros, slightly up from 2015’s third quarter, driven by 10-percent growth in its trading division.

Revenues declined in all other business areas, which Deutsche said was largely down to the “impact of the ongoing low interest rate environment”.

“We continued to make good progress on restructuring the bank,” chief executive John Cryan said in a statement.

Financial markets and politicians have been closely watching the fortunes of Germany’s biggest lender as it goes through a painful restructuring and deals with the fallout of the financial crisis.

It was labelled “the most important net contributor to systemic risks in the global banking system” by the IMF in June.

CEO Cryan acknowledged the “unsettling” effect of a $14-billion fine demand from the US Department of Justice in September over Deutsche’s role in the mortgage-backed securities crisis, news of which sent the bank’s share price to historic lows of 9.90 euros.

“The bank is working hard on achieving a resolution of this issue as soon as possible,” Cryan said.

A source told AFP in late September the bank was in talks with the DoJ to reduce its fine to around 5.4 billion euros, although the final figure could change.

ASIC Says Up To $178m In Fees For No Service May Be Refunded To Major Bank Customers

ASIC has released Report 499 Financial advice: Fees for no service (REP 499). They say to date, approximately $23.7 million of fee refunds and compensation has been paid, or agreed to be paid, to over 27,000 customers of ANZ, NAB, CBA, Westpac and AMP. But further reviews are being conducted and based on estimates, compensation may increase by approximately $154 million, plus interest, to over 175,000 further customers, meaning that total compensation for related failures could be over $178 million, plus interest.

calc-pic

The report provides an update on ASIC’s work to address financial institutions’ and advisers’ systemic failures, over a number of years, to provide ongoing advice services to customers who paid fees to receive those services. The report summarises ASIC’s work to ensure customers are fairly compensated. The report is part of ASIC’s Wealth Management Project which is focusing on the conduct of the largest financial advice firms, including the advice arms of AMP, ANZ, CBA, NAB and Westpac groups (refer: 15-081MR).

The failures set out in the report relate to instances where customers were charged a fee to receive an ongoing advice services, but had not been provided with this service because:

  1. The customer did not have an adviser allocated to them, but was charged a fee for ongoing advice – usually by deduction from the customer’s investment products; or
  2. The adviser allocated to the customer failed to deliver on their obligation to provide the ongoing advice service and the licensee failed to ensure that the service was provided.

To date, approximately $23.7 million of fee refunds and compensation has been paid, or agreed to be paid, to over 27,000 customers of ANZ, NAB, CBA, Westpac and AMP under various Australian Financial Services (AFS) licensees that are owned by these businesses. Further reviews are being conducted by the licensees to determine the extent of their ongoing service fee failures. Refunds and compensation are expected to increase substantially as the licensees’ investigations and reviews continue. Based on estimates provided by the licensees to ASIC, compensation may increase by approximately $154 million, plus interest, to over 175,000 further customers, meaning that total compensation for related failures could be over $178 million, plus interest.

ASIC has commenced several enforcement investigations in relation to this conduct.

Most of the failures outlined in this report occurred before the commencement of the Future of Financial Advice (FOFA) reforms. The changes made by those reforms were a significant factor in the identification of the failures, and also substantially reduce the likelihood that the type of systemic failures described in this report will occur in the future. In particular, the requirement to now provide an annual Fee Disclosure Statement to the client, and the requirement for the client to ‘opt-in’ to the advice relationship every two years, will significantly reduce the risk of fees being charged without any advice service provided.

‘Changes introduced through the FOFA reforms have shone a light on the advice fees that customers are paying and the services they should be receiving in return,’ said ASIC Deputy Chair Peter Kell. ‘Our report identifies the institutions’ systemic failures in this area, which we are putting right by ensuring that customers are fairly compensated.’

ASIC’s MoneySmart website has updated information on how much financial advice costs and what to expect from a financial adviser. Customers should check they are receiving the services they are paying for. Customers who are paying ongoing advice fees for services they do not need can ask for those fees to be switched off. Customers who have paid fees for services they did not receive may be entitled to refunds and compensation, and should lodge a complaint through the bank or licensee’s internal dispute resolution system or the Financial Ombudsman Service.

The Increasing Concentration in Australia’s Economy

Australian Competition and Consumer Commission Chairman Rod Sims discussed increasing concentration in the Australian economy at today’s RBB Economics Conference in Sydney.

“The rise of large corporations in the Australian economy has been substantial. Indeed it seems we have outpaced the US,” Mr Sims said.

Analysis prepared by Port Jackson Partners Limited shows the revenue of Australia’s largest 100 listed companies increased from 27% of GDP in 1993 to 47% of GDP in 2015. This compares to the US figures of 33% to 46%.

ASX Top 100 Revenue Proportion of GDP

“In Australia many markets are concentrated or are likely to become concentrated as firms pursue efficiencies from scale. In some markets there may not be room for more than a few efficiently sized firms given the size of demand,” Mr Sims said.

“From a competition perspective, what we need to understand is whether smaller rivals or new entrants can readily contest the position of larger, more established firms.”

“We should, therefore, have an eye to how often the identity of large firms change,” Mr Sims said.

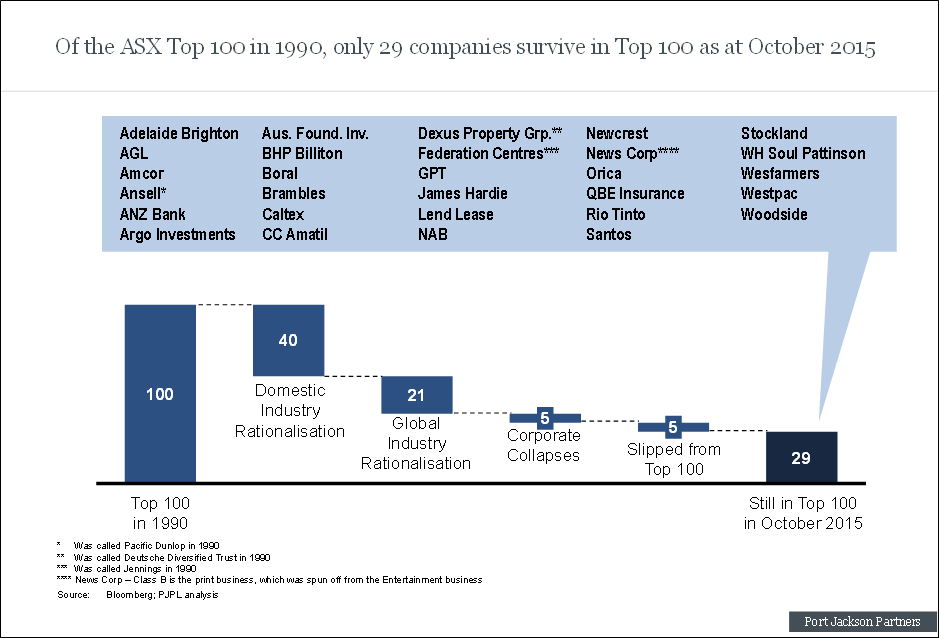
Again, drawing on work by Port Jackson Partners Ltd, of the ASX top 100 companies in 1990, only 29 companies remained in the top 100 as at October 2015.

Chart showing, of the ASX top 100 in 1990 only 29 companies survive in the top 100 as at October 2015

Mr Sims, however, questioned the increasingly put view that we need not be concerned with industries becoming heavily concentrated, and with monopolies and their behaviour.

“It seems to me that, absent a clear and convincing economic and evidence based explanation of how a merger will avoid harming consumers, the standard economic wisdom should prevail,” Mr Sims said.

“This wisdom is that mergers resulting in high levels of concentration in markets with substantial barriers to entry will usually reduce competition and cause harm to consumers and our economy.”

He also said circumstances where monopoly pricing has no effect, or only a small effect on economic efficiency, are rare.

While not advocating any positions, Mr Sims then raised a series of questions for further consideration about market concentration and merger analysis, including:

  • Why is it that economic argument and opinion increasingly down plays conventional economic theory and wisdom on high levels of consolidation and monopolies?
  • Do we need to consider something similar to the approach adopted by US courts where once markets are defined and the merger is likely to result in a significant increase in concentration, there exists a “rebuttable presumption” that the merger should not proceed absent evidence to the contrary?There will be times when a merger to high concentration is acceptable, due perhaps to low entry barriers, but logic says it will not be the norm. Why shouldn’t those arguing the unconventional have the burden of producing evidence to support their position?
  • Are regulators able to analyse and act where large incumbent firms continue to acquire promising start-ups?
  • Is there too much focus on overlap in specific narrow market sectors? Should we focus more on the wider actual and potential competitive constraints and the extent or strength of those constraints?
  • How many different forms of remedy should a competition regulator need to assess before saying “enough”?

“All of us here today understand the importance of strong actual or potential competition to the effective working of our market economy. This is why we all have an interest in these questions,” Mr Sims said.

Read the Chairman’s speech

NAB FY16 Lifts Cash Earnings … But

NAB has released their FY16 results. Given the transactions in the year (the effect of the operations and loss on sale for both CYBG and 80% of NAB Wealth’s life insurance business), we have to read these results carefully.

Cash earnings were $6.48 billion, an increase of $261 million or 4.2%, and above expectations. They were helped by lower tax on foreign businesses, as well as provisioning adjustments and trading related income.  CET1 ratio at 9.8% was higher than expected.

nab-fy-16However, the group net interest margin fell 2 basis point, thanks to higher funding and treasury costs.

nab-fy-16-nimThe cash ROE was 14.3%, down 50 basis points.

On a statutory basis, net profit attributable to the owners of the Company was $352 million, down 94.4% reflecting the loss on sale for both CYBG and 80% of NAB Wealth’s life insurance business. Excluding discontinued operations, statutory net profit decreased 5.6% to $6.42 billion.

On a cash earnings basis, Revenue increased 2.5%. Excluding gains in the March 2015 half year from a legal settlement and the UK Commercial Real Estate loan portfolio sale and SGA asset sales, revenue rose approximately 3.7%, benefitting from higher lending balances and stronger Markets and Treasury income. Group net interest margin (NIM) declined 2 basis points mainly due to higher funding costs.

Expenses rose 2.2%. Key drivers include higher personnel costs and increased technology related amortisation and project spend, partly offset by productivity savings. Expenses in the September 2016 half year were tightly managed, declining 1.9% compared to the March 2016 half year.

nab-fy-16-incomeThe charge for Bad and Doubtful Debts (B&DDs) rose 7.0% to $800 million. The increase primarily reflects higher specific charges relating to the impairment of a small number of large single name exposures in Australian Banking.

The ratio of Group 90+ days past due and gross impaired assets to gross loans and acceptances of 0.85% at 30 September 2016 was 7 basis points higher compared to 31 March 2016 mainly reflecting increased impairment of New Zealand dairy exposures of which the majority are currently classified as no loss based on collective provisions and security held.

The Group’s Common Equity Tier 1 (CET1) ratio was 9.8% as at 30 September 2016, an increase of 8 basis points from 31 March 2016 reflecting the sale of 80% of NAB Wealth’s life insurance business and strong capital generation, largely offset by the impact of higher mortgage risk weights from 1 July 2016. The Group’s CET1 target ratio remains between 8.75% – 9.25%, based on current regulatory requirements.

nab-fy-16-capitalThe final dividend is 99 cents per share fully franked, unchanged from the 2016 interim and 2015 final dividends.

The Group maintains a diversified funding profile and has raised $36.4 billion of term wholesale funding in the 2016 financial year. The weighted average term to maturity of the funds raised by the Group over the 2016 financial year was 5.4 years.

nab-fy-16-fundingThe stable funding index was 91% at 30 September 2016, 2 percentage points higher than at 31 March 2016.

The Group’s quarterly average liquidity coverage ratio as at 30 September 2016 was 121%.

Looking at the segmentals:

Australian Banking cash earnings were $5,472 million, an increase of 7% reflecting higher revenue and lower B&DD charges. Revenue rose 5% benefitting from stronger Markets and Treasury performance, combined with higher volumes of housing and business lending and a 3 basis point lift in NIM, year on year. Home lending in Australia grew above system in recent months, having been below the market earlier in the year.

nab-fy-16-oz-bank-yoy-nimHousing NIM declined in the second half, though this includes the impact of cost of funds methodology changes between Housing Lending and Deposits products, resulting in a 4bps NIM decline in the Sep 16 half year. However they also said, post the August cash rate cut, margins in the mortgage book have improved, around 15 basis points.

nab-fy-16-oz-bank-nimPersonal Banking NIM includes the impact of this cost of funds methodology changes between Housing Lending and Deposits products, resulting in a 2bps NIM decline in the Sep 16 half year.

nab-fy-16-oz-bank-nim-detailLooking in more detail at their mortgage book, 31.9% of home loans are interest only. The average portfolio LVR is 45.1% on a dynamic basis. 34.4% of loans are via brokers, and 42.3% of loans are for investment purposes.

nab-fy-16-lvrPast 90 day home loan delinquency shows a rise in WA, but only a small lift across the portfolio to 0.52%. Loss rate is 0.03%, up slightly from March 2016.

nab-fy-16-90-housing62.3% of home loan borrowers are paid ahead, and the average number of months ahead is 15.

NAB has 4,299 brokers under their owned aggregators.

nab-fy-16-brokersThey also source mortgages via their aligned advisor network.

nab-fy-16-advisorRevenue for Business Banking increased 2% and for Personal Banking increased 7%. Expenses rose 4% due mainly to personnel cost increases, but over the September 2016 half year decreased 1%. B&DD charges of $639 million fell 4% reflecting improved credit quality in the broader business lending portfolio partly offset by higher specific charges arising from a small number of large single name impairments.

NZ Banking local currency cash earnings of NZ$836 million rose 2% over the year. The key drivers were improved revenue and lower B&DD charges reflecting favourable economic conditions outside the dairy sector. Revenue rose 1% with improved lending volumes and fee income, partly offset by a decline in NIM due to competitive pressure and higher funding costs. Expense growth was contained to 1% despite continued investment in the Auckland focused growth strategy.

NAB Wealth cash earnings increased 13% to $356 million reflecting stronger revenue and lower expenses. Net income rose 2% benefitting from higher average funds under management (FUM), up 12% given strong investment markets, positive net funds flow and the inclusion of JBWere FUM from January 2016. Expenses declined 4% reflecting lower regulatory and compliance spend combined with tight control of discretionary costs.

Home Prices Rise Again (In Places)

From Domain.com.au

Despite efforts to cool the property market, Sydney house prices have run away yet again, growing at their strongest rate in over a year.

The harbour city’s median house price is now at a record $1,068,303, after a 2.7 per cent jump over the September quarter, Domain Group data released on Thursday found.

This has seen some property owners make hundreds of thousands of dollars by flipping properties purchased in the past few years.

Three-bedroom 4 Milton Street, Chatswood sold for $3.3 million in August - up $1.75 million in three years.Three-bedroom 4 Milton Street, Chatswood sold for $3.3 million in August – up $1.75 million in three years. Photo: Richardson & Wrench Chatswood

It has also pushed home ownership further out of reach of first-time buyers. And experts say this is likely to get even tougher with more price growth on the horizon, despite Treasurer Scott Morrison warning the state governments they need to tackle housing affordability.

Some of the growth in the September quarter was thanks to a surge in Investor activity, which increased 9.2 per cent in the year to August 2016, Domain Group chief economist Andrew Wilson said.

“The growth is raging back into Sydney … we have auction clearance rates in the mid-80 per cent range, and there were two interest cuts in August and May this year,” Dr Wilson said.

The strongest region over the past 12 months was the lower north shore – up 12 per cent in a year. Over the quarter, house prices in the area increased 6 per cent.

But apartment owners weren’t as lucky, with prices up just 1.1 per cent over the quarter to a median of $685,865.

Among house sellers making substantial profits in the lower north were the former owners of three-bedroom 4 Milton Street, Chatswood. It sold for $3.3 million in August – up $1.75 million in three years.

This was a street record and more than $500,000 above expectations, Richardson & Wrench Chatswood principal Warren Levitan said.

There were 14 interested buyers, but the home sold to an offshore purchaser with plans to knock it down and rebuild prior to moving in. In the meantime, it has been rented for $900 a week.

“A lot of the [price growth] is due to the local Asian market, where there are still buyers willing to pay top price … there’s also not a lot of stock,” Mr Levitan said.

They weren’t the only sellers making an enviable profit. Three years ago, 2 Cabramatta Road, Mosman sold for $1,873,000. In September, it sold again for $2.95 million. The sellers of 28 Devonshire Street, Crows Nest also saw their home jump $750,000 in three years.

This “revival” in the Sydney market will “likely be on the RBA’s minds next week,” HSBC chief economist Paul Bloxham said.

But while there’s likely to be more price increases over the next few months, it will be “single digit rather than double-digit growth” on an annualised basis, he said.

He pointed to an increase in supply and a tightening in the guidelines for lenders as what will see property prices grow at lower levels than those seen in 2014 and 2015.

New guidelines from the Australian Prudential Regulation Authority released on Monday require lenders to ensure borrowers are able to afford repayments on a 7 per cent interest rate when assessing whether they’re eligible for a loan.

This means someone buying a median priced house would need to be able to pay $6040 a month on a 25 year loan. Assuming they had a 20 per cent deposit.

This is about the same amount as the entire take-home pay packet on a $100,000 salary.

BIS Shrapnel residential researcher Angie Zigomanis agreed price growth was likely to continue, as “investor numbers are looking better and it looks as if the banks are loosening some of their criteria for lending”.

Strong migration into NSW and fewer homes available for sale would also put pressure on property prices, he said.

Century 21 chairman Charles Tarbey also had “bullish prospects” for the market in the lead-up to Christmas, but warned prices may start to moderate in 2017.

NAB Group chief economist Alan Oster was also not convinced there would be any huge increases in house prices in the near future, as there had been a slowdown in business conditions across NSW.

Already, the apartment market has shown signs of slowing in some areas. Canterbury Bankstown, the south, the west and the upper north shore all recorded modest price declines for units in the three months to September.

Over the year, the biggest drop in apartment prices was seen in Canterbury Bankstown, with a decline of 4.7 per cent to a median of $505,000.

The median apartments across Sydney increased 0.9 per cent in the 12 months to September.

ABC Lateline Does Housing Affordability

ABC Lateline included a segment on housing affordability, and an extended interview with Angus Taylor, Assistant Minister for Cities. His focus was on supply side issues, but he rejected the notion that investors, and their tax-breaks have messed with the market. He suggested the only way to examine the property sector was at an aggregate level, rather than looking at the behaviour of specific groups. We are not convinced!


New APRA guidance on lending will hurt home owners when it should be the banks

From The Conversation.

The Australian Prudential Regulation Authority (APRA) has moved away from its non-prescriptive “principles based” regulatory approach to a one size fits all explicit guidance but it doesn’t appear to be encouraging lenders to be more prudent.

The housing market may be getting away from APRA and the Reserve Bank of Australia (RBA). In late 2015, both regulators voiced concerns about the “horribly low” standards of the mortgage lending sector and the risks to financial stability. Even bankers are getting jittery.

risk-pic

There has also been well-publicised problems with brokers originating dodgy mortgages that lenders have not picked up. In its existing guidance (which has not been changed in the latest version), APRA requires lenders to have all sorts of procedures to catch dodgy mortgage applications from brokers including procedures to verify the accuracy and completeness of provided information.

But APRA has not named and shamed the lenders who failed to catch dodgy mortgage applications, not imposed capital sanctions or reprimanded directors and management. It hasn’t required that lenders change their broker process.

What APRA is asking is that banks slug first time buyers even more. In the new rules, home buyers are now required to prove they can service a 7% mortgage interest rate on a loan to value ratio of less than 90% with less income being taken into account. This is on top of trying to save a deposit that is disappearing every day as house prices boom.

It is going to take a lot more than forgoing a few smashed avocado toasts to make up for the additional burden imposed by APRA.

There are a few important questions raised by APRA’s sudden conversion to pragmatic rather than purely principled regulation.

First, the numbers. Where did the 7% come from? APRA doesn’t disclose this, but in an era of almost zero interest rates, it’s big. And maybe in time, when the RBA announces its changes to interest rates, the 7% may be changed in-line and economists will begin to bet on whether it will go to 6.5% or 7.5%.

In looking at a borrower’s income, APRA notes that it is “prudent practice is to apply discounts of at least 20% on most types of non-salary income”. No explanation also on why this particular percent. It’s also not specific on what “most” means.

If banks are indeed lending imprudently surely the banks themselves should suffer. First by naming and shaming, then if necessary, requiring additional capital buffers, thus driving down dividends – a real market based solution.

APRA is changing the way it regulates

Throughout the turmoil of the global financial crisis and the regulatory mayhem that followed, APRA held fast to its “principles based” approach to regulation:

To be principles-based is to give emphasis to the achievement of sound prudential outcomes in setting regulatory requirements and expectations, without necessarily seeking to specify or prescribe the exact manner in which those outcomes must be achieved

In short, APRA lays out the high-level principles that it will use to supervise the banks and insurance companies that is responsible for, and then will check that those principles are being adhered to. It did not believe in a “one size fits all” approach.

But this week, there appears to have been a back-flip. In a consultation paper for an update to APRA’s guidance on mortgage lending, the regulator has been very specific indeed. It notes:

“Prudent serviceability policies should incorporate a minimum floor assessment interest rate of at least seven per cent.”

This very specific guidance replaces an earlier guidance that was more general. From a regulatory perspective, an important question is why abandon principles-based regulation? If it hasn’t worked in the past, then a rethink of the role and approach of prudential regulation is needed.

This has happened overseas, where the UK Financial Conduct Authority, while retaining 11 principles that firms should adhere to, has become much more intrusive. Unlike our regulators, the authority has even going so far as to impose massive fines for misconduct. It states:

“We also adopt a markets-focused approach to regulation, both in our work as a competition regulator and more broadly to deliver regulation that works with the market to improve consumer outcomes. Interventions at the market level are an effective and powerful way of tackling and mitigating problems across a large number of firms, which in turn benefits a large number of consumers.”

Rather than APRA slipping in such a major change like this latest one into a consultation paper, it might be appropriate to have a transparent debate about such a potentially significant change in prudential regulation in Australia.

Author: Pat McConnell, Honorary Fellow, Macquarie University Applied Finance Centre, Macquarie University


Home loan stress to rise despite low rates

From News.com.au.

IF YOU’RE already starting to feel the mortgage pinch, this is bad news. New economic modelling shows mortgage defaults are set to rise over the next 12-18 months, and those who will be most affected will surprise you.

The research conducted by Digital Finance Analytics, based on its extensive household surveys, shows those falling behind in their mortgage repayments will continue to increase thanks to low wage growth and employment changes. This is despite record low interest rates.

pd-oct-2016-segment

This news follows a warning by Moody’s Investors Service that mortgage delinquencies have already hit a three-year high across the country.

“Incomes are just not growing and that is creating considerable difficulties for many households,” Principal of Digital Finance Analytics, Martin North told news.com.au.

“What I’m predicting is that incomes are going to remain static for the next 12-18 months … That means that households are in this difficult situation were they can just about afford their mortgages, but things like the general cost of living, which is going up faster than incomes, is going to create considerable pressure on many households.”

Western Australia and Queensland mining areas will bear the brunt, with New South Wales, Victoria and ACT being the best placed.

WHO IS MOST AT RISK?

First home buyers will unsurprisingly be in the firing line, as they are entering the housing market now when prices are so inflated and going in with the assumption that their income will grow.

However, interestingly, those hit the hardest will be affluent young buyers and wealthy seniors. Disadvantaged households on the edge of cities, and battling urban households are at lower risks of default.

“People with large mortgages, so young affluent buyers who bought in Bondi, for example, are finding it much more difficult to keep that property out of default because their income is not growing. Even in the more affluent areas in the states where there is a greater economic momentum, you still have the hot spots of difficulty,” Mr North told news.com.au.

“Interestingly, it is not necessarily the more stressed households — the ones you would expect out on the fringe. And the reason for that is those households never got the pay rises and they never got the big mortgages because they couldn’t afford to.”

Wealthy seniors who own property will also face more mortgage stress due to a combination of stagnating income and lower returns from deposits and the sharemarket.

Mr North said he is concerned this could spell disaster for the economy.

“The reason is we have never had household debt as high as it is. This is new territory,” he told news.com.au.

“We’ve got this very high level of debt and we’ve got very flat incomes so it could work out in a rather bad way.”

He said retail spending and financial stability are going to take a hit as Australians will not have the discretionary income to spend and the performance of our major banks is heavily reliant on mortgages.

Residential Deposits Reaches Record – Stockland

The property developer Stockland updated security holders on its progress over the past year and its plans for the year ahead and released its first quarter FY17 market update, announcing a strong start to the year, including a record number of deposits for its Residential business. They see constructive signs for an elongated property cycle.

half-buit-house-picStockland achieved 2,301 net deposits on residential lots, townhouses and completed homes in the quarter, up from 1,557 for the corresponding period in FY16. Chief executive Mark Steinert said projects in Sydney, Melbourne and south east Queensland made “significant contributions” to the growth in deposits, while Perth has shown signs of stabilisation.

As forecast in its FY17 outlook in August, around two thirds of Stockland’s Residential profit will fall into the second half.

Net deposits on residential lots, townhouses and completed homes jumped 47.7 per cent to 2,301 in the three months to September 30, from 1,557 in the same period a year ago. Andrew Whitson, CEO Residential, said: “We see continued high demand in the Sydney and Melbourne markets and an encouraging return of first home buyers in south east Queensland, who are taking advantage of the Queensland First Home Owners’ Grant, which was recently increased to $20,000.

“We remain on track to achieve more than 6,000 residential settlements for the full year and see constructive signs for an elongated property cycle.”

Stockland’s Retail business, the single biggest contributor to group earnings, saw a slight moderation in the rate of sales growth. Total sales for the quarter increased by 2.4 per cent, with comparable specialty sales up 1.1 per cent on the corresponding quarter last year. Importantly, sales data from approximately one-third of the portfolio is excluded, due to the redevelopment of some of its most productive centres, most notably Stockland Wetherill Park in western Sydney and Stockland Green Hills in the lower Hunter Valley. Comparable specialty sales per square metre grew 3.0 per cent for the quarter to $9114 per square metre.

Stockland reported that the strongest retail categories were communications technology; food catering and casual dining; and retail services.

John Schroder, CEO Commercial Property at Stockland, said: “The first quarter saw the short term impact of redevelopment activity and retail remixing within our centres, which will deliver future earnings growth. We expect retail sales growth to continue at moderate levels, and we remain confident of achieving 3 – 4 per cent comparable retail FFO growth in FY17, in line with our guidance.”

Stockland maintained good leasing momentum within its Logistics and Business Parks business, with leases executed on 62,400 square metres of floor space and Heads of Agreements signed on a further 92,500 square metres. Weighted Average Lease Expiry (WALE) remained steady at 4.5 years.

“We’ve maintained our disciplined approach to capital recycling and we are using our capabilities to upgrade and reposition our portfolio,” explained Mr Schroder. “We have made good progress on our $400 million development pipeline, which is strongly weighted towards the higher-performing Sydney and Melbourne markets.”

In Retirement Living, Stockland achieved 255 net reservations during 1Q17. The first quarter result was well supported by Stockland’s development pipeline with 96 net reservations of new homes, including from its development projects at Cardinal Freeman The Residences at Ashfield in Sydney’s inner west and Willowdale Retirement Village in south west Sydney. Stockland recorded 159 net reservations within its established portfolio, with the figure constrained by a comparatively lower turnover of homes in New South Wales and Queensland.

Stockland confirmed that it is on track to achieve target growth in Funds from Operations (FFO) per security of 5.0 – 7.0 per cent across the entire group, with a profit skew to 2H17, assuming no material change in market conditions.

Stockland continues to target an estimated distribution per security of 25.5 cents, assuming no material change in market conditions.