The Financial and Insurance Services Industry Profile Report, is an industry snapshot taken from SuperFriend’s annual ‘Indicators of Thriving Workplace’ survey of 5000 workers. It examines the current state of workplace mental health in the Australian financial services industry and compares it to the national average across all industries.
The study revealed that nearly half of all financial services employees (47%) are experiencing ongoing stress in their job, which is 9% higher than the national average. Further, 44% of those working in the industry say they have left a job due to a poor mental health environment.
SuperFriend Chief Executive Officer, Margo Lydon said: “Not only is financial services a highly competitive industry, but the staff across the industry are often engaging with members and customers during some really tough moments in their lives, such as redundancy, illness, death or major life changes like retirement. All of these moments require staff to be empathetic, supportive as well as know the technical components of their job. This can create pressures and stress if staff are not trained or well supported
“However, a number of organisations have made great improvements to their culture and workplace through a range of programs, by investing in mental health awareness and prevention initiatives including mental health training. It is clearly work in progress for the industry,” continued Ms Lydon.
Improving productivity and positivity in the workplace
Half of those surveyed believe that their employer is making enough time to take action, and a third (31%) describe their employer as the best, or one of the best, in creating a mentally healthy workplace.
According to the study, over 66% of employees in the industry believe that investment in workplace mental health and wellbeing would improve productivity, and 63% believe that it would reduce absenteeism (both of which are 5% above national average).
An additional 62% of respondents believe that investment in workplace mental health and wellbeing would improve staff retention (6% above national result).
“Employers stand to benefit from improving the mental health of their workplace, with bottom line benefits including greater productivity, talent retention and long-term cost savings.
“Particularly with financial services businesses, there is a need for greater focus on preventative measures such as, mental health policies, training for managers and staff, flexible work arrangements and recognition programs which can help to prevent issues from developing in the first place,” Ms Lydon added.
Workplaces that prioritise mental health see positive outcomes across their business
In industries across Australia, thriving and positive workers are more committed to their organisation’s goals, build better relationships with their peers and produce higher levels of output as dedicated employees, according to Ms Lydon.
“Those businesses already implementing best practice for their employees were found to actively encourage employees to identify ways to improve the workplace. More importantly, these business leaders are setting good examples and creating a culture that enables workers to be happy, healthy and productive. They are leaders who are really listening to the needs of their staff,” concluded Ms Lydon.
The Indicators of a Thriving Workplace report found the most successful workplaces have a positive culture. This can be achieved through ensuring managers are committed to promoting mental health and wellbeing of staff, supporting staff effectively through change, building a culture that encourages open discussion about the issues that affect mental health and wellbeing and making sure managers lead by example through setting a good example for a healthy, happy and productive workplace.
SuperFriend partners with all profit to member superannuation funds and life insurers to support improved mental wellbeing practices for their staff and members, through the organisations they work with every day. Its’ work focuses on creating mentally healthy workplaces where every worker, every day can contribute and thrive at work. Since 2009, SuperFriend has been providing skills-based training, using best practice evidence to build the confidence and capability of staff working in financial services industry in their interactions with members.
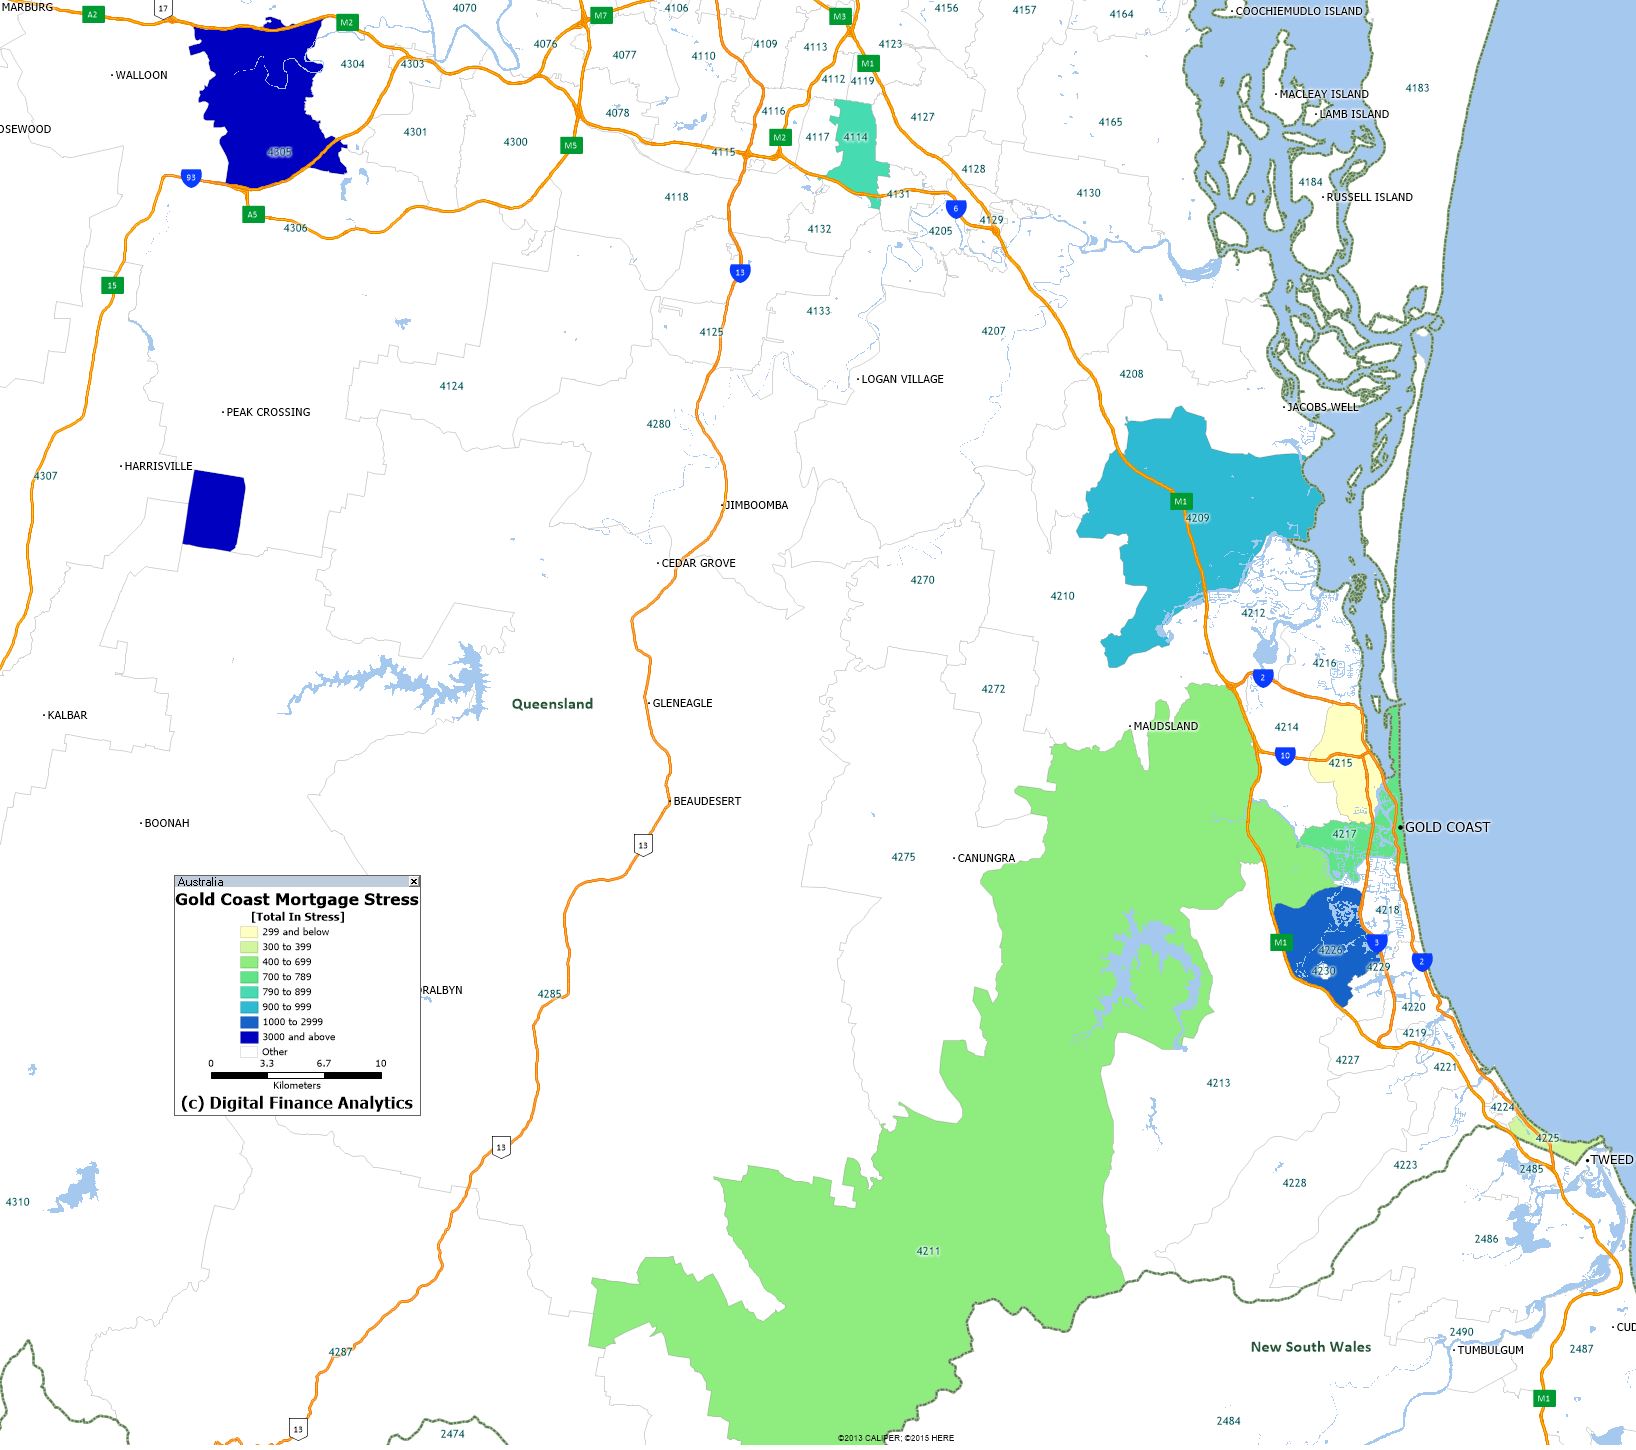
Channel Nine asked us to run some analysis in and around the Gold Coast, and also included some other post codes in the analysis. The story it tells is an interesting one and also gives us some clues about financial resilience, continuing our last discussion. In particular, we mapped in some of our master household segments, which show how uneven mortgage stress is in practice.
This is based on our household mortgage stress analysis for Queensland to the end of June, and in the past three months’ stress has been rising. When we talk about mortgage stress we are looking at household income and expenditure on a cash flow basis. Those with a shortfall are deemed to be in stress. Today around 27% of households across the state are having difficulty managing their repayment, which is slightly below the national average of 30%.
However, looking first in detail at the Gold Coast, we also see mortgage stress rising but only in some post codes.
The post code with the largest number of households in in 4226 Robina where 1,200 households are in mortgage stress, which is 28% of all borrowing households in the area. Most households here are relatively mature suburban families, with high expenses and contained incomes.
Coomera, 4209 has just 16% of households in mortgage stress and most of these are older, more wealthy households who are finding costs rising and their incomes severely under pressure.
Turning to Surfers Paradise 4217, 18% or 770 households there are in mortgage stress and these are mainly younger affluent households who have brought expensive places, often apartments now the costs of their mortgages have risen, while their incomes are constrained. This is a recipe for disaster later.
The post code with the largest number of borrowing households is 4211 Narang, with more than 10,000 in the district, only 4.1% are in mortgage stress and most of these are older households nearing retirement, when income is more constrained. However, we see a higher risk of default here should mortgage rates rise, because of these income constraints.
Turning to Coolangatta and the surrounding areas in 4225, here we see a larger number of households under pressure, due to lower incomes and high costs – we call then Battling Urban households. As a result, we estimate that more than 50%, or 332 households are in mortgage stress.
And in Southport 4215, where more than 4,800 households are borrowing, only 6% are in difficulty. Here many households are relatively affluent, and many are planning to, or have retired in recent years. However, as a result of this their incomes may become more constrained down the track so there are around 80 risking default over the next year or so.
So now looking across some of the other areas, in Brisbane, post code 4000, around 22% of borrowing households, or 320 households are in mortgage stress. Most of these are young affluent households, with large mortgages and often on high rise apartments. They paid up big for these, but now their incomes are constrained and costs are rising. This is a real problem.
Over in Logan, 4114, around 33% of households are in mortgage stress, that’s higher than the Queensland average, and that’s about 800 households in the area. Households here are in the mortgage belt, mostly with families, and high living costs as well as their mortgages. Once again incomes are constrained. We think more than 30 might default in the next 12 months.
Finally, in Ipswich, 4305, there are more than 8,000 borrowing households in what we classify as the disadvantaged fringe. Many here are battlers, with limited incomes, but still have mortgage repayments to meet. As a result, more than 40% are in mortgage stress which equates to more than 3,200 households, and around 95 may default over the next 12 months.
So you can see how mortgage stress varies across the region and across household segments. My point is, stress is not just confined to the battlers, it is alive and well in more affluent households too. This of course chimes with our national research as we reported last week – see the link here.
Given the fact that incomes are flat, the costs of living continue to rise – especially electricity, council rates, child care costs and school fees, we expect mortgage stress to continue to build. And the prospect of higher mortgage rates down the track makes it even more of a problem.
My advice for those in difficulty is first draw up a budget so you know what you are actually spending, and second remember that banks have an obligation to assist in times of hardship, so talk to them, do not ignore the problem, it is unlikely to go away on its own. Take action early.
On Q&A, Liberal MP Sarah Henderson made the case for company tax cuts, saying the Coalition government’s “focus on backing business” was paying dividends.
“We are seeing a renewed sense of confidence because of our focus on backing business – small, medium and large – giving them the incentive to grow, to invest and to employ more people.”
Henderson said the Coalition had “delivered more than a million jobs in the last year, and 65,000 or so new businesses have started up”.
The member for Corangamite added that “in Labor’s last year, 61,000 businesses closed”.
Are those numbers correct?
Checking the source
In response to The Conversation’s request for sources, Henderson pointed to Australian Bureau of Statistics Counts of Australian Businesses data that show:
an increase of 66,755 businesses in the 2016-17 financial year, and
a decrease of 61,614 businesses in the 2012-13 financial year (the last financial year of the Labor government).
Regarding the employment figures, Henderson told The Conversation she had made an error, and had meant to say that more than one million jobs had been created over nearly five years.
Verdict
Liberal MP Sarah Henderson’s statement that the Coalition government “delivered more than a million jobs in the last year” was incorrect.
As Henderson noted in her response to The Conversation, growth in employment of “more than a million jobs” took place over more than four years.
Depending on which interpretation of “last year” we use – whether financial, calendar or year-to-date – the growth in the number of people employed was between 251,500 and 383,000.
In terms of whether the Coalition “delivered” these jobs, it’s important to remember that government policy is only one of many factors that determine employment dynamics. Changes in employment levels are never solely due to the efforts of any one government.
Regarding the numbers of businesses opening and closing, Henderson was correct.
In 2016-17 (the last financial year for which data are available), the total number of businesses in Australia increased by 66,755.
In the last financial year of the Labor government (2012-13), the total number of businesses decreased by 61,614.
It appears that the annual balance between business entrants and exits is correlated with the economic cycle.
Did the Coalition deliver ‘more than a million jobs in the last year’?
No.
As Henderson noted in her response to The Conversation, this statement was incorrect.
The growth in the number of people employed in “the last year” was between 251,500 and 383,000, depending on which interpretation of “last year” we use – whether financial year, calendar year or year-to-date.
The labour force survey includes three different series of employment data: original, trend, and seasonally adjusted.
The “original” series simply counts how many people are employed at any given time.
The “seasonally adjusted” series adjusts the original series to account for regular fluctuations in employment due to the calendar or seasonal pattern of certain economic activities – for example, tourism.
The “trend” component tells the story of the underlying, longer-term dynamics of employment by smoothing out the peaks and troughs due to short-term fluctuations in economic activity.
Any of the three measures can be used, but trend or seasonally adjusted employment are typically more relevant when it comes to economic policy-making. So in this FactCheck, I’ll look at the trend data.
These show that for the 12 months from June 2017 to the end of May 2018, the number of people employed in Australia increased by 277,300.
If we look at the last financial year for which we have complete data, ending June 2017, trend employment increased by 251,500 people.
And if we look at the last completed calendar year – 2017 – then the increase in employment amounts to 383,000.
To count “more than a million jobs”, we need to look back around four or five years.
Trend employment data show an increase of one million people employed between June 2014 and May 2018, and looking a little further back, between September 2011 and June 2017.
In terms of whether the Coalition “delivered” these jobs, it’s important to remember that government policy is only one of many factors that determine employment dynamics in a given period of time. Changes in employment levels are never solely due to the efforts of any one government.
Other factors that influence employment levels include (and are certainly not limited to):
federal policies
economic conditions in trading partner countries
changes in the international price of commodities, and
variations in the level of the interest rate and/or the exchange rate.
It’s difficult to establish with certainty the relative contribution to employment growth of each of these factors.
How many businesses started and closed?
To test these claims, we can look to the Australian Bureau of Statistics Business Register. The register provides a count of actively trading Australian businesses, excluding those with turnover below $75,000 that have not registered for GST.
In the 2016-17 financial year – the last full year of data under this Coalition government – 328,205 new business were registered and 261,450 existing businesses were closed.
This leaves us with a net increase of 66,755 businesses – in line with the “65,000 or so” quoted by Henderson.
Labor’s last term in government ended in September 2013. In the 2012-13 financial year, 239,229 new businesses were registered and 300,843 existing businesses were closed.
The net balance was a loss of 61,614 businesses. Again, this figure is in line with Henderson’s statement.
The annual turnover rate (the sum of exits and entries in proportion to total business) between 2007 and 2017 was around 30%.
It appears that that the annual balance between business entrants and exits is correlated with the economic cycle. That is – the more severe economic contractions are associated with higher exits, and lower entries. – Fabrizio Carmignani
Blind review
The conclusions in this FactCheck are correct.
I would have used employment changes from the same month in the previous year.
The practice of politicians to claim that they have “delivered” the change in total employment over a period is erroneous.
Isolating the contribution of government policy to employment growth is a much more complex exercise. – Tim Robinson
Fabrizio Carmignani Professor, Griffith Business School, Griffith University; Reviewer: Tim Robinson Research Fellow, Melbourne Institute, University of Melbourne
On Monday, Macquarie Bank became the latest lender to reprice its home loans, announcing that owner-occupier variable rate loans with principal and interest repayments will increase by 0.06 of a percentage point, while those with interest-only repayments will increase by 0.10 of a percentage point across all LVR bands.
Investment and SMSF loans with variable rates will increase by 0.10 of a percentage point.
Macquarie will drop its three-year fixed rate by 10 basis points for all owner-occupier and investor loans.
The changes are effective from 13 July for new customers and 23 July for existing customers.
ING also flagged the need to increase rates by 10 basis points this week for variable owner-occupied mortgages.
Non-bank lender Pepper is also believed to have lifted rates. As of 6 July, Pepper’s rates are understood to have increased by up to 55 basis points.
Late last month, AMP Bank and Auswide Bank also announced rate hikes in response to increased funding costs. Speaking to Mortgage Business, the chief financial officer (CFO) of Auswide Bank, Bill Schafer, attributed the lender’s decision to lift interest rates on its mortgage products to the sharp rise in the bank bill swap rate (BBSW).
“Our funding costs have risen significantly in the last four months,” Mr Schafer said.
“The BBSW — the 30-day rate and the 90-day rate — has had a large effect on our wholesale funding lines, and they’ve increased by between 30 and 35 points since the beginning of March, so that’s had a substantial effect on our net interest margin.
“We’ve been trying to absorb that across that period of time, with the hope that those costs would be relieved and the BBSW rates would decline, but now we’re nearing the end of the fourth month, we’ve taken the decision that the impact on our net interest margin is too severe, and unfortunately we needed to do an out-of-cycle rate increase.”
The latest Deloitte Australian Mortgage Report 2018, released last week, found that the biggest challenge for non-majors is access to funding relative to the big four.
“We have seen that in the most recent fortnight, some of the non-majors have had to move their standard variable rate in response to movements in the underlying BBSW spread over cash,” Deloitte financial services partner James Hickey said.
“The majors have so far been able to absorb that and not pass on that movement. They may well move on it soon, but it just goes to show the heightened level of sensitivity the regional lenders have to wholesale funding markets.”
Customer Executive Regional and Agriculture, Julie Rynski, said it has been a difficult time for people in the affected areas, who are facing severe drought conditions.
“As Australia’s largest Agribusiness bank, we are acutely aware of the challenges and unpredictability of life on the land and the impact of drought on NAB customers, employees and the wider community,” Ms Rynski said.
“Anyone who needs assistance or advice should contact their local banker so we can discuss their circumstances and determine the best way to help.”
Measures that may be available to eligible customers include:
Extension of loan terms, consideration of restructure of loan repayments to interest only and waiver of all associated extension/restructure fees;
Credit card and personal loan relief where appropriate;
Suspension of home and personal loan repayments;
Waiving costs and charges for early withdrawal of Term Deposits (including Farm Management Deposits);
Waiving home loan and personal loan application fees; and
Provision of support and counselling through NAB’s Employee Assistance Program
Back in January I decided to start more regular content creation for YouTube. Last week we passed 3,000 subscribers, and the number continues to grow. Thanks for your support. And judging by your comments, you appreciate the straightforward data driven approach. Our podcast subscriber base is also expanding nicely too.
Since that time, we have built the arguments using data to highlight around the growing pressures from higher levels of debt, sliding home prices sliding and higher interest rates.
Now one question keeps recurring in the community discussion. I see the problem, but what should I do to protect myself in these uncertain times? This is an excellent question, and one I want to take further. Because the answer is, it depends.
It depends on where you believe the economy is headed. It depends whether you are seeking to protect the value of existing assets and savings, are seeking to exploit the uncertainty, or something else.
So in response, I am going to commence today the first in a series of posts which I have called Financial Resilience 101.
Resilience is defined as “the capacity to recover quickly from difficulties; toughness”.
And we start our journey with a quick recap based on some of the most relevant posts I have already created. If you missed them, now is a good time to catch up.
The first post “Four Potential Finance and Property Scenarios” discusses the range of potential outcomes over the next couple of years, because you will need to decide where to place your bets.
If you are holding to a mild correction and more of the same, you will adopt one set of strategies for resilience, whereas if you are at the other end of the spectrum and looking at global events similar to the GFC a decade ago you will go a different way. Thinking about scenarios is useful if not easy to do. We will update our scenarios again in a future post, but they generally still holding true.
The next post discussed whether now is a good time to buy property “Should I Buy”and here we explored the reasons to buy and not to buy.
Again it partly depends on your view, but also whether you are thinking of property as a place to live or an investment.
The other side of the coin is should I sell now, and we discussed this too in our post “Should I Sell Now?” and we look at the reasons why you might decide to sell, or not.
Again this varies depending on whether you are an owner occupier or a property investor.
Then we went on to explore options beyond property, accepting that things may get shaky. In our post “What Should I Do” we go through the options, from stocks, shares, bonds, commodities and crypto and draw some comparisons with the UK a decade ago via Northern Rock.
Now once you have gone through these sessions you will have a good set of foundations from which to build a Financial Resilience Strategy. Next time we will then go further into what to do next.
And a warning, this is not financial advice, as I cannot take account of individual circumstances, and am not qualified to give such advice. That said, there are some general principles which I think are useful, based on my own experience. And if you find these useful then that is a good outcome. But you will have to make your own decisions.
Two final points, first generally diversification is goodness, as it spreads the risks, and second there are no silver bullets, no simply answers. If there were, I would not be making these videos, I would be going after that solution! Neither Gold, nor Silver nor Crypto are without significant risks. You can easily jump from the frying pan into the fire. Things are decidedly tricky at the moment, so you need to do the work, and make your own choices. No silver (or other metal) bullets here!
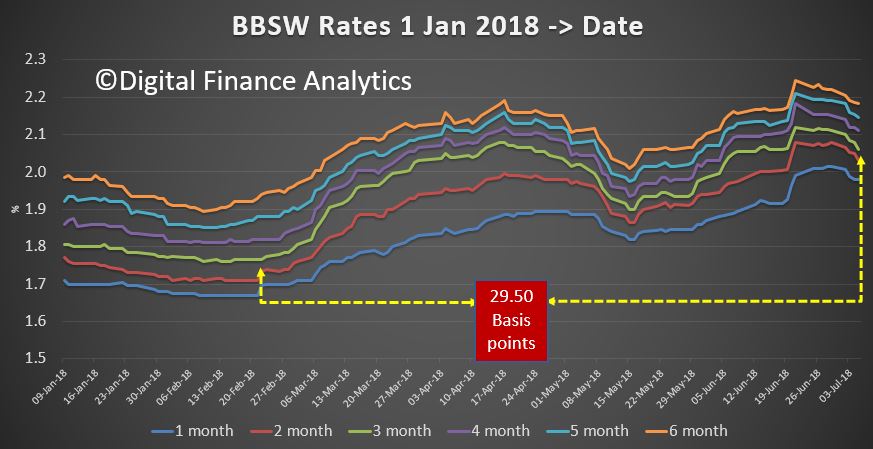
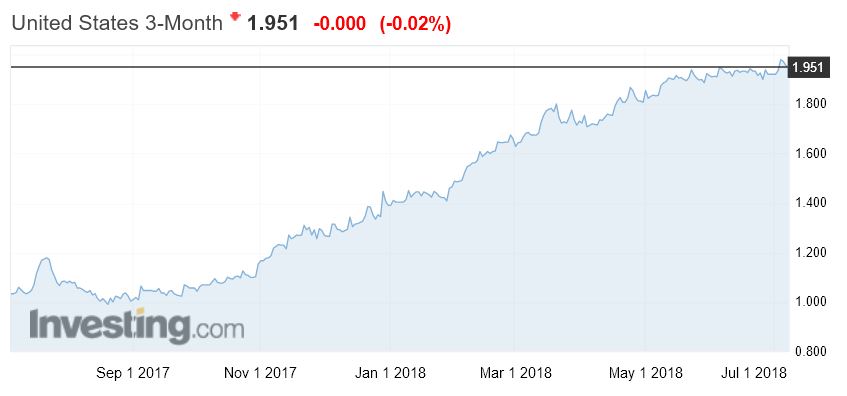
The latest BBSW data shows that in the past few days the gap between the 3 month rate in February and now has fallen from 35 basis points to around 29 basis points.
This mirrors recent short term movements in the US.
But as the Fed is likely to lift again, this slight relief may be just short term.
Economist John Adams and I discuss the problem of foreign debt in the latest edition of our interview series.
With a net $1 trillion of foreign debt owed by the country, in arising rate environment, things could get, well, tricky… Like an iceberg, what lies beneath?
You can also listen to the podcast version.
And if your missed our earlier edition, it is still available.
Welcome to the Property Imperative weekly to 7th July 2018, our digest of the latest finance and property news with a distinctively Australian flavour. By the way if you value the content we produce please do consider joining our Patreon programme, where you can support our ability to continue to make great content. Here is the link.
Watch the video, listen to the podcast, or read the transcript.
This week the RBA left the cash rate on hold once again at 1.5% and continued the trend of doing nothing. In fact, reading the release from Tuesday, it is worth noting two things. First they are being very gentle in referring to home price falls, saying “Nationwide measures of housing prices are little changed over the past six months. Conditions in the Sydney and Melbourne housing markets have eased, with prices declining in both markets. Housing credit growth has declined, with investor demand having slowed noticeably. Lending standards are tighter than they were a few years ago”. Second, we think they would like to lift rates to more normal levels, but cannot thanks to high debt, and downside risks. They are stuck. I believe the next move will be down as the economy weakens (dragged down by the fading property market, rising interest rates internationally, and concerns about China’ economic dynamo). But not yet.
Now compare this with a BIS report also out this week. The BIS is worried by the current low interest rate environment, and in a new report by a committee chaired by Philip Lowe, warn of the impact on financial stability across the financial services sector, with pressures on banks via net interest margins, and on insurers and super funds. They warn that especially in competitive markets, risks rise in this scenario. Low interest rates may trigger a search for yield by banks, partly in response to declining profits, exacerbating financial vulnerabilities. In addition, keeping rates low for longer may create the need to lift rates sharper later with the risks of rising debt costs and the broader economic shock which follows. A salutatory warning! We discussed this in more detail in our post “To “Bail-In” Or To “Bail-Out”, That Is Indeed The Question”.
The contrast between the theoretical macro policy position, and the local situation here in Australia, must at very least be giving Mr Lowe a bit of a headache!
The trajectory of global rates is upwards as we will discuss later. The latest from the FED is that further rate rises are required, and expected. So the FED is doing what the BIS report suggested. But the net result is pressure on Bank funding here, remember that around 30% of bank funding comes from overseas and the BBSW is higher still.
Two points to make here. First as credit availability is the strongest influence of home prices, the easy access to international capital markets the banks have had in recent years meant they could lend more, up to 30% more, hence disastrously higher home prices. Second the weight of evidence is that more banks will lift rates. Citigroup for example, forecasts that the rising cost of funding will prompt Australia’s four major banks to increase their mortgage interest rates independently of the RBA, with the banks tipped to begin lifting their mortgage rates by an average of eight basis points by September. Citigroup adds that the rise in banks’ short-term funding costs since early 2018 is likely to be sustained. And in effect the tenor of the RBA minutes signals to the banks they can go ahead and lift rates.
As rates have fallen, households have leveraged up, supported by lose lending policy and driving home prices to massive multiples of household income as data from IFM Investors showed this week.
And even small rate rises will hurt, as we showed in our latest Mortgage Stress release for June, which was out this week. Mortgage stress continues to rise. Across Australia, more than 970,000 households are estimated to be now in mortgage stress (last month 966,000). This equates to 30.3% of owner occupied borrowing households. In addition, more than 22,000 of these are in severe stress. We estimate that more than 57,100 households risk 30-day default in the next 12 months. We expect bank portfolio losses to be around 2.8 basis points, though losses in WA are higher at 5.2 basis points. We continue to see the impact of flat wages growth, rising living costs and higher real mortgage rates. We discussed this in our post “The Debt Pips Are Squeaking”, in which we also discussed the latest anaemic retail sales figures, and the latest household debt to income ratio from the RBA which are now at a record 190.1. We are literally drowning in debt. And its structural.
The Australian Institute of Health & Welfare released a new report showing that home ownership is out of reach to growing numbers of Australians, thanks to high prices and poor affordability. They say that over the last 20 or so years Australia has seen a shift from outright ownership to owning with a mortgage, and a shift from overall home ownership to private rental Between 1995 and 2015, the proportion of outright owner-occupied households fell from 41.8% to 30.4%. Comparatively, the proportion of households owning with a mortgage has increased, from 29.6% to 37.1%, over the same period. Overall, the proportion of households in home ownership fell from 71.4% to 67.5%. There has also been an increase in the proportion of households renting privately (from 18.4% to 25.3%), and a decline in the proportion of households renting through state and territory housing programs (from 5.5% to 3.5%). Equally telling is home ownership rates between 1971 and 2016, by selected 5-year age groups. The home ownership rate of 30–34 year olds was 64%, and 50% for 25–29 year olds, in 1971. Forty-five years later these rates have decreased notably, with the home ownership rate of 30–34 year olds falling 14 percentage points to 50%. Similarly, that of 25–29 year olds fell 13 percentage points (to 37%). While declines are evident for other age groups they are much less marked. So fewer Australians are tending to own their home at retirement. For Australians nearing retirement, for example, age groups 50–54, 55–59, and 60–64, home ownership rates peaked in 1996 at 80%, 82% and 83%, respectively Since 1996 however, there has been a gradual decline in home ownership rates, most notably in the 50–54 age group which has seen a 6.6 percentage point fall over these 20 years (from 80.3% to 73.7%). This is one reason why we are watching closely our “Down Trader” segment – people seeking to sell and release capital. There are 1.2 million in this state, compared with around 600,000 up Traders, and 150,000 first time buyers. So on simple supply demand logic, more people selling than buying means prices will fall further.
And on that note, CoreLogic said that the weighted average clearance rate has tracked below 60 per cent for 8 consecutive weeks now, while over the same 8-week period last year clearance rates were tracking within the low 70 to high 60 per cent range. Last week Melbourne’s final auction clearance rate fell to 57.2 per cent across a lower volume of auctions week-on-week with 791 held, down on the 941 auctions over the week prior when a higher 59.9 per cent cleared. In Sydney, less than half of the homes taken to auction sold last week. The city returned a final auction clearance rate of 49.7 per cent, down slightly on the 50.1 per cent the previous week, with volumes across the city remaining relatively steady over the week with a total of 634 held. All of the remaining auction markets saw a lower volume of auctions last week, with the final clearance rate across each market also falling week-on-week. There were also a large number of passed in auctions.
Gerard Minack from Minack Advisors said this week that the housing market looks ‘thin’, hinting that prices may be unusually sensitive to a change in demand. Historically housing market turnover tracked price growth. However, turnover has been soft relative to price gains over the past 3-4 years, and in the March 2018 quarter turnover fell to the lowest level since the 1990 recession.
There are still many economists talking of just a small slide in prices over the next few months, but we suspect they are underestimating the impact of tighter credit. For example, Macquarie suggested from their annual mystery shopping survey mortgage power – the amount people could get when applying for a mortgage had not dropped that much at all. But in fact, it seems the non-banks, those not under so much scrutiny from APRA is where the bigger loans reside.
Whereas UBS, the arch property bears, suggest that credit tightening will continue, as lending flows ease, saying one of the key recommendations of the Royal Commission is likely to be a stricter interpretation of Responsible Lending. In particular “reasonable steps” required to verify customers’ financial positions. This is likely to require credit licensees (banks and non banks) to verify living expenses from customers’ transaction banking and credit card data over a period of around 12 months. They go to say that as ANZ stated in its submission to the Royal Commission, verifying living expenses from transaction accounts and credit cards is operationally complex and will likely require substantial investment in technology to automate this process. So UBS believes that while the major banks will be able to absorb these costs, such technological investments may be prohibitive for many of the smaller players. Therefore, they believe that any potential regulatory mismatch benefiting the smaller banks and non-banks is unlikely to be sustainable. In other words, credit will be tighter soon, driving prices lower.
The Corelogic’s Housing Index showed that prices slipped again last week in Sydney, down 0.13%, Melbourne down 0.11%, Adelaide down 0.01% and Perth down 0.07%. Brisbane rose 0.02%. On a 12 month basis, Sydney on average has dropped 4.69%, while Perth has fallen 2.08%. The other centres have risen just a little. But it is worth remembering that Sydney prices are still 66% from the last trough, Melbourne 56%, Brisbane 21% and Adelaide 19%. Perth is only 0.4% higher, thanks to the prevailing weak economic conditions in the West. This weakness also has translated into rental rates, with Perth seeing just a 3% rise over the past 10 years for houses, and a small fall for units. Compare this with a national rise in rentals over the same period of 25.7%. At the other end of spectrum rentals rose 53.8% for Hobart houses, and 44.7% for units, highlighting the housing cost pressure there.
Despite the falls in property values, and the expected future further falls, the AFR said Labor has shrugged off suggestions from the property industry that its planned changes to negative gearing rules should be scrapped because of market conditions. They reported that Shadow treasurer Chris Bowen told a Property Council of Australia forum in June the changes were about making long-term structural adjustments, rather than addressing the short-term cycle. The policy was a once in a generation reform. We think he is right.
The Royal Commission in Darwin this week heard about the thousands of Aboriginal people who are sold unsuitable financial products and vulnerable consumers are targeted by instant cash loan machines because the financial landscape supports predatory practices. Insurance agents were able to exploit and target Aboriginal people because the industry isn’t fully regulated. An excellent The Conversation Article made the point that the cultural, economic and political arrangements that allow this to happen are called “practice architectures”. They include the complex language used to deceive consumers into buying unsuitable products, incentivised high pressures sales tactics, and a lack of care and concern for vulnerable consumers. All of these aspects are within the scope of financial regulators. The funeral insurance industry can push dodgy products because no one is watching. Predatory financial practices will continue until governments and/or regulators do something about it.
More evidence of regulators not doing their job, and the financial sector simply exploiting their customers to make a quick buck.
We heard this week that ASIC has accepted court enforceable undertakings from the Commonwealth Bank of Australia and Australia and New Zealand Banking Group under which the banks have agreed to change the way they distribute superannuation products to their customers. ASIC investigated CBA’s distribution of its Essential Super product and ANZ’s distribution of its Smart Choice Super and Pension product through bank branches. ASIC found a common practice of offering those products to customers at the conclusion of a fact-finding process about customers’ overall banking arrangements. ASIC was concerned that customers may have thought, due to the proximity of the fact-finding process to the offer of Essential Super or Smart Choice Super, that the CBA branch staff or the ANZ branch staff were considering risks specific to the customer when this was not the case. These court enforceable undertakings prevent CBA from distributing Essential Super in conjunction with a Financial Health Check and ANZ from distributing Smart Choice Super in conjunction with an A-Z Review. They also require CBA and ANZ to each make a $1.25 million community benefit payment. If there is a breach of the undertaking ASIC can, under the ASIC Act, apply for orders from the court to enforce compliance. But whilst individuals risk being sent to prison as one Perth finance broker, did this week, or permanently banned from the finance industry for loan fraud, the asymmetric penalties between the small guys and the big firms is – well shameful. It seems to me regulators are going for the easy targets who cannot fight back, whilst imposing mild penalties on the big guys, for fear of court proceedings. The balance is just wrong.
Finally, looking across the markets, shares in Australia started the new financial year well, with most banking stocks going higher. Bendigo Bank was up 1.72%, Suncorp up 0.54% and even the languishing Bank of Queensland rose 0.77%. Westpac was up 0.85%, ANZ up 1.97% on its buybacks, NAB up 1.6% and CBA up 1.2%, though still below its peak in 2017 when it was above $82. So risks in the mortgage book are clearly not worrying investors that much just now. This despite the 90-Day mortgage default rates going higher as reported in the S&P Ratings SPIN Index. Macquarie, who has more business offshore than on shore rose 0.42%, at 122.96, just off its all-time highs, The ASX 200 ended higher up 0.91% to 6,272, a solid rise. The Aussie Dollar did a little better too against the US Dollar settling at 74 cents, up 0.57% and against the Chinese Yuan up 0.7% to $4.94.
Now back to global debt. Deutsche Bank published a chart which showed that of the $50 trillion global bond market, about $8 Trillion of these bonds are now trading at negative interest rates, thanks to changes in interest rates across the market. Within the $50 trillion, the amount of nonfinancial corporate bonds has increased 2.7 times over the past decade to $11.7 trillion, according to Mckinsey. Debt in China has outgrown that in the USA, based on GDP, with non-financial corporate debt in China sitting at 160% of GDP, compared with 97% in the USA, according to JP Morgan. The China credit boom, is well, booming…
This all signals more trouble ahead, given that the US 3 Month bond rate and LIBOR are sitting at highs, and the 10 Year US Bond Rate remains elevated, reflecting the expectation of more FED rate hikes ahead. And the latest from the FED is that further rate rises are required, and expected.
U.S. stocks finished the week mostly higher, thanks mainly to low-volumes of buyers on Friday. The S&P 500 finished the week up about 1.5% and the Dow ended about 0.8% higher for the week. The big winner was the tech-heavy NASDAQ Composite, which closed up about 2.4% for the week. The DOW ended the week up 0.41% to 24,456 after light holiday trading.
US employment data showed still-solid growth in payrolls, but lower-than-expected wages, which eased inflation concerns. Nonfarm payrolls rose by 213,000 in June. That was higher than the consensus estimates of 200,000. The jobless rate unexpectedly rose to 4.0% from 3.8%, missing consensus expectations for it to remain unchanged as more people entered the labor force. Average hourly earnings advanced 0.2% month-on-month in June, below expectations. The data still suggests the Federal Reserve will gradually raise interest rates. The markets are still pricing in two more rate hikes this year.
The real unknown though is the U.S, China Trade Battle which is now officially underway. The U.S. has put tariffs in place on $34 billion worth of Chinese goods and the Chinese hit right back with tariffs on $34 billion on U.S. goods going into effect. China said the U.S. had “launched the largest trade war in economic history to date.” And the U.S. administration is already looking at ramping up the amount of tariffed goods, threatening another 16 billion dollars in two weeks, and then more later. No one knows where this will lead. But there are risks for Australia and other countries getting caught in the cross-fire.
The U.S. dollar endured a tough week that was not helped by the mixed jobs numbers that offered little encouragement for traders looking for faster Fed hikes. The dollar index, which compares the greenback to a basket of six currencies, was down about 0.7% for the week. The dollar also faced pressure from the euro during the week. German Chancellor Angela Merkel resolved an immigration battle and with her interior minister that had threatened the future of her coalition government.
Oil continued higher through the week, as supply limits kicked in, up 1.33% to 73.91, and Gold fell again, down 0.23% as risks abated.
And finally, Bitcoin recovered a little to 6,615 but remains volatile, while the broader VIX index sits slightly above the lows seen last year, but below the peak of a few months back.
So it seems that investors are banking on the debt elastic not snapping back anytime soon, but we will be watching for further signs of stress given the massive amount owing out there as rates rise. Meantime banks are making hay, despite the levels of uncertainly out there. As the BIS report put it “A key takeaway is that, while a low-for-long scenario presents considerable solvency risk for insurance companies and pension funds and limited risk for banks, a snapback would alter the balance of vulnerabilities,”. We have been warned.
Before I sign off, mark your diary. On the 17th July at 8 PM Sydney time I will be running our next live streaming session, where you can discuss in real time the issues in play. Judging by the previous session, it will be a lively event. I will schedule it shortly on our YouTube channel.
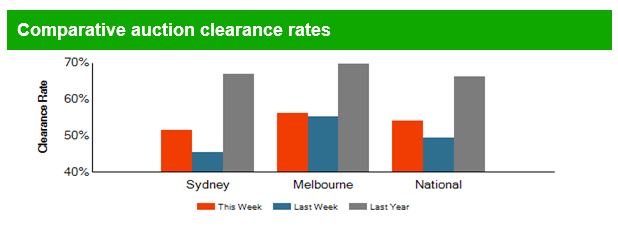
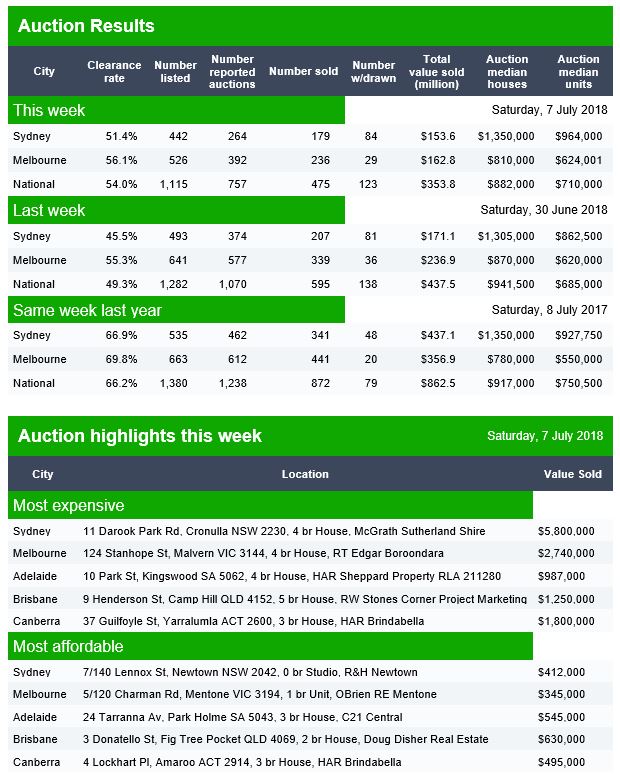
The preliminary data from Domain is out, and the trends continue lower, with a final rate last week below 50% nationally and continued weakness this time around. Many properties are being withdrawn.
In Sydney, of the 442 listed, 84 were withdrawn, and 179 sold. In Melbourne, 526 were listed, 29 withdrawn and 236 sold. Last year at this time, clearance rates were more than 10% higher, on larger volumes.
Brisbane listed 57, 6 were withdrawn and 17 Sold. Adelaide listed 43, withdrew 1 and sold 13. Canberra listed 47, sold 30 and 3 were withdrawn.