A new discussion paper has been published on the Reserve Bank New Zealand’s website: Residential construction and population growth in New Zealand: 1996-2016. It highlights the supply shortfall at approximately 10 percent of Auckland’s housing stock. But not until apartment construction almost completely ceased in 2008 did Auckland’s housing shortage started to become acute.
This paper aims to understand how population growth has affected building activity in New Zealand regions during the last twenty years. Using panel data regression techniques, we estimate that 0.25 – 0.30 additional houses are built for every additional person in a region. The additional 0.25 – 0.30 building permits per person equate to about 40 m2 of new construction, with a value of just over $60,000 in 2016 terms. This construction is in addition to the ‘background’ construction that occurs to replace old houses, which amounts to 2.5 – 3.0 dwellings per 1,000 people per year, or approximately 11,000 – 13,000 dwellings per year.
The estimates suggest Auckland’s construction shortfall between 1996 and 2016 was between 40,000 and 55,000 dwellings, or approximately 10 percent of Auckland’s housing stock. The estimates of the shortfall are fairly robust to changes in the specification of the models; moreover, they all suggest that the shortfall was modest until the end of 2005, when it increased rapidly.
We also examine the relationship between the size of newly constructed dwellings and population change. Since four of the sixteen New Zealand regions experienced almost no population growth over the period, it is possible to contrast the size of newly constructed houses in regions experiencing population change with those that did not. These estimates suggest that, at least until 2005, smaller houses were constructed in growing regions with above-average incomes, particularly Auckland and Wellington, than in growing regions with below average incomes or in regions with no population growth. This difference appears to reflect the much younger age profile of the residents of Auckland and Wellington. It appears that Auckland’s housing shortfall was less severe prior to 2005 precisely because of the large number of small apartments that were constructed in the city. Not until apartment construction almost completely ceased in 2008 did Auckland’s housing shortage started to become acute.
Finally, we analyse the relationship between population growth rates and the number of ‘residential’ construction workers. Our estimates suggest that a 1 percent increase in population growth rates is associated with a 0.4 – 0.5 percentage point increase in the fraction of the workforce in the construction sector. Since regions with zero population growth have 4.5 – 5 percent of their workers involved in residential construction, each percentage increase in the population growth rate increases the number of residential construction workers by approximately 10 percent. This does not include additional workers in related industries such as building materials. Auckland is again an outlier. For most of the period Auckland had approximately 9000 fewer construction workers than could be expected from trends around the rest of the country. Clearly, if this shortfall continues it will be difficult for Auckland to overcome its housing shortage.
Listen, You Can Hear the Screws Tightening On Mortgage Lending. Welcome to The Property Imperative Weekly to 17th February 2018.
Watch the video, or read the transcript.
In this week’s digest of finance and property news we start with Governor Lowe’s statement to the House of Representatives Standing Committee on Economics. He continued the themes, of better global economic news, lifting business investment and stronger employment on one hand; but weak wage growth, and high household debt on the other. But for me one comment really stood out. He said:
it would be a good outcome if we now experienced a run of years in which the rate of growth of housing costs and debt did not outstrip growth in our incomes in the way that they did over the past five years.
This is highly significant, given the fact the lending for housing is still growing faster than wages, at around three times, and home prices are continuing to drift a little lower. So don’t expect any moves from the Reserve Bank to ease lending conditions, or expect a boost in home prices. More evidence that the property market is indeed in transition. The era of strong capital appreciation is over for now.
There was lots of news this week about the mortgage industry. ANZ and Westpac have tightened serviceability requirements. Westpac recently introduced strict tests of residential property borrowers’ current and future capacities to repay their loans. The change is said to be intended to identify scenarios that might affect borrowers’ capacity to pay back their loans. These scenarios include having dependents with special needs that might require borrowers to spend on long-term care and treatment. ANZ has added “a higher level of approval for some discretions” used in its home loan policy for assessing serviceability, reducing approvals outside normal terms.
Talking of lending standards, APRA released an important consultation paper on capital ratios. This may sound a dry subject, but the implications for the mortgage industry and the property market are potentially significant. As part of the discussion paper, APRA, says that addressing the systemic concentration of ADI portfolios in residential mortgages is an important element of the proposals. They have FINALLY woken up to the risks in the system, just years too late! We have significant numbers of loans in the system currently that would now not pass muster. More about that next week.
Their proposals, which focus in on mortgage serviceability, would change the industry significantly, as lower risk loans will be more highly prized (so expect low rate offers for lower LVRs), whilst investment loans, and interest only loans are likely to cost more and be harder to find. Combined this could certainly move the market! The proposals introduce “standard” and “non-standard” risk categories.
As well as increasing the risk weights for some mortgages, they also continue to close the gap between the advanced (IRB) internal approach used by large lenders, and the standard approach used by smaller players. Those in transition (e.g. Bendigo Bank) may find less of an advantage in moving to advanced as a result. You can watch our separate video on this important topic.
Whilst the overall capital ratios will not change much, there is a significant rebalancing of metrics, and Banks will more investment and interest only loans will be most impacted. So getting an investment loan will be somewhat harder and this will impact the property market. The proposals are for consultation, with a closing data 18 May 2018.
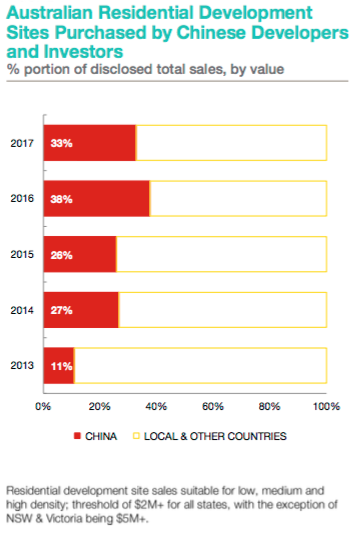
Another data point on the property market came from a new report by Knight Frank which claims that in 2017, one-third of Australian residential development sites were sold to Chinese investors and developers. The share of sales to Chinese buyers has tripled since 2013, but decreased from the 38 per cent recorded in 2016. The level of Chinese investment in residential development sites varied from state to state: in Victoria, 38.7 per cent of residential site sales were to Chinese buyers; in New South Wales, 35.6 per cent of residential site sales were to Chinese buyers, and in Queensland, Chinese buyers comprised 7.4 per cent of total residential site sale volumes. So this is one factor still supporting the market, though in Australia, the Australian Prudential Regulatory Authority has encouraged local financial institutions to impose stricter controls, while in China the government has attempted to moderate capital outflow with China’s Central Bank imposing new rules for companies which make yuan-denominated loans to overseas entities.
The data from the ABS on Lending Finance, the last part of the finance stats for December, really underscores the slowing momentum in investment property lending, especially in Sydney (though it is still a significant slug of new finance, and there is no justification to ease the current regulatory requirements.) The ABS says the total value of owner occupied housing commitments excluding alterations and additions rose 0.1% in trend terms, total personal finance commitments fell 0.2%. Revolving credit commitments fell 1.4%, while fixed lending commitments rose 0.5%. There was a small rise in lending for housing construction, but overall mortgage momentum looks like it is still slowing and the mix of commercial lending is tilting away from investment lending and towards other commercial purposes at 64%, which is a good thing.
There is an air of desperation from the construction sector, as sales momentum continues to ease, this despite slightly higher auction clearance rates last week. CoreLogic said the final auction clearance rate was 63.7 per cent clearance rate across almost double the volume of auctions week-on-week (1,470). Over the week prior, a clearance rate of 62.0 per cent was recorded across 790 auctions. Both auction clearance rate and volumes were lower than what was seen one year ago, when a 73.2 per cent clearance was recorded across 1,591 auctions. There is significant discounting going on at the moment to shift property, and some builders are looking to lend direct to purchases to make a sale. For example, Catapult Property Group launched a new lending division that will help first home buyers get home loans with a deposit of only $5,000. The Brisbane-based company encourages first home buyers in Queensland to enter the real estate market now by taking advantage of the state government’s $20,000 grant that is ending on 30 June 2018. This is at a time when lenders are insisting on larger deposits, and are applying more conservative underwriting standards.
Economic data out this week showed that according to the ABS, trend unemployment remained steady at 5.5%, where it has hovered for the past seven months. The trend unemployment rate has fallen by 0.3 percentage points over the year but has been at approximately the same level for the past seven months, after the December 2017 figure was revised upward to 5.5 per cent. The ABS says that full-time employment grew by a further 9,000 persons in January, while part-time employment increased by 14,000 persons, underpinning a total increase in employment of 23,000 persons. The fact is that while more jobs are being created, it is not pulling the rate lower, and many of these jobs are lower paid part time roles – especially in in the healthcare sector. In fact, the growth in employment is strong for women than men. A rather different story from the current political spin!
In a Banking Crisis, are Bank Deposits Safe? We discussed the consequences of recently introduced enhanced powers for APRA to deal with a bank in distress this week. There were several well publicised Government bail-out’s of banks which got into problems after the GFC. For example, the UK’s Royal Bank of Scotland was nationalised. This costs tax payers dear, so there were measures put in place to try to manage a more orderly transition when a bank gets into difficulty and raises the question of “Bail-in” arrangements. Take New Zealand for example. There regulators have specific powers to grab savings held in the banks in assist in an orderly transition in the case of a failure, alongside capital and other bank assets. And, given the New Zealand position (and the tight relationship between banking regulators in Australia and New Zealand), we should look at the position in Australia. Are deposit funds in Australia likely to be “bailed-in”? Well, the Treasury confirmed that because deposits are not classified as capital instruments, and do not include terms that allow for their conversion or write-off, they cannot be ‘bailed-in’. But we have a catch all clause in APRA’s powers that says they can grab “any other instrument” and deposits, despite the Treasury reassuring words, is not explicitly excluded. So I for one cannot be 100% convinced savings will never be bailed-in. And that’s a worry! I recall the Productivity Commission comment last week, that financial stability had taken prime place compared with competition (and so customer value) in financial services. The issue of bail-in of deposits appears to be shaping the same way. You can watch our separate video discussion on this important topic.
The first round of public hearings for the Banking Royal Commission will focus on lending, including mortgages, credit cards and car loans; we heard during the opening session. The Commission highlighted the large size of the lending market, and the significant number of submissions they have already received on misconduct in this area, including relating to intermediaries, commission and advice. In addition, as part of the opening address, we were told that some of the major players were unable to provide the full range of misconduct information that Commission requested. Some players offered a few case studies, and were then asked to provide more detail over the past 5 years (as opposed to 10) but said they could not meet the required deadline. Based on the opening round, Banks are going to find this a painful process. Not least because The Commission is publishing information on the sector. In its first release, it pointed to declining competition in the banking sector, with the number of credit unions falling due to consolidation and the major banks holding 75 per cent of total assets held by ADIs in Australia. The paper noted that five of the 20 listed companies that make up the ASX20 are banks, noting that the major banks have “generally achieved higher profit margins than other types of ADIs” with a profit margin of 36.4 per cent in the June quarter 2017. They also underscored that Australia’s major banks are “comparatively more profitable” than some of their international peers in Canada, Sweden, Switzerland and the UK.
We expect to hear more from the Royal Commissions on unfair and predatory practices. To underscore this there was some good news for Credit Card holders, with new legalisation passed in parliament to force Credit card providers to scrap unfair and predatory practices. However, the implementation timetable is extended into 2019. The reforms include:
Requiring affordability assessments be based on a consumer’s ability to repay the credit limit within a reasonable period (from July 2018). This tightens responsible lending obligations for credit card contracts.
Banning unsolicited offers of credit limit increases (from January 2019). At the moment, whilst the law forbids providers from making these sorts of offers in writing, offers can be made by phone and other mediums. This loophole has been exploited, but will now be closed.
Simplifying how credit card interest is calculated, especially, banning the practice of backdating interest rate charges. Currently, some providers were attracting new customers with promotional low rate, or no rate offers, say for the first month. But, if a customer failed to pay off in full a credit card bill after the first month, the credit card company was often retrospectively applying the new interest rate to previous purchases. This was allowed in the banks’ small print, but the government said the practice did “not align with consumers’ understanding and expectation about how interest is to be charged”. This will be banned, from next year.
Requiring credit card providers to have online options to cancel cards or to reduce credit limits (from January 2019). At the moment, some card providers force customers to come into a bank branch to reduce limits or terminate cards, and when they did come in were often persuaded not to do it. The asymmetry between fast credit card approvals online, and slow cancellation will end.
So another week highlighting the stresses and strains in the banking sector, and the forces behind slowing momentum in the property market. And based on the stance of the regulators, we think the screws will get tighter in the months ahead, putting more downward pressure on mortgage lending home prices and the Banking Sector. Something which the RBA says is a good thing!
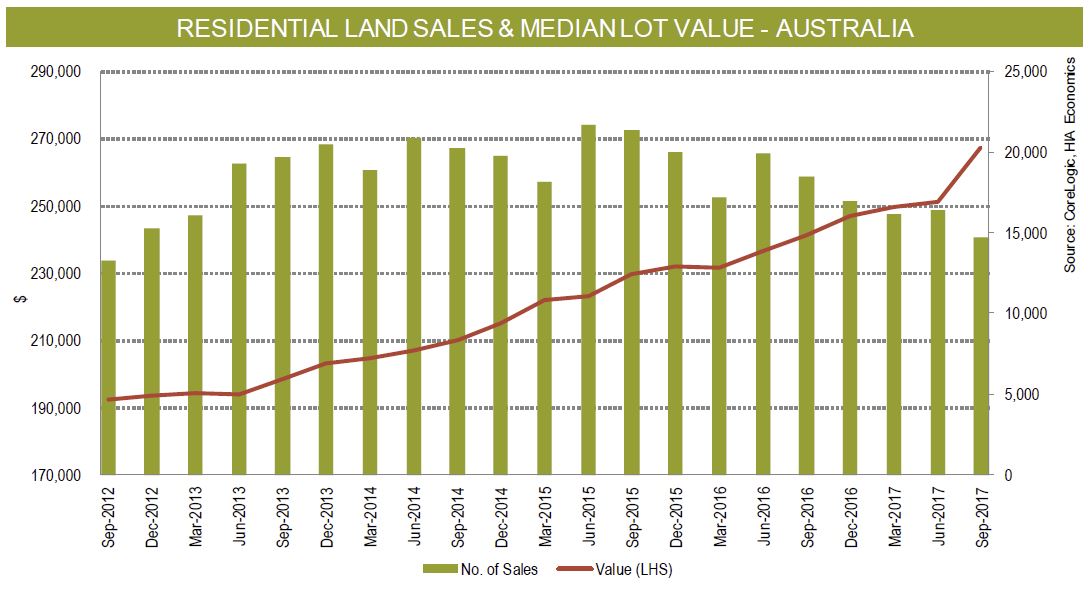
The latest HIA-CoreLogic Residential Land Report shows that the median vacant residential land lot price rose nationally by 6.5 per cent during the September 2017 quarter to reach $267,368.
“Yet again, the price of residential land in Sydney and Melbourne has touched fresh all-time highs.
“Transactions on the land market continue to drop, indicating that supply is simply not matching demand sufficiently.
“The high cost of new residential land is at the heart of Australia’s housing affordability crisis.
“The housing industry’s ability to ramp up the supply of new dwellings as demand dictates is hampered by the inconsistency of the land supply pipeline. The time it takes for land to be made available to builders is unnecessarily long,” concluded HIA Senior Economist Shane Garrett.
According to Eliza Owen, CoreLogic’s Commercial Research Analyst, “The 6.5 per cent acceleration in vacant residential land prices suggests strong demand, even in the context of our largest residential markets passing peak growth rates for the current cycle. The CoreLogic Hedonic Home value index is showing a 1 per cent quarterly decline in capital city dwellings in the three months to January, led by the Sydney market which saw a 2.5 per cent decline.
“Despite the softening in capital growth, land prices were driven higher by long term confidence in some Australian metropolitan markets. Indeed, developers may act counter-cyclically to secure vacant land on the fringe of metropolitan areas before the next upswing. This is reflected in Melbourne, which saw over one in five of the 14,704 vacant land transactions in the year to September.
“In Victoria, CoreLogic development data indicates that 48.6 per cent of residential subdivisions in 2017 commenced on the fringes of Melbourne, such as in Hume, Whittlesea and Wyndham. This further demonstrates the high levels of demand for housing that is connected to the facilities and employment opportunities of major cities,” concluded Eliza Owen.
A new report from Knight Frank claims that in 2017, one-third of Australian residential development sites were sold to Chinese investors and developers.
In total, site sales to Chinese investors and developers equated to $2.02 billion, according to the report ‘Chinese Developers in Australia – Market Insight 2018’.
The report has been released to coincide with Chinese New Year, which this year is on Friday 16 February, 2018.
Knight Frank’s head of residential research, Australia, Michelle Ciesielski said, “Chinese developers have continued to dominate foreign investment in residential development sites across Australia. Many are now well-established in the local market.”
The share of sales to Chinese buyers has tripled since 2013, but decreased from the 38 per cent recorded in 2016, she said.
Source: Knight Frank Research.
Tighter regulation in both Australia and China has not dampened Chinese interest in Australian real estate
“Sustained developer interest in the Australian market has come in spite of government efforts in both Australia and China to tighten credit conditions as they relate to residential investment and development,” said Ciesielski.
“In Australia, the Australian Prudential Regulatory Authority has encouraged local financial institutions to impose stricter controls, while in China the government has attempted to moderate capital outflow with China’s Central Bank imposing new rules for companies which make yuan-denominated loans to overseas entities.
“However, in mid-2017, this was relaxed somewhat – resulting in a boost to market confidence.” said Ciesielski.
Melbourne received the highest proportion of Chinese buyers of development sites
The level of Chinese investment in residential development sites varied from state to state:
in Victoria, 38.7 per cent of residential site sales were to Chinese buyers
in New South Wales, 35.6 per cent of residential site sales were to Chinese buyers, and
in Queensland, Chinese buyers comprised 7.4 per cent of total residential site sale volumes.
Ciesielski said Melbourne was the most popular city for Chinese investors because it has sustained population growth, strong residential capital gains, and relatively low total vacancy rates.
“Many developers consider that Melbourne offers better relative value when compared to Sydney,” she said.
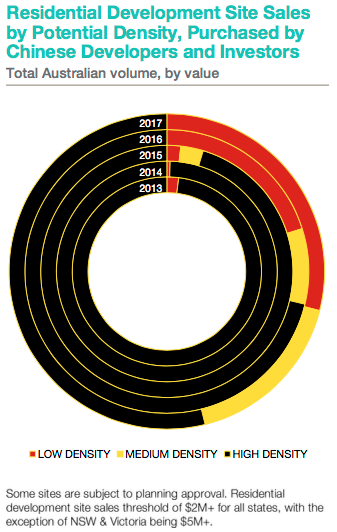
Chinese developers are shifting their focus to lower density developments
The report shows that Chinese developers and investors are increasingly focused on lower density developments in Australia, with 29 per cent of all sites purchased suited to low density, up from two per cent in 2013.
Source: Knight Frank Research.
Knight Frank’s head of Asian markets, Australia, Dominic Ong said, “As Chinese developers gain experience in higher-density projects across the major cities, there has been diversification in many of their portfolios to include medium and lower-density sites.
“These lower-density projects have also become more popular with local developers – especially in NSW, with the draft Medium Density Design Guide being released, identifying the ‘missing middle’ to encourage more low-rise, medium-density housing to be built.
“This type of project also tends to have less hurdles with the imposed tighter lending restrictions, and overall, lowers the delivery risk to the developer,” said Ong.
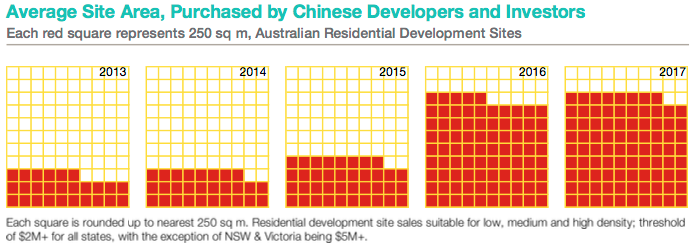
Chinese developers are buying larger plots
Ciesielski said that because Chinese buyers are shifting to lower-density developments, the size of the sites they are buying is larger.
“In 2017, the average site purchased was 21,785 square metres, increasing three-fold since 2013,” she said.
Source: Knight Frank Research.
“It’s expected lengthier due diligence will be carried out for those now established in the local market, and for new developers coming into Australia, transactions will be reliant on the ability to transfer their funds,” concluded Ciesielski.
A suitable construction funding model is the critical missing ingredient needed to deliver more affordable housing in Australia. Aside from short-lived programs under the Rudd government, we have seen decades of inconsistent and fragmented policies loosely directed at increasing affordable housing. These have failed to generate anything like enough new supply to meet outstanding needs.
Our latest research looked at recently built, larger-scale affordable housing projects in contrasting markets across Australia. We examined each scheme’s cost, funding sources and outcomes. We then developed a housing needs-driven model for understanding the financial and funding requirements to develop affordable housing in the diverse local conditions across the country.
Up to now, the key stumbling block has been the “funding gap” between revenue from rents paid by low-income tenants and the cost of developing and maintaining good-quality housing. The Commonwealth Treasury acknowledged this problem last year. And the problem is greatest in the urban areas where affordable housing is most needed.
What does the new model tell us?
The Affordable Housing Assessment Tool (AHAT) enables the user to calculate cost-effective ways to fund affordable housing to meet specified needs in different markets. It’s a flexible interactive spreadsheet model with an innovative feature: it enables users to embed housing needs as the driver of project and policy, rather than project financial feasibility driving who can be housed.
Affordable housing developments have recently been relatively sparse. However, our research highlighted the varied and bespoke funding arrangements being used.
Despite this variety, too often project outcomes are driven purely by funding opportunities and constraints, rather than by defined housing needs. One notable constraint is the fragmented nature of affordable housing subsidy frameworks both within and across jurisdictions.
Our case study projects generated a diversity of housing outcomes. This can be seen as an unintended positive of the bespoke nature of affordable housing provision as a result of the need to “stitch together” gap funding from multiple sources on a project-by-project basis.
Equally though, the lack of policy coherence and fit-for-purpose funding added cost and complexity to the development process. By implication, this leads to a less-than-optimal outcome for public investment. Despite providers’ best efforts, current approaches are not the most efficient way to deliver much-needed affordable housing.
What are the lessons from this research?
We applied the model to typical housing development scenarios in inner and outer metropolitan areas and regions. By doing so, we identified six key lessons for funding and financing affordable housing delivery.
1) Government help with access to land is central to affordable housing development and enhances long-term project viability.
Especially in high-pressure urban markets, not-for-profit housing developers cannot compete with the private sector for development sites. High land costs, particularly in inner cities where affordable housing demand is most extreme, can render financial viability near impossible. Having access to sites and lower-cost land were two of the most important components of feasible projects.
2) Government equity investment offers considerable potential for delivering feasible projects and net benefit to government.
How governments treat the valuation of public land with potential for affordable housing development must be reviewed. Conventionally, even where affordable housing is the intended use, governments typically insist on a land sale price based on “highest and best use”.
It would be preferable in such cases to treat the below-market value assigned to public land as a transparent subsidy input. This would mean the sale price reflects the housing needs that the development seeks to meet. That is, the land value should be priced as an affordable housing development for a specific needs cohort.
By retaining an equity stake, government could account for its input as an investment that will increase in value over time as land values appreciate.
3) Reducing up-front debt load and lowering finance costs are critical to long-term project viability.
Debt funding imposes a large cost burden over a project’s lifetime. This is ultimately paid down through tenant rents. Reducing both the cost and scale of private financing can have a significant impact on project viability.
The analysis reinforces the rationale for the Australian government’s “bond aggregator” facility for reducing financing costs for affordable housing projects. But this must come in tandem with other measures to reduce up-front debt.
4) Delivery across the range of housing needs helps to meet overall social and tenure mix objectives. This also can help improve project viability through cross-subsidy.
Mixing tenure and tenant profiles can enable affordable housing providers to produce more diverse housing that meets the full range of needs.
Cross-subsidy opportunities arising from mixed-tenure and mixed-use developments can also enhance project feasibility. By improving a provider’s financial position, this helps advance their long-term goal of adding to the stock of affordable housing. And, by providing welcome flexibility, this enables organisations to better manage development risk across different markets and cycles.
5) The financial benefit of planning bonuses is limited
Inclusionary zoning mechanisms impose affordable housing obligations on developers through the planning system. This approach potentially offers a means of securing affordable housing development sites in larger urban renewal or master-planned areas.
However, our research demonstrated that planning bonuses allowing increased dwelling numbers in return for more affordable housing have little beneficial impact on project viability. This is because the additional dwellings allowed generate additional land and/or construction costs but no matching capacity to service a larger debt.
However, planning bonuses can be useful as part of a cross-subsidy approach. In this case, they may support project viability, without necessarily resulting in any additional affordable dwellings.
6) Increasing the scale of not-for-profit provision offers financial benefits that help ensure the long-term delivery of affordable housing.
Our analysis supports the case for targeting public subsidy to not-for-profit developers (government or non-government) to maximise long-term social benefit. Investing in permanently affordable housing ensures the social dividend of affordable housing can be continued into the future.
Comparable subsidies are not preserved when allocated to private owners. They will seek to trade out at some stage, capitalising the subsidy into privatised gain.
The results of our case study analyses and modelling highlight the need to develop comprehensive funding and subsidy arrangements that account for different costs in different locations. These arrangements also must be integrated nationally to support affordable housing delivery at scale.
This study reiterates the common finding of research over the last decade: both Commonwealth and state/territory governments need to develop a coherent and long-term policy framework to provide housing across the full spectrum of need.
Authors: Laurence Troy, Research Fellow, City Futures Research Centre, UNSW; Bill Randolph, Director, City Futures – Faculty Leadership, City Futures Research Centre, Urban Analytics and City Data, Infrastructure in the Built Environment, UNSW; Ryan van den Nouwelant, Senior Research Officer – City Futures Research Centre, UNSW; Vivienne Milligan, Visiting Senior Fellow – City Futures Research Centre, Housing Policy and Practice, UNSW
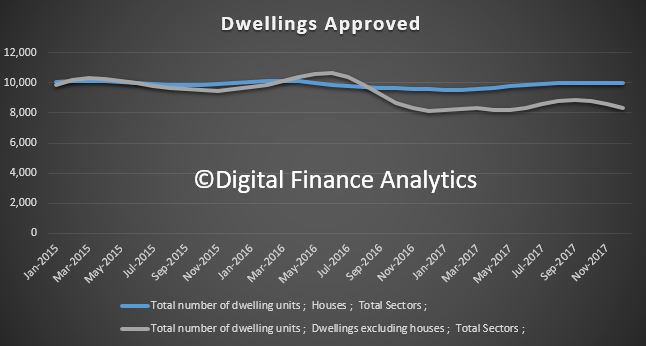
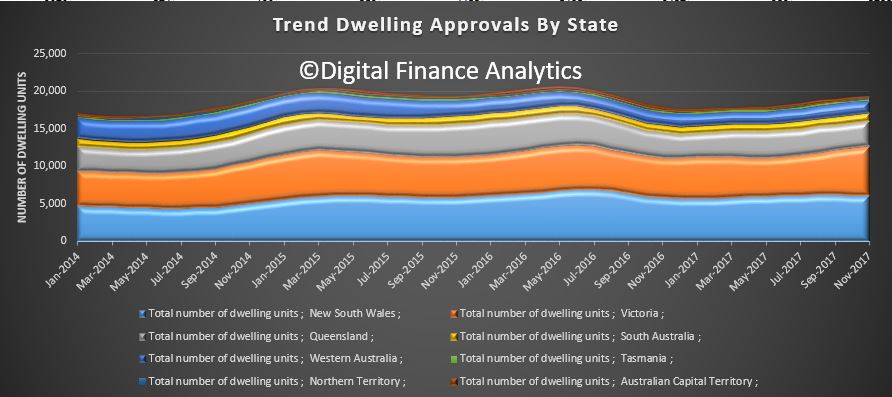
The number of dwellings approved fell 1.7 per cent in December 2017, in trend terms, and has fallen for three months.
Approvals for private sector houses have remained stable, with just under 10,000 houses approved in December 2017, but the fall was in apartments.
In trend terms, approvals for private sector houses fell 0.2 per cent in December. Private sector house approvals fell in South Australia (1.5 per cent), Western Australia (0.9 per cent) and New South Wales (0.2 per cent) but rose in Queensland (0.4 per cent). Private house approvals were flat in Victoria. But it is the trends in unit approvals which show the most significant variations.
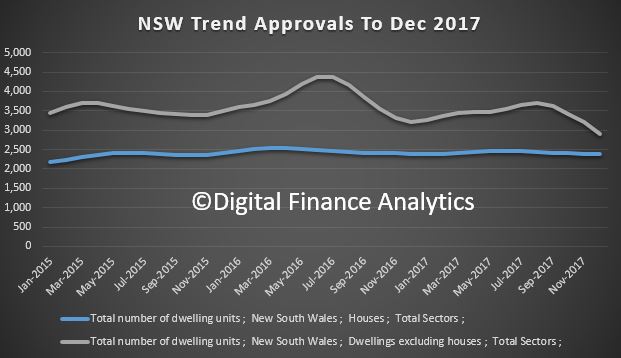
NSW is leading the way down from a high in May 2016.
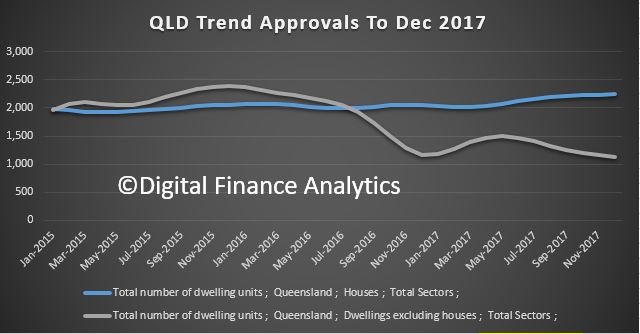
QLD continues to slow, from a peak in November 2015.
WA is moving up, just a little, from a low in May 2017.
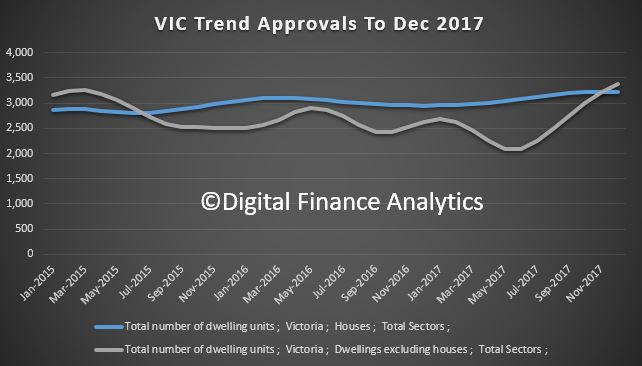
VIC is bucking the trend, with a significant rise since May 2017, but we wonder for how long, as supply is already taking the heat out of new unit sales.
The value of total building approved fell 0.3 per cent in December, in trend terms, after rising for 11 months. The value of residential building fell 0.2 per cent while non-residential building fell 0.4 per cent.
There could be troubled times ahead for small businesses and contractors working in construction, with property analysts and economists kicking of the year with predictions the residential apartment sector slowdown could cause pain.
“There is absolutely no question we have seen a considerable softening in the construction end of the residential apartment space,” Watpac managing director Martin Monro warned in The Australian today.
While data from the Australian Bureau of Statistics shows new housing starts in the year to September rebounded, experts and industry leaders have been divided in commentary on the state of the sector and what the next 12 months will hold for builders and their suppliers.
Digital Finance Analytics principal Martin North says while it’s not a uniform trend across the country, there are troubling signs on the eastern seaboard in particular.
“What I’m noticing is that those in the construction sector – from small builders to sub-contractors – have significantly lower confidence levels than they did six months ago,” he says.
“Their forward pipeline of work is wilting, especially across Brisbane and Melbourne. And now I’m seeing it in and around Sydney for the first time.”
And it’s demand for high rise apartments, he says, that is seeing the biggest drop.
“Investors are quite concerned because capital values look to have stalled and could be reversing. It’s also much more difficult to get financing now and foreign buyers have defected,” he says.
North says there could be more pain to come in Queensland.
“Brisbane is where the pain is most extreme, but I’m seeing it in and around Melbourne and Sydney now.”
Sub-contractors concerned over risks of non-payment
Weakness in the Brisbane market has already claimed its casualties, with several builders having liquidated in the last year.
With several other builders having suffered a similar fate, there are fears any continued slowdown could see more sub-contractors not getting paid. Those working as contractors in the building space are worried more pain could be to come this year.
“The industry is a shambles and is overseen by an inept QBCC who are hamstrung by poor legislation,” says Subbie United’s John Goddard.
Goddard claims sub-contractors have a difficult time recovering what they owe in the event a building company collapses.
“You then have pre-insolvency advisors telling these builders how to hide assets before they recommend a friendly liquidator to defeat creditors who are in the main, subbies.”
Housing a cyclical industry
However, small business ombudsman Kate Carnell says while weakness exists in some parts of the building sector, small businesses and contractors should not be alarmed.
“The thing about the industry is it’s cyclical. There’s big ups and downs and that’s how it works. And in some places there’s an oversupply in that space,” she says.
“But if you look at some of the figures around new home starts, there’re looking pretty good and strong. There’s still a dearth of new homes in the markets as we’ve got quite strong population growth.”
The game is up. Major changes are rippling through the property market, with continued pressure on many households, so we examine the latest data.
Welcome to the Property Imperative weekly to 13 January 2018. Watch the video or read the transcript.
In this week’s review of the latest finance and property news, we start with the AFG Mortgage Index with data to December 2017. While the view is myopic (as its only their data) it is useful and really highlights some of the transitions underway in the industry. First, there has been an astonishing drop in the number of interest only loans being written, from 60% of volume in 2015, to 20% now – WOW! We also see a small rise in first time buyer volumes, as expected. So the regulatory intervention is having some impact. However, average loans size is rising (and faster than income and inflation), and Victoria stands out as the state to watch with an increase in average loan size over the past 12 months nearly double the size of the increase in New South Wales. So more still needs to be done on the regulatory front. Overall, the national average loan size is up 2.8% over the past 12 months. The average loan size in New South Wales is now $613,084. Queensland has increased by 3.4% to now be sitting at $416,921. South Australia is up 3.4% to $390,706. The Northern Territory is up 22% to $469,502, albeit from a low volume. Reflecting the challenges being encountered by the WA economy, the state’s average loan size is down 1.1% to $439,944. Finally, the share of the major’s banks is falling, as we have seen from other data, as smaller players and non-banks pick up the slack. The majors now have just 64.2% of the market compared to the non-majors sitting at 35.8%.
There is more evidence of poor mortgage lending practice, according to online property lender Tic:Toc Home Loans as reported in The Australian Financial Review. This is another version of the ‘liar loans’ story, and shows that borrowers are more stretched than some lenders suspect. Tic:Toc says, one in five property borrowers are exaggerating their income and nearly half understating their spending, triggering new concerns about underwriting standards and vulnerability to sharp economic corrections. We see similar issues in our own surveys, as households stretch to get the largest mortgage they can, whatever the cost, and whatever the risk.
APRA released the final version of the revised reporting requirements for residential mortgage lending. It comes into effect from March and lenders will have to report more fully, including data on gross income, (excluding super contributions), new reporting on self-managed superannuation funds (SMSFs) and non-residents, as well as all family trusts holding residential mortgages. Reporting of refinanced loans should include date of refinance (not original funding date) and APRA says the original purpose of the loan is not relevant to reporting when refinanced. Once again we see APRA in catch-up mode trying to get the data to manage the mortgage lending sector more effectively. We think they have been late to the party, and have much to do.
The chairman of the Australian Competition and Consumer Commission has revealed that there will be some “surprises” in the upcoming draft report into how the banks price residential mortgage products. The inquiry into how the major banks price their mortgage is the first undertaking of the ACCC’s new Financial Sector Competition Unit, which is tasked with undertaking regular inquiries into specific competition issues across the financial sector. Starting with the $1.2 million inquiry into residential mortgage product pricing, the ACCC is aiming to understand how the banks affected by the major bank levy explain any changes or proposed changes to fees, charges or interest rates in relation to residential mortgage products. The inquiry relates to prices charged until 30 June 2018. A draft report will be published in February or March. This will be an important piece of work especially, as the corporate watchdog has also previously warned that the big banks could be in breach of the ASIC Act over the reasons given for hiking interest rates.
Turning to broader economic news, The November data from the ABS shows that Australian retail turnover rose 1.2 per cent in November 2017, seasonally adjusted, with Black Friday and iPhone X sales driving the outcome This follows a 0.5 per cent rise in October 2017. Some will spruke this as a positive sign. However, the more reliable trends are less positive, with the estimate for retail turnover up 0.1 per cent in November 2017 the same as October 2017. This is just 1.7 per cent over that past year, so still weak, reflecting stagnant wage growth, rising costs and high levels of debt. The state trend data showed NSW, ACT and QLD had no change, NT fell 0.2% along with WA, while VIC rose 0.3% and SA 0.4%, and TAS rose 0.2%. Online retail turnover was a new record at 5.5 per cent of total retail turnover. But the key takeaway is that households are continuing to keep their wallets firmly in their pockets.
The latest ANZ Job Ads series for December in seasonally adjusted terms, fell 2.3% largely unwinding the increase over the previous two months. On an annual basis job ads are up 11.4%, a slight moderation from 12.0% y/y growth the previous month. The labour market in 2017 was characterised by widespread job growth (particularly in full time jobs), an increase in participation and a fall in the unemployment rate to a four-year low of 5.4%. Growth in ANZ Job Ads provided a leading signal of this strong performance. But of course this has not been converted to rising wages growth so far.
The Building Approvals data from the ABS was much stronger than expected, with the number of dwellings approved up 0.9 per cent in November 2017, in trend terms, and has risen for 10 months. The strong results were driven by renewed strength in approvals for apartments. Approvals for private sector houses fell 0.1 per cent in November. Private sector house approvals fell in Western Australia (3.3 per cent), New South Wales (0.8 per cent) and Queensland (0.4 per cent), but rose in South Australia (1.3 per cent) and Victoria (1.1 per cent).
Consumer Confidence was stronger in the first week of January according to the ANZ/Roy Morgan index, which jumped 4.7% to 122 last week, leaving it at the highest level since late 2013. It often jumps after Christmas, and perhaps the holidays and ashes victory are colouring perspectives. Certainly, it makes an interesting contrast to our own Household Financial Security Index, which we released this week, based on December 2017 survey data. The latest edition of the Digital Finance Analytics Household Financial Security Confidence Index, fell from 96.1 last month to 95.7 this time, and remains below the neutral measure of 100. You can watch our video where we discuss the research.
Analysis of households by their property owning status reveals that property investors are in particular turning sour, as flat net rental incomes, and rising interest rates hit many, at a time when property capital growth is stalling. Owner occupied households are faring a little better, thanks to a range of ultra-cheap mortgage rates on offer at the moment, but they are also concerned about price momentum. Those without property interests remain the least confident, as the costs of renting outstrip income growth, and more are slipping into rental stress.
More questions came out this week, when The ABC is reporting that a Treasury FOI request has shown that Federal Labor’s negative gearing overhaul would likely have a “small” impact on home values, official documents reveal, contradicting Government claims the policy would “smash” Australia’s housing market. The previously confidential advice to Treasurer Scott Morrison from his own department said the Opposition’s plan might cause “some downward pressure” and could have “a relatively modest downward impact” on prices. This is further evidence that tackling negative gearing should be a strategic priority to help bring our housing market back to reality.
There is also a blind spot at the heart of macroeconomics according to Claudio Borio Head of the BIS Monetary and Economic Department – the BIS is the Central Bankers Banker. He argues that a core assumption implicit in policy setting is that macroeconomics can treat the economy as if it produced a single good through a single firm. The net effect of this assumption is to drag down interest rates and productivity. The truth is much more complex, and within the economy there are “zombie firms” where resources are effectively misallocated, leading to reduced productivity and lower than expected economic outcomes, which will cast a long shadow through the economic cycle. The bottom line is first, credit booms tend to undermine productivity growth as they occur and second, the subsequent impact of the labour reallocations that occur during a financial boom is much larger if a banking crisis follows. This may also help to explain the current gap between employment and wages growth.
Finally, if you want more evidence of the risks in the system look at the RBA chart pack which was released this week. You can watch our video on this, but first, relative to the ultra-low cash rate, actual mortgage rates are rising – no surprise given the rise in mortgage stress we are registering. Next, home loan approvals are on the slide – expect more of this as tighter underwriting standards bite, and many interest only borrowers are forced to switch to higher cost interest and principal loans. Home price indices are trending lower (but still net positive growth overall at the moment). Expect more falls in the months ahead. Household debt continues higher. Now double disposable income, and we have some of the most highly in debt households in the world. Lending growth is still three times income, so this is likely to continue higher. All this is bearing down on household consumption as real income growth stalls. The savings ratio is falling, as households tap these to prop up their finances, OK in the short term, but unsustainable longer term.
In summary, UNSW’s Professor Richard Holden wrote that troubling borrowing and lending markers in the Australian housing market suggest that the lessons from the US mortgage meltdown have not been learned. He rightly draws comparisons with the USA, as we discussed in last week’s Property Imperative, with loose lending standards, a high penetration of interest only loans, many of which will need to be refinanced to higher rate principal and interest loans down the track, and liar loans. Plus, there are questions about where borrowers are getting their deposits from (even drawing from credit cards or borrowing from the Bank of Mum and Dad), and while more loans are originated via brokers, he suggests the banks are myopic to the risks in their portfolio. He says we are still left with highly indebted households who have nearly $2 of debt for every $1 of GDP, a raft of interest-only loans that will soon involve principal repayments, and stagnant wage growth, and concludes “Having lived in the US during the mortgage meltdown I’m sorry to say that I’ve seen this movie before. The question is: why haven’t our bankers?” I would add, our Regulators should answer the same question. We are on the brink; the game is up!
And that’s the Property Imperative weekly to 13 January 2018. If you found this useful, do like the post, add a comment, or subscribe to receive future updates. In the past week our YouTube Channel followers have grown by a third, so thanks to all those who joined and the comments you left. We are busy collecting questions for our next Q&A session, so keep a look out for that.
Meantime, we will be back with more insights in the next few days, and many thanks for taking the time to watch.
The number of dwellings approved rose 0.9 per cent in November 2017, in trend terms, and has risen for 10 months, according to data released by the Australian Bureau of Statistics (ABS) today.
“Dwelling approvals have continued to rise in recent months, which has been driven by renewed strength in approvals for apartments,” said Justin Lokhorst, Director of Construction Statistics at the ABS. “Approvals for private sector houses have remained stable, with just under 10,000 houses approved in November 2017.”
Dwelling approvals increased in November in Victoria (5.6 per cent), Tasmania (3.1 per cent) and South Australia (0.1 per cent), but decreased in the Australian Capital Territory (21.9 per cent), Northern Territory (3.8 per cent), Queensland (1.2 per cent), New South Wales (0.9 per cent) and Western Australia (0.6 per cent) in trend terms.
In trend terms, approvals for private sector houses fell 0.1 per cent in November. Private sector house approvals fell in Western Australia (3.3 per cent), New South Wales (0.8 per cent) and Queensland (0.4 per cent), but rose in South Australia (1.3 per cent) and Victoria (1.1 per cent).
In seasonally adjusted terms, dwelling approvals increased by 11.7 per cent in November, driven by a rise in private dwellings excluding houses (30.6 per cent), while private house approvals fell 2.0 per cent.
The value of total building approved rose 1.5 per cent in November, in trend terms, and has risen for 11 months. The value of residential building rose 2.3 per cent while non-residential building rose 0.2 per cent.
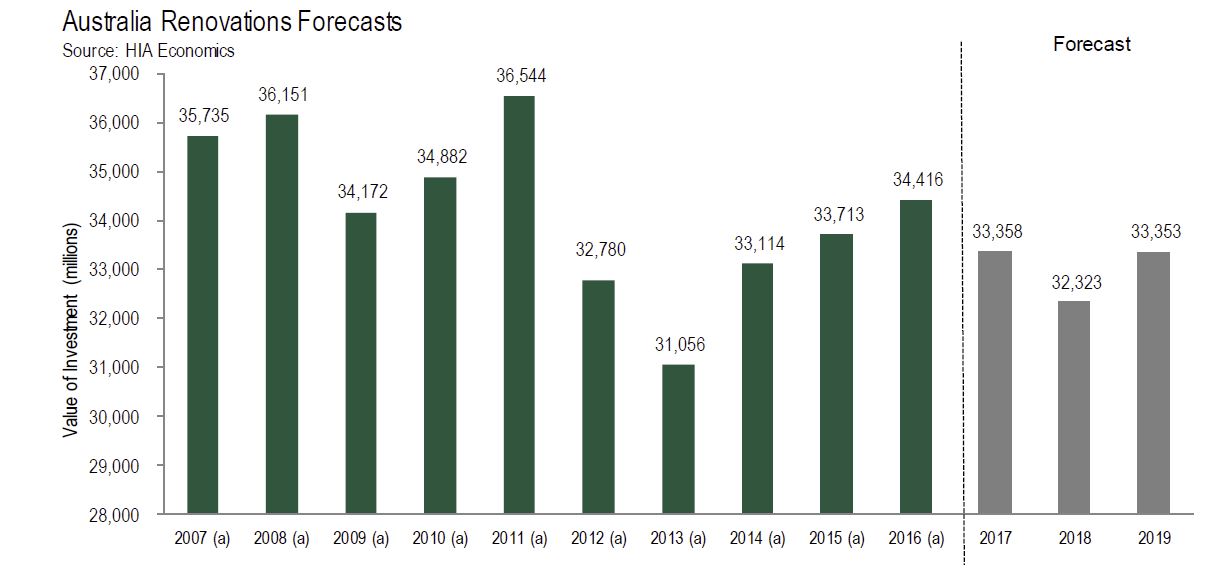
According to the HIA, in the December 2017 edition of their Renovations Roundup report which is released today, low wage growth and fewer home sales resulted in a slowing in renovations activity in 2017.
The HIA Renovations Roundup is the most comprehensive regular review of Australia’s $33 billion home renovations market. The report also includes the exclusive results of a survey of 595 renovations firms right across the country.
“The near term outlook for home renovations demand is being held back by sluggish wages growth. Because renovations activity is often initiated by the new owners of older homes, the dip in established house turnover over the past 12 months has not accelerated renovations activity this year,”
“During 2017, home renovations work contracted by 3.1 per cent. A further decline of similar magnitude is projected for 2018.
“The medium term holds better prospects for renovations activity. Interest rates are set to remain lower for longer than previously expected. The ageing of Australia’s dwelling stock will also work in favour of renovations demand – the number of houses in the key renovations age bracket of 30-35 years is going to rise substantially until the early part of the 2020s decade.
“Even though current conditions in the renovations market are marking time, the HIA renovations market survey suggests that 40 per cent of firms still intend to take on extra employees over the next 12 months.” said Shane Garrett, HIA’s Senior Economist.
HIA forecasts that renovations activity will suffer a 3.1 per cent decline during 2018 but that a 3.2 per cent recovery will take hold during 2019. In 2020, the pace of expansion is set to accelerate to 5.7 per cent.
Further growth of 0.9 per cent in 2021 is expected to bring the value of the home renovations market to $35.57 billion – compared with $33.36 billion in 2017.