YBR Under Pressure

From Australian Broker.

In a candid interview with the Australian Financial Review column, Chanticleer, high-profile business guru and founder of financial firm Yellow Brick Road Mark Bouris has reportedly said he will fire himself this financial year if his company could not to make a profit.

He admitted his reputation was at stake if he could not build YBR into one of Australia’s largest independent financial firms, the AFR said.

Yellow-Brick-Road

However, a company spokesperson told Australian Broker that this comment was intended as a direct reflection of Bouris’ commitment to do everything he could to deliver.

“He hasn’t made a commitment to resign; he has indicated his commitment to work as hard as he possibly can to deliver to outcomes the market expects,” they said.

These statements come at a tumultuous time for YBR after the firm failed to bring in a profit for FY16.

In an interview with Chanticleer, owner of accounting firm Kelly+Partners, Brett Kelly, criticised YBR’s wealth management strategy, saying it will never work.

However, in a response to this article, Bouris told Australian Broker that this was an over-simplification and that YBR was not reliant on home loans as a single entry point.

“The person talking here has never once sat down with me to talk about our wealth management strategy,” Bouris said. “He miscast the strategy and doesn’t understand Australian consumers and their preferences when it comes to financial advice. Nor does he understand our value proposition.

“In reality, Yellow Brick Road is made up of representatives across the nation – several hundred of which are financial planners. Business is driven both through people seeking a mortgage and the ensuing opportunity to discuss holistic financial goals, and conversely through a customer requiring financial advice or a specific wealth management product. This multi-faceted approach allows the business to ensure relevance to a wide demographic of people at different stages of their financial journey.”

The company also responded to Kelly’s comments to Chanticleer that Australians with money for wealth management do not go to mortgage brokers.

“It may be true that traditional mortgage broking models don’t lend themselves easily to wealth management integration,” a spokesperson told Australian Broker. “This is not the case for us. Yellow Brick Road was set up from the get-go as an integrated total wealth business where mortgages are part of a broader financial services offering.”

The company’s corporate strategy was changed in an investor update released last week with new goals for 2017 and 2020. This included an improved focus on wealth management, increased levels of accountability and greater branch commerciality through a franchise model.

Currently with a $38b loan book, YBR hopes to increase this to $100 billion by 2020. The firm’s distribution network presently consists of 300 branches and 1,000 broker groups.

In 2017, the company hopes to drive out its wealth model by doubling the number of branches with specialist wealth advisors. Bouris also hopes to dramatically increase lending conversion by recruiting experienced brokers with business acumen.

“Our loan book is at $38b. For context, that’s a $43b asset on our balance sheet and a 28% increase on the prior comparable period,” a spokesperson said. “We currently write more than 4% of all home loans in Australia and our market share continues to improve year on year.”

Bank of Queensland FY16 Result Higher, But Stressed

BOQ announced a 1% uplift in Cash Earnings to $360 million for the 2016 financial year and increased Statutory Net Profit after Tax 6% to $338 million. Cost management saved the day, as net interest margins were squeezed, and lending growth slowed in the second half.

Lending grew 5% or $2.2 billion at 0.8x System, with gross loans and advances totalling $43.2 billion, though this growth was moderated in the second half with the strategic shift to preserve margin and target deposit acquisition through retail channels. Lending growth was entirely funded by the 8% growth in customer deposits, which resulted in a 2% uplift to the deposit to loan ratio to 68%.

Loan growth moderated significantly in the second half in light of heightened competition in key markets, the prudential cap on investment housing and the strategic shift to preserve margin over asset growth with an emphasis on deposit gathering. The strategy of targeting niche customer segments is delivering results with BOQ Specialist, BOQ Finance and niche segments in BOQ Commercial demonstrating solid growth momentum. The Group’s maturing broker presence combined with the new Virgin Money mortgage offering, and a more productive branch network, supported by the digitisation investment being progressively rolled out, should continue to deliver success from the multi-channel strategy.

The housing portfolio grew 5% over the year. Above system growth in the first half was offset by a slight contraction in the second half as the business focused on margin preservation and deposit gathering.

boq-fy16-hl-monThe broker channel continued to expand throughout the year, growing the accredited broker base and aiding BOQ’s geographic footprint with 84% of growth in this channel outside of Queensland.

boq-fy16-hl-mixGrowth through the broker channel moderated in the second half, with greater price sensitivity to new business acquisition pricing compared to other channels. Despite the slower volumes through the second half, the broker network still contributed 23% of total retail housing settlements during the year, albeit with settlement volumes reducing to 19% of total retail housing settlements in the second half.

The launch of the Virgin Money mortgage product in May provided another channel for BOQ to engage with a new customer demographic. The Virgin brand attracts a different customer, more affluent and likely to be metro-based with a strong propensity to engage through digital channels. Virgin Money has engaged with complementary broker groups PLAN and FAST with over 800 brokers now accredited. Virgin Money is about to launch with two additional large broker groups in the coming months. This could provide an uplift in performance in 2017.

Net Interest Margin contracted 3bps over the year to 1.94%, with the second half margin declining to 1.90%.

boq-fy16-nimThe highly competitive rates in lending and deposits across the industry have translated into reduced new business margins and increased levels of retention repricing of existing customers. Further, the confluence of market dynamics in wholesale funding and hedging costs, and the low yield environment, accelerated the margin decline in the second half.

Repricing actions during the year positively impacted NIM by 9 basis points. Front to back book repricing impacts and retention repricing activity had a 3 basis point contractionary impact on NIM in the half, similar to the impact in the prior half. The competition for funding intensified over the second half at the same time as the yield curve contracted, with a 4 basis point impact to NIM. Half of this impact was evident in retail liabilities as increased competition meant absolute term deposit rates did not fall in line with movements in the yield curve. The majority of this impact emerged in the last quarter. A further 2 basis points of impact occurred in wholesale funding costs. The low yield curve continues to impact returns on BOQ’s replicating portfolio, covering the investment profile of BOQ’s capital and low cost deposits totalling $4.8 billion at year end and causing a 4 basis point reduction in the half.

Operating expenses increased 4% on the prior year to $520 million.

boq-fy16-expThis included a $10 million uplift in amortisation expense as a number of strategic initiatives have been delivered, together with costs associated with the newly launched Virgin Money mortgage offering ($3 million). The benefit of the $15 million investment in organisational operating model changes announced to the ASX in February will be fully realised in line with stated targets, with further opportunities identified. This includes the cost of the operating model restructuring program of $15 million, with a similar level of one-off expenses in the prior year. The result also includes the uplift in intangible IT asset amortisation ($10 million), as the digitisation program and key strategic initiatives have been delivered.

Employee numbers have decreased 2% over the year as a result of the organisational operating model reshaping. Investment has been made to support the launch of the Virgin Money mortgage product and to support the channel diversification strategy. BOQ continued to optimise the branch network with a reduction in the branch footprint of 23 locations across the year to 211 branches, mainly reflecting consolidations and retirements.

Further improvement in asset quality was evident across the portfolio.

boq-fy16-impairmentsLoan impairment expense reduced by 9% to $67 million in 2016, or a reduction of 2bps to 16bps of gross loans and advances. The second half result was 14bps of gross loans and advances.

boq-fy16-povsBOQ achieved positive improvements in credit quality metrics across the portfolio compared to the prior year and continues to maintain higher provisioning coverage.

However, 30 day delinquencies rose in the critical home lending portfolio.

boq-fy16-hl-arrearsDuring the year BOQ continued to strengthen its balance sheet with strong capital generation enabling an increase in the Common Equity Tier 1 ratio (‘CET1’) to 9.0%, which positions it well for evolving regulatory capital requirements.

boq-fy16-cet1APRA requires ADIs to maintain a minimum 100% LCR. The LCR requires sufficient High Quality Liquid Assets to meet net cash outflows over a 30 day period, under a regulator defined liquidity stress scenario. BOQ manages its LCR on a daily basis with a buffer above the regulatory minimum in line with the BOQ prescribed risk appetite and management ranges. BOQ’s average LCR remained consistent over the August quarter at 129% (31 May 2016 quarter: 129%).

The Board has determined a final dividend of 38 cents per share fully franked, with the total dividends of 76 cents for the year, an increase of 3% on the 2015 financial year.

NAB completes sale of 80% of Life Insurance business

National Australia Bank Limited today announced completion of the sale of 80% of its life insurance business to Nippon Life Insurance Company (Nippon Life) for $2.4 billion.

RE-Jigsaw

As previously advised, NAB will retain ownership of 20%of the new life insurance business, and retain full ownership of the existing investments business which includes superannuation, platforms, advice and asset management.

The financial details of the sale will be finalised and reported with the FY16 Full Year Results on 27 October 2016. The key details relating to the transaction are materially consistent with those outlined in the FY15 Full Year Results ASX announcement and Investor Presentation and include:
• Following completion, the transaction is expected to deliver an increase of approximately 50 basis points to NAB’s CET1 capital ratio.
• Goodwill for the Wealth business is expected to reduce by approximately $1.6-$1.7 billion.
• The transaction has resulted in a loss on sale, which is expected to be approximately $1.2-$1.3 billion.
• NAB will retain the MLC brand, although it will be licensed for use by MLC Life Insurance for 10 years and will continue to be used (as is currently the case) in NAB’s superannuation, investments and advice business.

As part of the sale, NAB is also today commencing a long term partnership with Nippon Life which includes a 20 year distribution agreement to provide life insurance products through NAB’s owned and aligned distribution networks.

NAB Group CEO Andrew Thorburn: “From today we move forward with a simpler, clearer wealth model designed to serve our customers better – with continued ability to offer leading life insurance products and services. “We have also streamlined our superannuation business, merging five super funds into one to create Australia’s largest retail super fund. This simplifies our superannuation business, which NAB will retain, and over time makes it easier for customers to access various products and features within the fund as their needs change. NAB has also committed additional investment of at least $300 million over the next four years in our superannuation, platform, advice and asset management business. The combination of these initiatives will allow us to deliver a better and more aligned customer experience”.


ME Bank’s Mortgage Driven Profit

Industry super fund-owned bank ME has reported an underlying net profit after tax of $74.7 million for FY2016, a rise of 29% on the previous reporting period.

In FY16 ME settled over 16,000 new home loans totalling $4.6 billion. The Bank achieved home loan settlements of $2.6 billion in the second half of the year, which was a record for the Bank and ensures strong momentum heading into FY17.

me-bank-loansThe increase was driven largely by a 6% increase in total assets to $24.7 billion combined with stable net interest margin of 1.55%.

ME CEO, Jamie McPhee, said the Bank has maintained a strong growth path over the last four years with the NPAT increasing by an annual compound growth rate of 32% since 2012.

The Bank’s Member Benefits Program, which capitalises on its relationship with its industry super fund and union network, grew to a record participation of more than 100 industry super funds and unions, and is now generating over 10% of ME’s home loan settlements.

Cost-to-income ratio continued to fall, reducing 270 points to 65.8%. McPhee said there was more work to do but the ratio had continued on its downward trajectory since June 2009 (when the ratio was 84.5%), and will further improve due to productivity gains from the new technology.

Customer numbers grew 8% to 365,520 in FY16 and have increased by a compound annual growth rate of 10% since 2012, while customer deposits grew by 19% to $10.5 billion reflecting the ongoing diversification of ME’s funding profile.

Return on Equity increased by 80 basis points to 8.2%, continuing the trend towards the medium term target of 10%.

The new brand identity and external brand campaign activities across TV, outdoor, radio, online, social media and cinema advertising resulted in a 10 point increase in prompted awareness during the financial year to 50%.

CUA Reports Strong Loan Growth

Australia’s largest member-owned financial services provider CUA, posted an annual consolidated Net Profit after Tax (NPAT) of $51.66 million, up 5.8 per cent on last year’s result. The result was driven by member growth, up 7,935, taking total members to 439,713 across the banking and health insurance businesses, as well as strong growth in net interest income. Consolidated assets grew 7.6 per cent for the year to a record $12.90 billion. Their “Life rich banking” strategy appears to be working.

Capital adequacy and return on assets (ROA) remained steady against the previous corresponding period, while CUA’s return on equity (ROE) improved to 6.25 per cent.

Moody’s assigned a new A3 issuer rating to CUA in July 2015 and recently affirmed this rating in its review of operating conditions for the banking sector – this is the highest rating available to mutuals. This is a second rating for CUA, in addition to its BBB+ rating through S&P.

CUA’s banking business (or ADI) posted a full-year NPAT of $53.03 million, up 8.7 per cent on the previous year. The ADI results reflected strong performance across CUA’s core banking products and services, as well as commission and dividend income associated with CUA’s subsidiaries.

CUA recorded above-system home loan balance growth of 8.2 per cent amidst strong competition, soft economic conditions and regulatory restrictions. The continued high quality and low risk of CUA’s lending growth flowed through to the balance sheet, with only 6.5 per cent of CUA’s home loan portfolio having a Loan to Valuation Ratio (LVR) above 90 per cent.

While home loans remained the key driver of balance growth, the volume of personal loans issued during FY16 increased 14.7 per cent on the previous year to $186.1 million. Loans under management increased by $802.44 million, or 7.7 per cent, for the year.

Retail deposits up 7.1 per cent for the year to a record $8.33 billion.

The strong earnings result was driven by higher net interest income, up 10.3 per cent to $232.77 million and reflecting higher interest revenue from record lending in the previous year.

CUA Health posted a full-year NPAT of $1.08 million and continued to achieve strong growth in new customers. A total of 8,618 new policies were taken out during the year and 80,278 people were insured with CUA Health as at 30 June, up 9.7 per cent on the previous year. Whilst premium revenue rose 15.8 per cent to $135.76 million, the insurer returned almost 20 per cent more in benefits to policy-holders, at a total $122.96 million. Policy holders received around 89 cents in the dollar in benefits, higher than the industry average.

Credicorp Insurance posted a full-year NPAT of $1.15 million, an increase of $0.57 million on the previous year. This subsidiary now provides general insurance to 14,200 members.

CUA Chief Executive Officer Rob Goudswaard said “This result provides a strong platform to continue investing in communities, digital and member-facing initiatives to ensure CUA remains relevant to members’ changing needs, particularly during key life changes.”

“As a mutual, our members can be confident that all CUA investments are aimed at providing a better member experience and building stronger communities. That approach underpins our new Mutual Good community strategy, with increased funding to be directed to both new and existing CUA community initiatives.”

Under the Mutual Good strategy approved by the Board, CUA has started working towards increasing community investment to up to 3 per cent of NPBTC.

“We’ve also invested in an improved member experience this year, launching our first on-balance sheet CUA credit card, progressing the first phase of our streamlined loans application system and upgrades to mobile and online banking. We’re also making it easier for new members joining CUA to open a transaction account online in a few simple steps.”

Competition was another key focus for CUA and Mr Goudswaard said CUA would seek to continue working with government and industry groups to secure a competitive financial services landscape to benefit members and consumers more broadly. He hoped to see progress on implementing the recommendations from the Financial System Inquiry and the Senate Inquiry into co-operative, mutual and member-owned firms.

Mr Goudswaard said CUA’s focus on member-centric digital initiatives – including the new mobile banking app launched in August 2015 and a new CUA website in early 2016 – had driven increased use of CUA’s digital channels.

“We’re now exceeding 3 million logins and more than 1.5 million transactions using our digital channels each month – double the number of ATM transactions in a month. CUA now has more than 170,000 members using online or mobile banking and our mobile banking app has 15,500 more users than a year ago.”


Weighing up the risks behind the profits of Australia’s big four banks

From The Conversation.

The biggest Australian banks are fairing well in a year of increased pressure to reform from politicians, international events like the Britain’s exit from the European Union and more regulation from the Australian Prudential Regulation Authority (APRA).

A number of interrelated factors have contributed to the relatively strong performance of the Australian banks. For instance, the banks have limited exposure to the types of securities which led to massive losses for their counterparts in other countries. The banks also heavily rely on domestic loans, particularly the low risk household sector, so better lending standards and a proactive approach to prudential supervision by APRA may have contributed.

The Basel III regulatory requirements, brought in after the 2008 financial crisis, emphasise holding an increased amount of subordinated debt, as a measure of market discipline. However all the big four banks are holding less and less subordinated borrowings. More specifically, it declined by more than 50% from 2007 to 2014, according to our calculations.

APRA limits banks’ holdings of higher risk securitised assets, these are loans packaged into securities, to a maximum of 25% of the banks’ loan portfolio. These are high risk if not properly understood or defined, as happened with United States home loans, blamed for the start of the global financial crisis.

When Australian banks calculate bank capital requirements, they need to fully account for securitised assets. This is a rule from APRA that goes beyond international standards, to reflect the risk inherent in these products.

Inter-bank liquidity tightened significantly with all banks increasing their holdings of Exchange Settlements Accounts at the Reserve Bank, this a form of low risk liquidity. Australian banks have lower interbank deposits compared to their Europe and USA counterparts and are also heavily involved in long term wholesale funding and are required to hold more liquid assets including government debt to deal with liquidity. All of this makes Australian banks less risky in times of crisis because spillover effects from other banks are less likely.

The big four CC BY

There has been a significant increase in concentration in the Australian banking industry since the global financial crisis. For example with Westpac and the Commonwealth Bank of Australia taking over St. George Bank and Bank West, respectively.

Following mergers, the big four account for 88% of the Australian banking system assets. This reinforces the idea that the banks are “too big to fail”.

The banks have also moved to more fee generating activities, which increases risk, but to a lesser extent in Australian banks. Data shows between 1998 and 2014, on average, 1.2% greater interest income was generated relative to non-interest income for Australian banks, according to our analysis. However, there is also similar evidence for the top eight publicly-listed Canadian banks. They exhibit on an average, a 2.5% increase in net interest revenue relative to non-interest income over the same time period.

This reinforces that Australian and Canadian banks demonstrated extra ordinary resilience during the credit turmoil in the global financial crisis. The World Economic Forum in 2008 reported that Australia and Canada were among the top four safest banking systems in the world.

Large banks in Australia are active in international markets through direct ownership of foreign based banks and having offshore operations as a source of capital. Deregulation of banking in countries such as the USA, Canada, Australia and many developing countries has opened up new markets for foreign banks. Australian banks’ largest international exposure is to New Zealand, where all big four banks retain sizeable operations.

Although the growing interdependence among international economies and financial markets is certain to continue, the impact of Brexit on Australian banks remains minimal. It remains to be seen in the long-run how Australian banks will weather the international banking/economic developments.

As a last measure of the bank health, we can measure the domestic systemic risk with a methodology based on one used by the official Basel Committee on Banking Supervision. Based on July 2016 monthly data, the big four banks account for 80.38% of the systemic risk in the financial system and the riskiest, from highest to lowest, are the National Australia Bank, the Commonwealth Bank of Australia, Westpac and ANZ.

Reporting Season Shows Impact of Low-growth Era

According to The West Australian, there are two main lessons from the 2016 earnings season. First, the Australian economy is well and truly in a low-growth era and second the earnings-growth potential of some of the nation’s favourite blue-chip stocks is not invincible. The economy is now basically a zero-sum game and few companies have any pricing power left. For example, CBA chief executive Ian Narev admitted last week over the medium term the bank could only grow profits at roughly the same rate as GDP.

This is creating an inter-generational structural problem, because policy overly skewed to supporting the housing market is continuing the Australian ‘tradition’ of making the community debt slaves to the banks.

Stock-Pic

Solid dividend growth has proved not to be nearly as bankable as many income-dependent investors believed.

The market severely punished companies that missed forecasts or downgraded guidance but, by and large, they have ignored the steady lowering of the earnings bar over which companies are expected to jump.

No doubt most long-term shareholders have not yet lost faith in the profit potential of Wesfarmers, Commonwealth Bank and its three major bank rivals, the corporate behemoths that straddle the Australian continent like no others.

But it can no longer be argued they do not carry real downside profit risks as wage growth limps along at record lows, the workforce is increasingly “casualised” and world-beating household debt levels nudge 125 per cent of GDP, all of which pose severe risks to bad debts and weak spending trends.

This means the economy is now basically a zero-sum game and few companies have any pricing power left.

The management fad of cost-cutting to profit growth is perpetuating a negative feedback loop into deflating nominal GDP growth — growth not adjusted for inflation — that has begun to bite hard into revenue and profit potential in Australia and around the world.

One company’s cost saving is another’s lost revenue but there is little “fat” left to be cut after three years of corporate austerity to pay the juicy dividends investors have demanded.

CBA chief executive Ian Narev admitted last week over the medium term the bank could only grow profits at roughly the same rate as GDP, and that’s true for a Wesfarmers and many of the bigger companies too.

Nominal GDP roughly equates to the sum of the transactions upon which all companies can draw revenues and profits, and it has has sunk to a 60-year low of 2.1 per cent, a third to a quarter of levels prevailing prior to 2007.

That’s why even with a dominant national consumer footprint Wesfarmers’ Coles managed just 4.2 per cent revenue growth as rival Woolworths headed headed into a tailspin, reporting a 1.2 per cent drop in revenue last year. The average of their sales growth equates to nominal GDP growth.

CBA once demanded a 20 per cent price-earnings valuation premium to its rivals but the country’s biggest lender grew earnings just 2 per cent as the banking regulator began to rein in east-coast speculators driving house-price growth at multiples to income growth.

Overall, with just a handful of companies still to report, earnings have dropped about 8.5 per cent, dragged down by an average 48 per cent slump in resource profits — 15 per cent down for miners and a whopping 60 per cent for energy stocks.

Along with banks, industrial earnings have slipped too, down about 3 per cent on average according to Deutsche Bank analyst Tim Baker.

“Momentum is still strong for those with US dollar exposure, and for many domestic cyclicals,” he said.

“But falling profits in food retail and non-bank financials have hurt, as has ongoing softness in resource-exposed earnings.”

But analysts have tried to remain upbeat, supporting high valuations and slimmer dividend yields for now.

UBS strategist David Cassidy said, “defying the naysayers”, the 2017 outlook for S&P-ASX 200 stocks was a positive 6 per cent for the average non-resource stock.

Forecasts are one thing, however, and meeting them another, something all too many company executives and shareholders are learning the hard way after being mesmerised by lofty share prices and fooled by headline “real” GDP and unemployment data.

Over the past six years every rate cut has been forecast to be the bottom by growth optimists and yet nominal GDP has continued to decline deeper into recession levels with little room left to cut further.

“Our nominal growth today is lower than our real growth, by a full percentage point,” Treasurer Scott Morrison said this week.

“This is an uncommon predicament and a core challenge in working to bring the budget back to balance.”

Outgoing Reserve Bank governor Glenn Stevens pointed to the problem two weeks ago when he said “someone, somewhere” needed to be willing to borrow money and spend it.

Strategists at Patersons explained why this was difficult.

“Policy overly skewed to supporting the housing market is continuing the Australian ‘tradition’ of making the community debt slaves to the banks and is a huge disservice to the next generation who also need to afford to buy shelter, along with things like a university education that used to be supplied by the government through the taxation system in a former world where promoting higher community education was seen as economically beneficial and worth supporting,” they said.

“There is too much passive investment in the Australian economy, passive, idle cash sitting in assets like housing and stocks, and not enough funds pushing productivity, technological initiatives and creating real tangible benefits for the economy and wider community.”

Yellow Brick Road Announces FY16 Loss

Wealth management company Yellow Brick Road Holdings Ltd has announced a full year loss for FY16 of $9.5m compared with a loss of $2.5m in the prior year. This despite an increase in revenue for the year 31.4% to $217.9m. No dividends were recommended or paid in the financial year. They did not meet their revenue targets and as a result, a period of consolidation and cost cutting is now the order of the day.

Underlying earnings before interest expense, tax, depreciation and amortisation (‘EBITDA’) and excluding impairment charges and other non-operating expenses for the consolidated entity was a loss of $3,901,000 (2015: profit of $1,276,000).

During the year they made a number of acquisitions, and recently announced a significant restructure.

YBR-PathThey aspire to become Australia’s leading non-bank financial services company by 2020 through four core activities.

  1. Central is lending activity that provides scale. Group settlements grew by $3.5 billion in FY16, up 28 per cent and with over $37 billion in loans
    under management to date. They are pursuing a $100 billion loan book under management which equates to an approximate market share of 5 per cent. With residential lending softening, the group has invested further in commercial lending achieving 32 per cent growth vs PCP. Additionally in November they entered the small business lending market via a partnership with new SME lending platform Valiant Finance.
  2. This lending business provides a foundation and opportunity for warm introductions for wealth management services which provide margin. Wealth management revenue is up 11 per cent against FY15, with insurance premiums under management up 25 per cent and Yellow Brick Road Super funds under management up 19 per cent on the prior comparable period. Their suite of wealth offerings was rounded out in FY16 by the launch of critical gateway and adjacent products including My YBR Account (OneVue) and eight separately managed accounts, Loan Protect (Metlife), and Protected Equities Fund (Smarter Money Investment and NWQ). They are targeting wealth penetration of 30 per cent of their client base.
  3. Using geographic modelling, they are increasing their distribution network of local business owners in all communities across Australia. Ongoing recruitment initiatives have netted 354 additional qualified representatives in the Vow Financial and Yellow Brick Road networks in FY16. New quality benchmarks and onboarding procedures are helping ensure higher productivity of these new members with a particular focus on the first two years of operation. The group now has 1500 qualified members operating in all markets across Australia. The FY17 focus is on maintaining momentum in broker recruitment whilst creating multiple avenues for access to financial planners. The target is 300 branded branches and 1000 broker groups.
  4. Strategic partnerships that leverage scale are an important source of product income. By 2020, they intend to see 10 per cent of income through partnerships, which can be achieve without the complexity or cost of vertical integration.

They say they have faced a number of headwinds in the year.

  • Lower rates have increased competition and the addition of more players in the marketplace has seen an increase in refinancing behaviour. Customers are more aware of their ability to get a better rate and the landscape is more competitive than ever. This is of benefit to the younger Yellow Brick Road book but does place some challenges on our more established Vow brokers.
  • An increase in the cost of funding has put pressure on margins across the
    industry. As lenders respond to regulatory pressure, borrowers face the hurdle of greater scrutiny on household expenditure measurement (HEM) and income verification, which plays into lower approval rates and impacts market size.
  • The outcome of the current broker remuneration review will likely further shape the mortgage industry in FY17. For planners, new legislation that mandates a biennial obligation to seek client permission to continue servicing and charging will require significant changes to the servicing model of most.
  • Australia’s investment lending landscape changed with tougher rules for offshore purchasers and restrictions to lenders’ investor ratios. This has resulted in a restricted environment.

“The completion of a period of heavy investment in brand and distribution build has been met with tough lending conditions and as a result our revenue targets have not been reached.  As is appropriate, when macro factors shift in this way, we adapt by shifting to a period of consolidation. This means some tough cost cutting and maintaining strict spending
discipline, while bedding down the recent acquisitions. It also means delivering our technology innovations and leveraging our brand equity”.

ASX FY16 Result Strong, Blockchain Experiments Progress

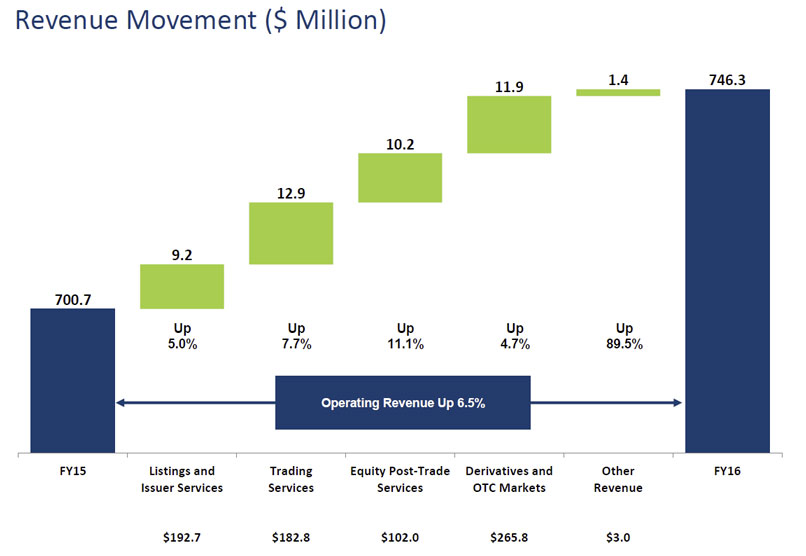
The ASX released their results for FY16, with revenue of $746.3m, up 6.5%, and Net Profit of $426.2m, up 5.7%.

ASX-FY16Mr Rick Holliday-Smith, ASX Chairman, said: “ASX delivered strong financial results in FY16, with growth in all key business areas, supported by higher market activity. This was driven by a rise in secondary capital raisings within the financial sector and increased trading activity due to heightened volatility, particularly in the second half of the year, culminating in the surprise of Brexit. Revenue was up 6.5% to $746.3 million and profit after tax rose 5.7% to $426.2 million.

“ASX continued to invest in the infrastructure critical to Australia’s financial markets throughout the period. This included successfully introducing T+2 settlement, significant progress on the delivery of a new futures trading platform, and the assessment of distributed ledger technology or ‘blockchain’ as a potential post-trade solution for the equity market. These initiatives aim to improve market efficiency and reduce risk and complexity for investors, intermediaries and other market stakeholders. They help keep Australia at the forefront globally of innovative market developments”.

ComputerWorld reported on the Blockchain initiatives.

ASX has completed the first phase of work on a potential blockchain-based replacement for its CHESS system, which providers clearing and settlement services.

The operator of the Australian Securities Exchange announced earlier this year that taken a stake in US company Digital Asset Holdings with an eye to potentially developing technology inspired by the distributed ledger that underpins the Bitcoin cryptocurrency.

“We’ve completed our initial analysis of the technology and have begun work on the next stage of this journey,” ASX CEO Dominic Stevens said today during a full year results presentation.

“We’ve made good progress” in exploring the use of distributed ledger technology over the past year, said deputy CEO Peter Hiom.

“The initial phase of development has been completed,” Hiom said. “We’ve increased our investment in Digital Asset Holdings and we have commenced the next development phase. Over the next 18 months ASX and Digital Asset Holdings will build an industrial strength platform that could be used as the basis to replace CHESS over the longer term.

“ASX is now commencing engagement with customers and stakeholders on the requirements for that platform, with a final decision by ASX on whether to use the technology being made later in FY18.”

Hiom said that there were some key differences between the “permissioned disturbed ledger technology” ASX is experimenting with and the public blockchains employed by cryptocurrencies.

“The main difference I want to highlight is public blockchains are operated largely in unregulated marketplaces where anyone can join and access those markets anonymously via a public, or unpermissioned, network,” he said.

“Network security is public to scrutiny and if compromised it could allow someone to anonymously and unilaterally transfer cryptocurrency on the public network. This is clearly unacceptable in the types of highly regulated markets within which the ASX operates.”

“Not withstanding this, the underlying blockchain technology has inspired new applications that can be tailored for use in highly regulated markets such as those operated by ASX,” he added. “It is the database architecture, or distributed ledger technology, which interests us.”

He said that ASX didn’t seek to change the existing regulatory framework it operates in.

“What we do change is the way that data is authenticated, authorised, accessed and stored,” Hiom said. “It is this that creates the single source of truth that could remove complexity and deliver significant benefits to the industry.”

The deputy CEO said that there had so far been no “red flags” around scalability or performance.
Read more: Blockchain is useful for a lot more than just Bitcoin

ASX reported growth in its operating expenses for FY16 of 6.5 per cent to $170.6 million, which the company attributed in part to investment in its technology transformation program.

“We’re in the midst of a major transformation,” Stevens said. “Specifically we’re replacing or upgrading our trading, monitoring, risk and clearing systems, exploring post-trade innovation through the use of distributed ledger technology, [and] improving connectivity for our customers, here and abroad.”

AMP Underlying Profit Down 10% 1H16

AMP released their 1H16 results today. They reported a net profit of $523m for the half, up 3% when compared with 1H15. However, underlying profit, (after one-off costs, adjustment for some investment market volatility and accounting mismatches) were $513m compared with $570m for 1H15, down 10% year on year. The results were impacted by higher claims in Australian wealth protection and volatile investment market conditions.

AMP-1H16Australian wealth management net cashflows were $582m, down from $1,152 in 1H15. Both retail and corporate super platforms were subdued because of weaker investor confidence relating to proposed superannuation changes and market volatility. AMP Capital external net cash flows were $153m, down from $3,025 in 1H15.

Overall revenues from ordinary activities were $6,096m compared with $8,624 30 Jun 2015, down 29%.

The cost to income ratio increased 2.4% compared with 1H15 to 45.5%. Costs were up $6m to $663m, compared with 1H15.

AMP-1H16--costsUnderlying return on equity reduced 1.6% to 11.9% compared with 1H15.

They declared an interim dividend of 14 cents per share, in line with 2015, a payout ratio of 81% of underlying profit.

Equity and reserves of the AMP Group increased to $8.6bn, from $8.5bn in Dec 15.

AMP holds Level 3 capital above the minimum requirements of $1,917m, but down from $2,542m 31 Dec 15. The decrease is mainly due to the redemption of $60m subordinated notes.

Looking at the segmentals, AMP has six key business areas, Australian Wealth Management, AMP Capital, Australian Wealth Protection, AMP Bank, New Zealand Financial Services and Australian Mature.

AMP Table-2016Australian wealth management earnings were $195m, down 6%, reflecting challenging market conditions.

Australian wealth protection earnings were $47m, down from $99m in 1H15, reflecting poor claims experience across income protection, lump sum and group insurance.

AMP Capital lifted earnings 15% thanks to a growth in fee income.

AMP Bank increased earnings by 18% to $59m with an expanded NIM at 1.71%, compared with 1.53% 1H15. Total loans grew by $816m to $16b, up 5.9%. Within that, the residential mortgage book grew $806m, to $15.4b, up 5.5%. Owner occupied loans made up 73% of the portfolio. Investment lending recommenced in November 2015. More new loans are via mortgage brokers, and as a result new loans from their advisor channel fell to 19%, down from 24%. Mortgage arrears (90days+) were 0.51%, and impairments 0.04%. Deposits grew 11.4% and deposit to loan ratio was 67%. The CET1 ratio was 7.9% and the liquidity coverage ratio was 126%.

New Zealand earnings were up 2% reflecting higher profit margins. Net of tax relief reductions, it would have been 19%

North Assets Under Management grew 26% to $23.4b

The group was also helped by the ongoing efficiency program which overall will contribute $200m by end of 2016.

AMP-1H16--effic