We have completed our October 2018 mortgage stress analysis and today we discuss the results.
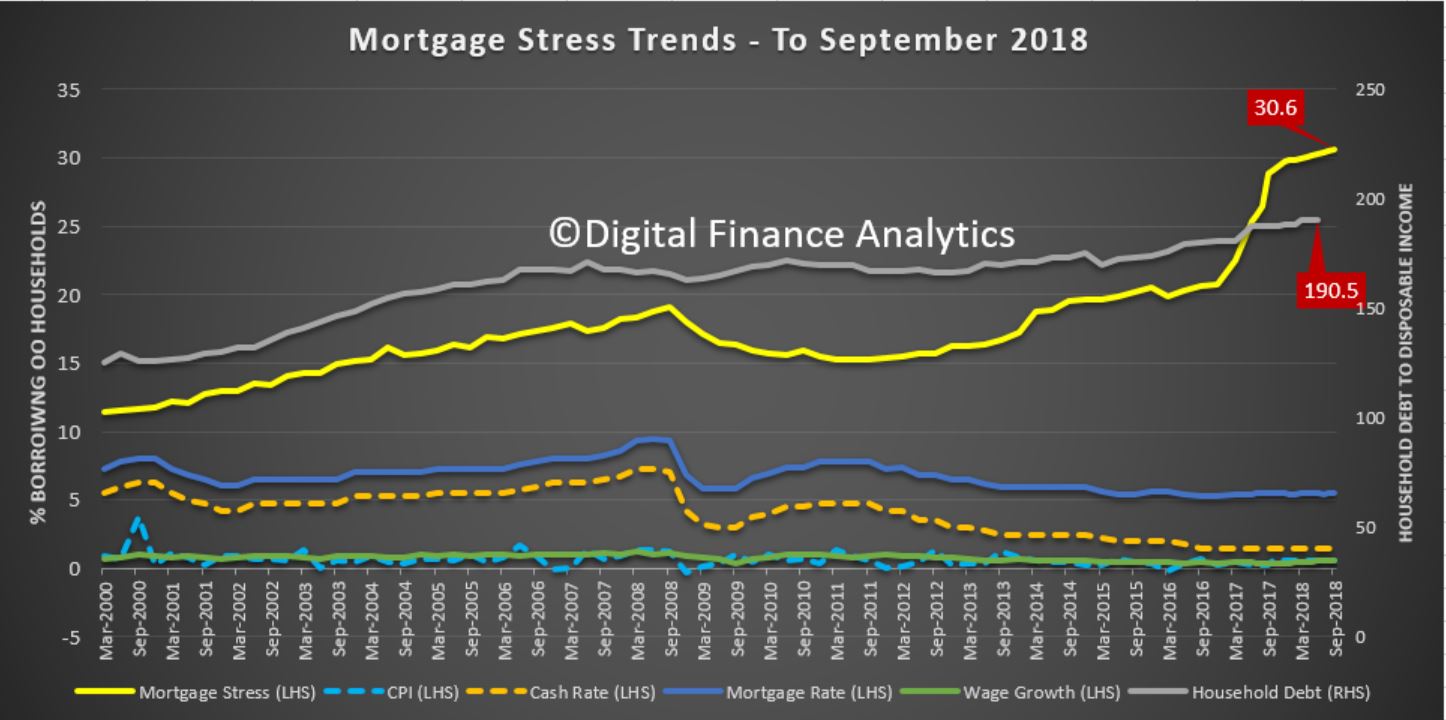
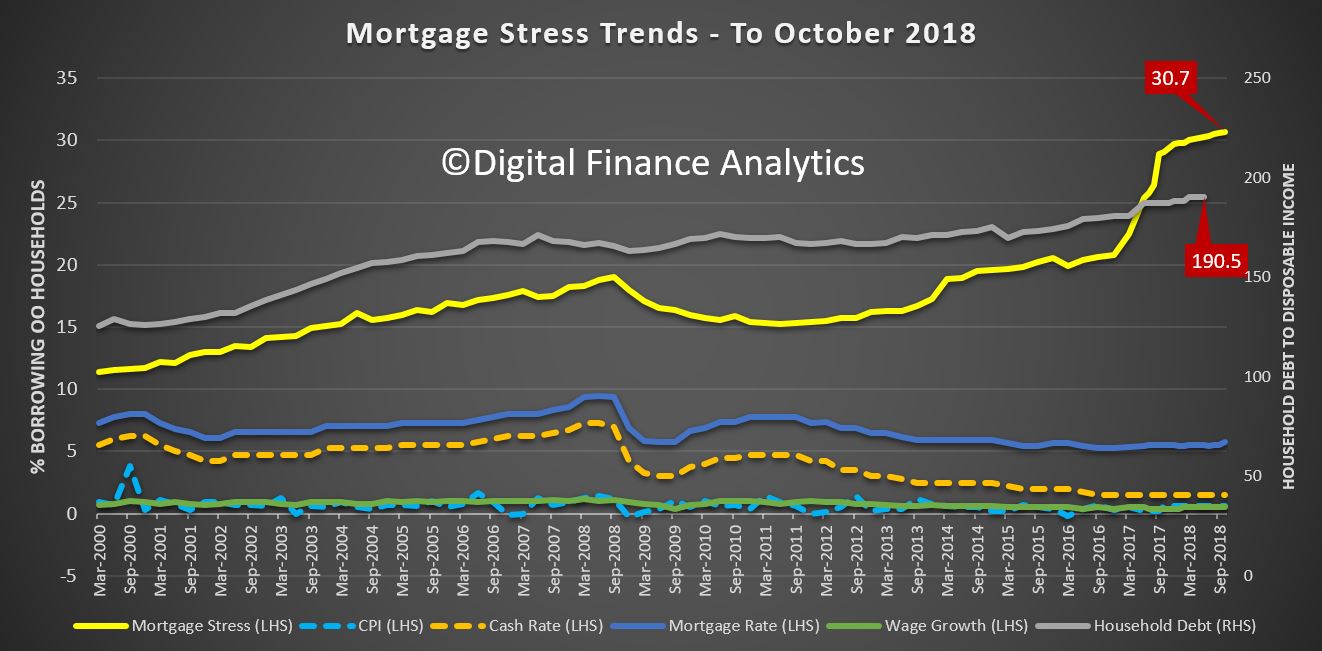
The latest RBA data on household debt to income to June reached a new high of 190.5. This high debt level helps to explain the fact that mortgage stress continues to rise. Having crossed the 1 million Rubicon last month, across Australia, more than 1,008,000 households are estimated to be now in mortgage stress (last month 1,003,000). This equates to 30.7% of owner occupied borrowing households.
In addition, more than 22,000 of these are in severe stress. We estimate that more than 61,000 households risk 30-day default in the next 12 months. We continue to see the impact of flat wages growth, rising living costs and higher real mortgage rates. Bank losses are likely to rise a little ahead.
Our analysis uses the DFA core market model which combines information from our 52,000 household surveys, public data from the RBA, ABS and APRA; and private data from lenders and aggregators. The data is current to the end of October 2018. We analyse household cash flow based on real incomes, outgoings and mortgage repayments, rather than using an arbitrary 30% of income.
Households are defined as “stressed” when net income (or cash flow) does not cover ongoing costs. They may or may not have access to other available assets, and some have paid ahead, but households in mild stress have little leeway in their cash flows, whereas those in severe stress are unable to meet repayments from current income. In both cases, households manage this deficit by cutting back on spending, putting more on credit cards and seeking to refinance, restructure or sell their home. Those in severe stress are more likely to be seeking hardship assistance and are often forced to sell.
This rise in stress, which has continued for the past 6 years, should be of no surprise at all. “Continued rises in living costs – notably child care, school fees and fuel – whilst real incomes continue to fall and underemployment is causing significant pain. Many are dipping into savings to support their finances.”
Indeed, the fact that significant numbers of households have had their potential borrowing power crimped by lending standards belatedly being tightened, and are therefore mortgage prisoners, is significant. More than 40% of those seeking to refinance are now having difficulty. This is strongly aligned to those who are registering as stressed. These are households urgently trying to reduce their monthly outgoings.
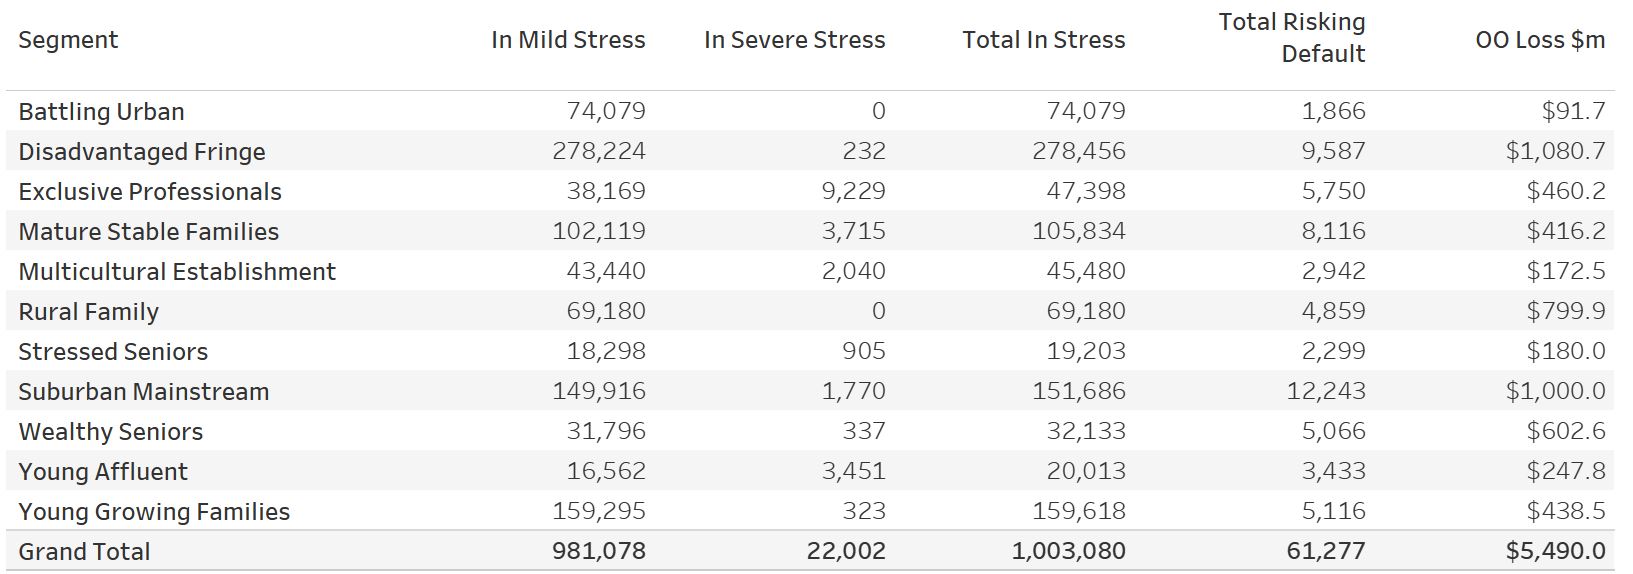
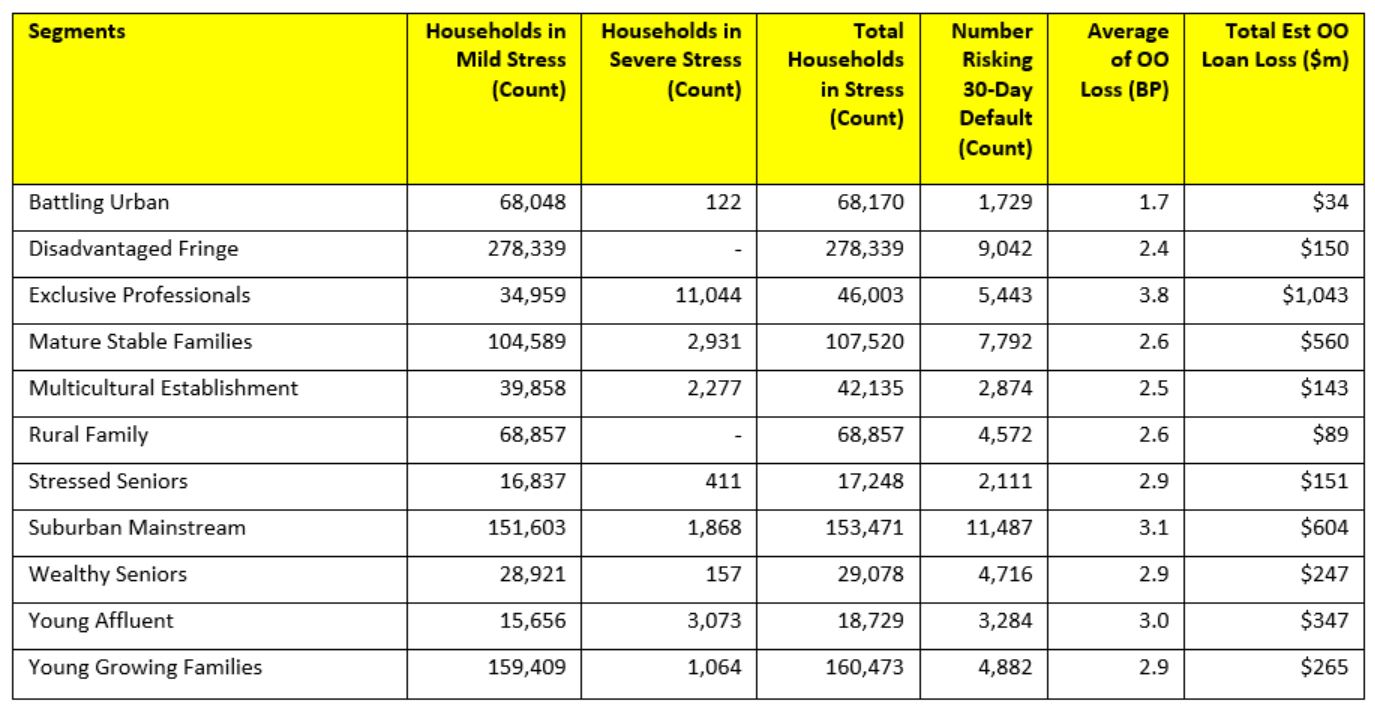
Probability of default extends our mortgage stress analysis by overlaying economic indicators such as employment, future wage growth and cpi changes. Our Core Market Model also examines the potential of portfolio risk of loss in basis point and value terms. Losses are likely to be higher among more affluent households, contrary to the popular belief that affluent households are well protected. This is shown in the segment analysis, with some more wealthy households up against it.
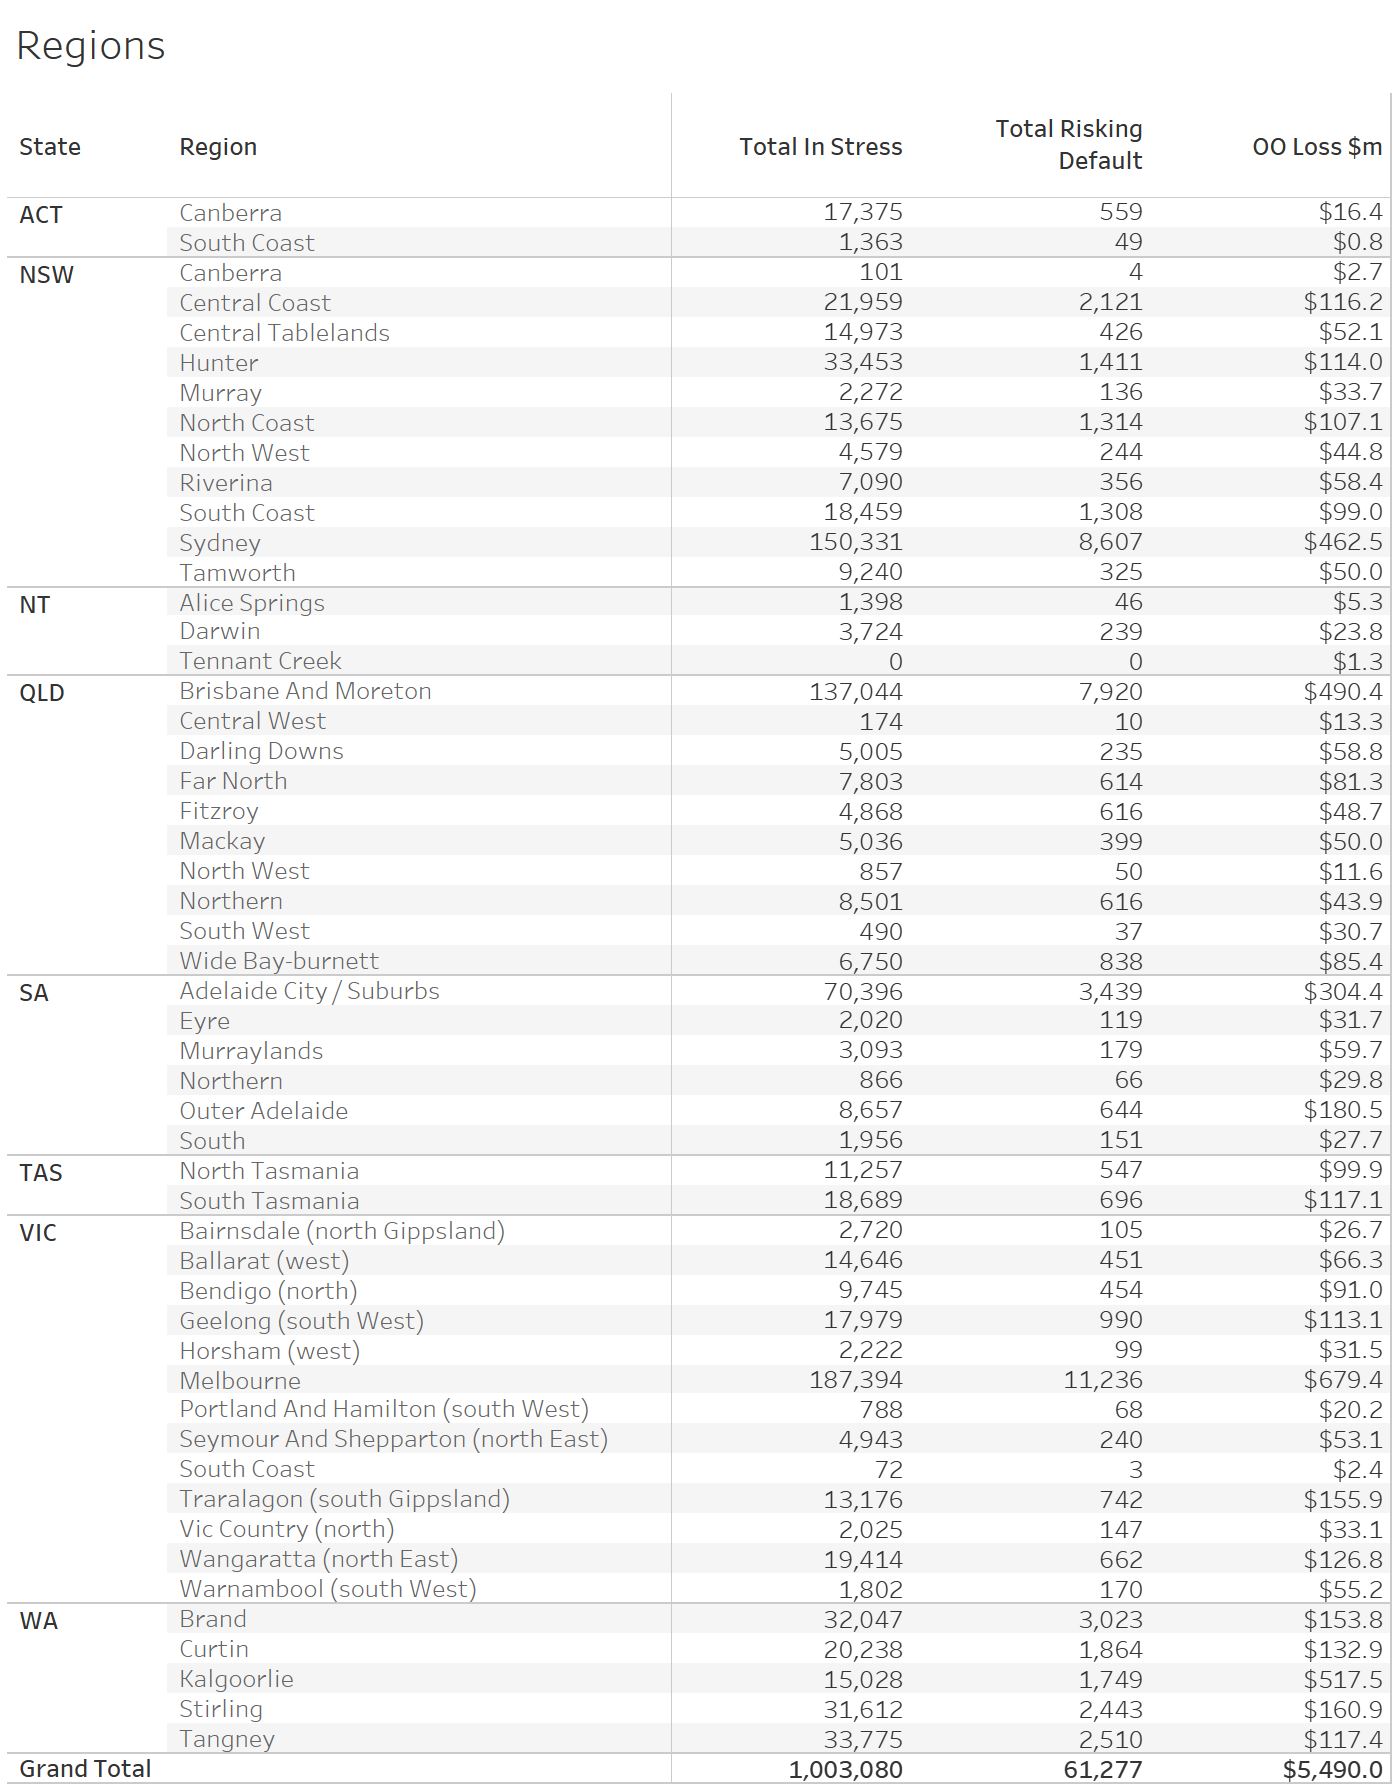
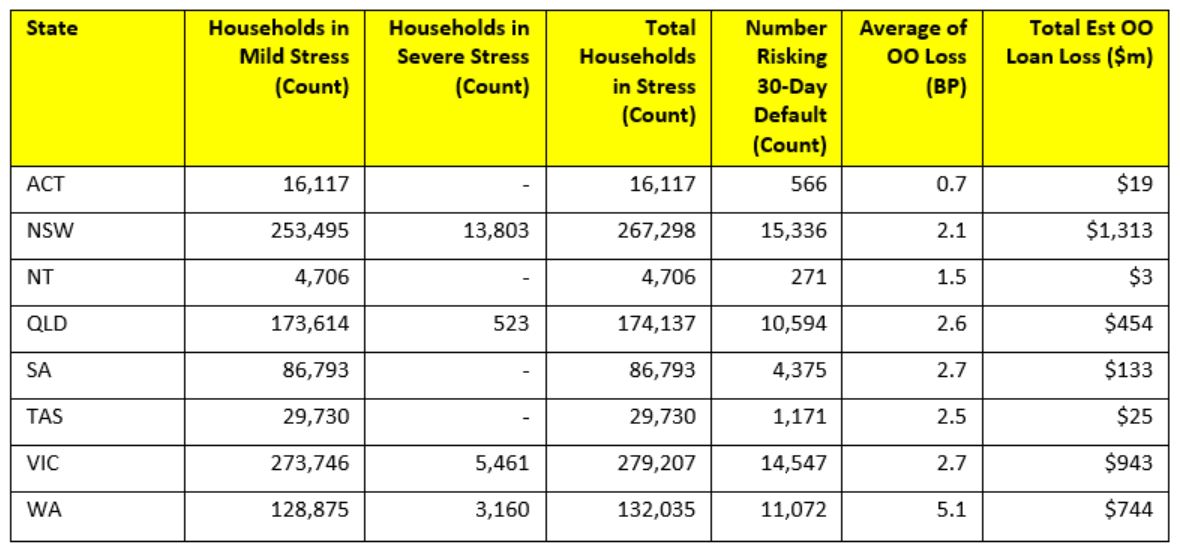
Regional analysis shows that NSW has 272,536 households in stress (276,132 last month), VIC 281,922 (276,926 last month), QLD 178,015 (176,528 last month) and WA has 132,827 (132,700 last month). The probability of default over the next 12 months rose, with around 11,630 in WA, around 11,300 in QLD, 15,200 in VIC and 16,200 in NSW. The largest financial losses relating to bank write-offs reside in NSW ($1.1 billion) from Owner Occupied borrowers) and VIC ($1.74 billion) from Owner Occupied Borrowers, though losses are likely to be highest in WA at 3.6 basis points, which equates to $1,096 million from Owner Occupied borrowers.
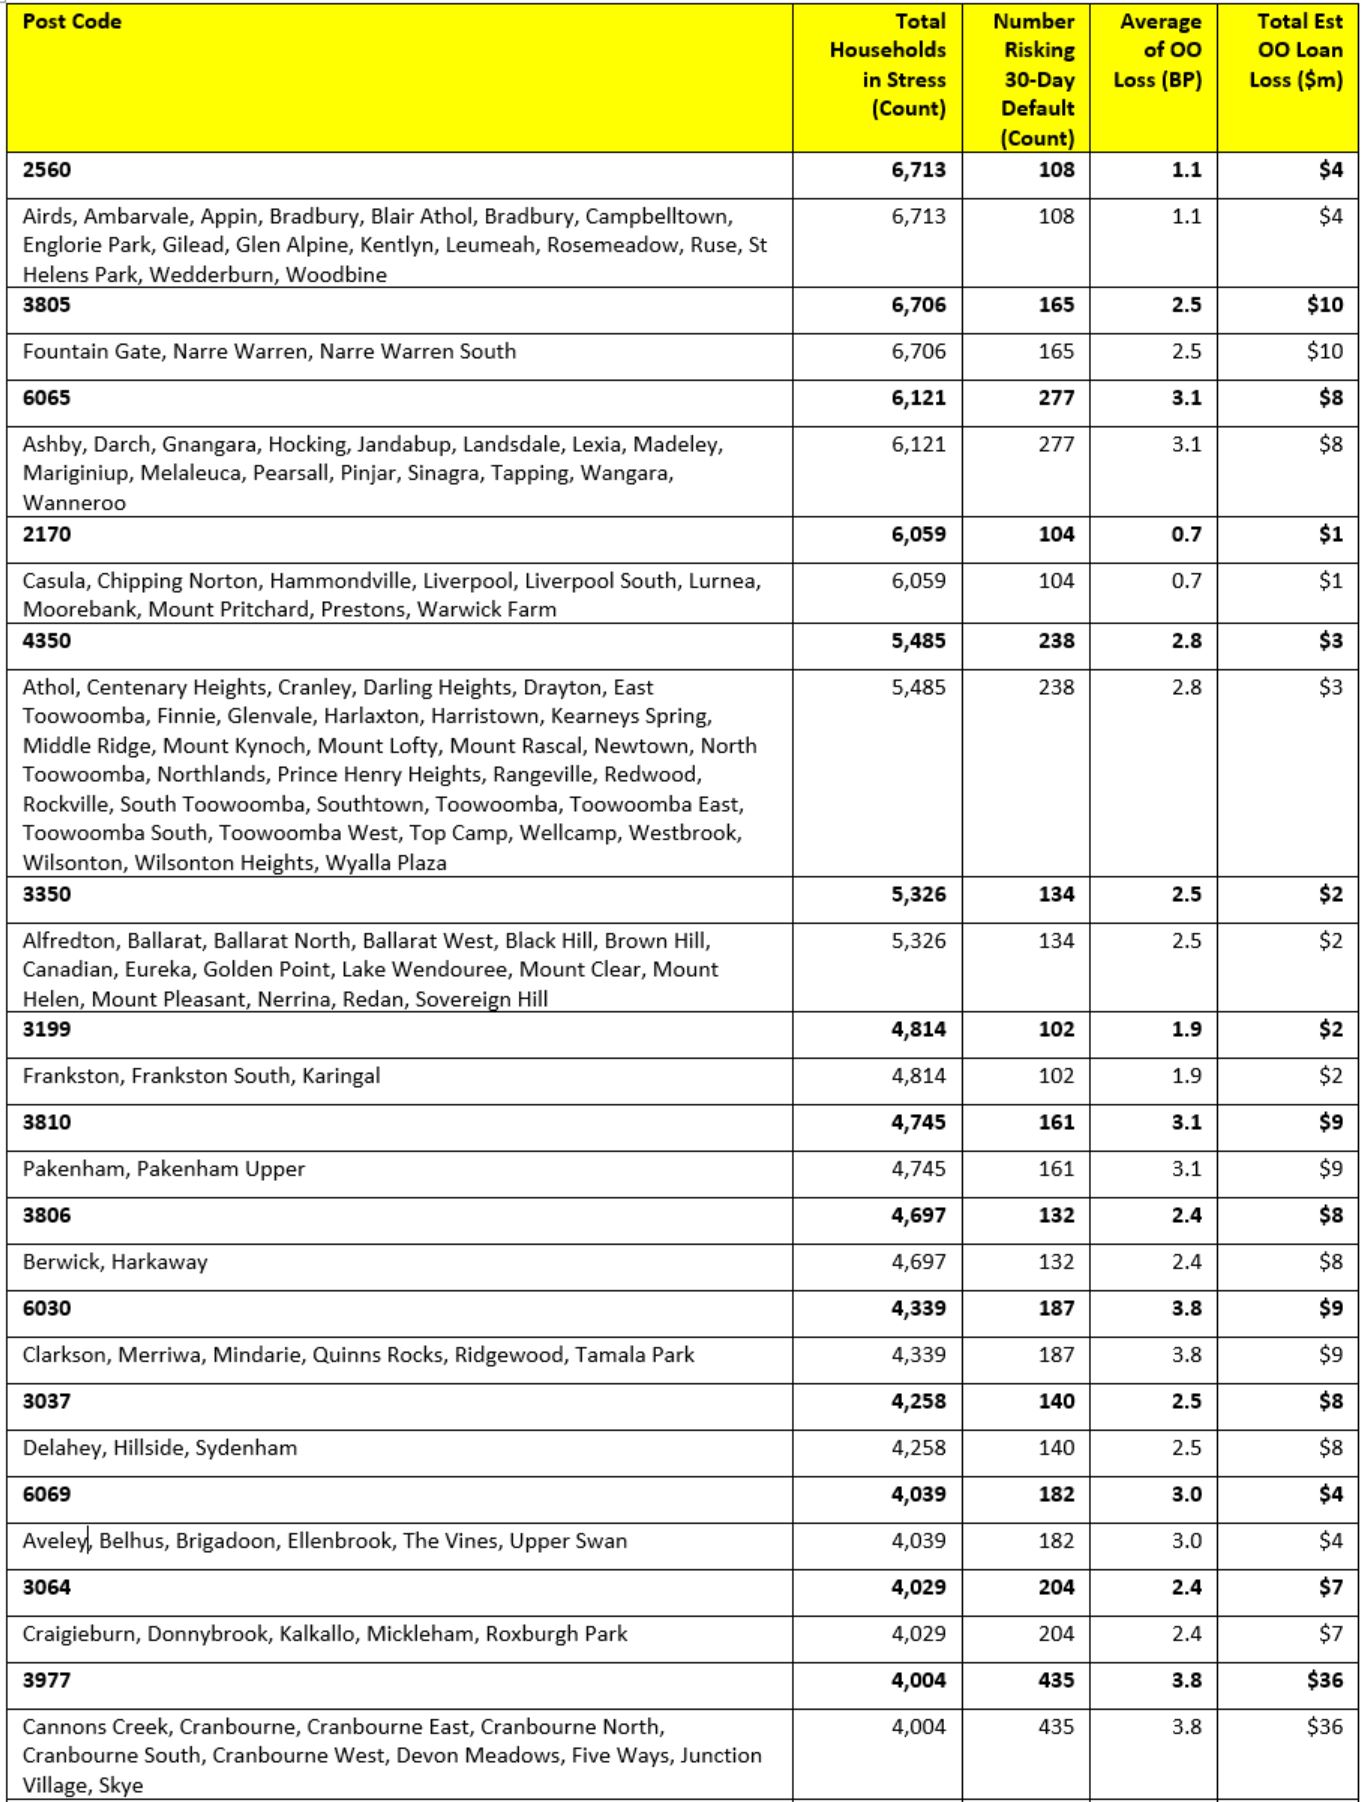
Turning to the post codes with the largest counts of households in stress, fifth was Melbourne suburb Berwick and Harkaway, 3806, with 5,267 households in stress and 143 risking default.
In fourth place is Toowoomba and the surrounding area, in Queensland, 4350, with 6,437 households in stress and 256 risking default.
Next in third place is Campbelltown in NSW, 2560, with 6,781 households in stress and 110 risking default.
In second place is Tapping and the surrounding areas in WA, 6065 with 7,409 in stress and 298 risking default
And in first place, the post code with the largest number of households in mortgage stress this month is the area around Chipping Norton and Liverpool, 2170, with 7,732 households in stress and 116 risking default.
As always, it’s worth saying that given flat incomes, and rising costs, and some mortgage rate rises, the pressure will continue, and falling home prices will make things worse. Many people do not keep a cash flow, so they do not know their financial position – drawing one up is the first step and ASIC has some excellent advice on their MoneySmart website. And the other point to make is, if you are in financial distress, you should talk to your lender, they do have an obligation to help in cases of hardship. The worst strategy is simply to ignore the issue and hope it will go away. But in my experience, this is unlikely.
We will update the data again next month.
You can request our media release. Note this will NOT automatically send you our research updates, for that register here.
[contact-form to=’mnorth@digitalfinanceanalytics.com’ subject=’Request The October 2018 Stress Release’][contact-field label=’Name’ type=’name’ required=’1’/][contact-field label=’Email’ type=’email’ required=’1’/][contact-field label=’Email Me The October 2018 Media Release’ type=’radio’ required=’1′ options=’Yes Please’/][contact-field label=”Comment If You Like” type=”textarea”/][/contact-form]
Note that the detailed results from our surveys and analysis are made available to our paying clients.
More mortgage holders have little or no equity in their homes compared to a year ago, putting them at risk if they have to sell.
Research from Roy Morgan says the current figure of 8.9% has risen from 8% twelve months ago and could continue to rise if house prices keep falling.
The figures are based on the fact that the value of their home is only equal to or less than the amount they still owe.
Roy Morgan’s Single Source Survey is based on more than 50,000 Australians each year, including more than 10,000 owner occupier home owners.
Its findings showed that around 386,000 home owners across the country had little or no equity in their homes.
The research group establishes the level of equity to assess households’ financial positions and potential risk.
Roy Morgan said, on average, the value of properties in Australia subject to a mortgage is well in excess of the amount outstanding but there are problem areas.
The state at highest risk is WA where 16.5% (90,000) of mortgage customers’ have no real equity in their home. This is an increase of 2.5% in the last 12 months.
New South Wales is the state with the lowest proportion of home owners who have little or no equity in their homes, with only 6.1%.
Victoria is the second best performer, followed by Tasmania, Queensland, and then South Australia.
Roy Morgan said the strong performance in NSW and Victoria were down to the rapid rise in Sydney and Melbourne prices, which outpaced the amount owing on mortgages.
Norman Morris, industry communications director, Roy Morgan said, “Other potential contributing factors to this increase in mortgage stress include borrowers maintaining debt for other purposes rather than paying off their loan and the use of interest only loans.
“If home-loan rates rise, the problem would be likely to worsen as repayments would increase and house prices decline, with the potential to lower equity even further.
“The mining boom and associated increase in housing demand and house prices in WA, followed by the slowdown in the mining sector in WA, and a decrease in house prices continues to see it having the highest proportion of mortgage holders faced with little or no equity in their home.
“If house prices decline further in WA and unemployment increases then more mortgage holders will be facing a tough situation.
“Borrowers in lower-value homes continue to be among the most likely to be faced with the problem of little or no equity in their homes. Higher-value properties with a mortgage appear to be facing a much less risky position because they are likely to have had their loan longer and may have had a far larger deposit, particularly if they have traded up.”
Welcome to the Property Imperative weekly to 13th October 2018, our digest of the latest finance and property news with a distinctively Australian flavour.
This week saw major ructions on the financial markets, which may be just a short-term issue, or a signal of more disruption ahead. And locally, the latest data reveals a slowing of lending to first time buyers and owner occupied borrowers, suggesting more home price weakness ahead. So let’s get stuck in.
Watch the video, listen to the podcast, or read the transcript.
And by the way you value the content we produce please do consider joining our Patreon programme, where you can support our ability to continue to make great content.
Let’s look at property first.
The IMF’s latest Global Financial Stability Report (FSR) says Australia is one of a number of advanced economies where rising home prices are a risk. “household leverage stands out as a key area of concern, with the ratio of household debt to GDP on an upward trajectory in a number of countries, especially those that have experienced increases in house prices (notably, Australia, Canada, and the Nordic countries). Housing market valuations are relatively high in several advanced economies. Valuations based on the price-to-income and price-to-rent ratios, as well as mortgage costs, have been on the upswing over the past six years across major advanced economies, with valuations relatively high in Australia, Canada, and the Nordic countries.
And they also warn that the effect of monetary policy tightening (lifting interest rates to more normal levels) – could reveal financial vulnerabilities. Indeed, it’s worth looking at expected central bank policy rates globally. Bloomberg has mapped the relative likelihood of increases and decreases across a number of major economies, and most advanced economies are on their way up. Worth thinking about when we look at the long term home prices trends across the globe. Guess where Australia sits? High debt, in a rising interest rate environment is not a good look, so expect more stress in the system.
Yet the latest RBA Financial Stability review, out last Friday seems, well, in a different world. They go out of their way to downplay the risks in the system, and claim that households are doing just fine, based on analysis driven by the rather old HILDA data – again.
But back in the real world, Corelogic’s auction results for last week returned an aggregated clearance rate of 49.5% an improvement on the week prior at 45.8 per cent of homes sold, which was the lowest weighted average result since 42 per cent in June 2012. There was a significantly higher volume of auctions with 1,817 held, rising from the 895 over the week prior.
Melbourne’s final clearance rate fell last week, to 51.8 per cent the lowest seen since 50.6 per cent in December 2012. There were 904 homes taken to auction across the city. Compared to one year ago, the Melbourne auction market was performing very differently, with both volumes and clearance rates significantly higher over the same week (1,119 auctions, 70.3 per cent).
Sydney’s final auction clearance rate increased last week, with 46.1 per cent of the 611 auctions held clearing, up from the 43.8 per cent the week prior when a similar volume of auctions was held. One year ago, Sydney’s clearance rate was 61.3 per cent across 818 auctions.
Across the smaller auction markets, Canberra returned the strongest final clearance rate of 64.6 per cent last week, followed by Adelaide where 62.3 per cent of homes sold, while only 11.1 per cent of Perth homes sold last week.
Looking at the non-capital city regions, the Geelong region was the most successful in terms of clearance rates with 48.5 per cent of the 41 auctions recording a successful result.
This week, CoreLogic is tracking 1,725 auctions across the combined capital cities, which is slightly lower than last week. Compared to one year ago, volumes are down over 30 per cent (2,525).
They also highlighted the growing settlement risk relating to off the plan high-rise sales. Prospective buyers may sign a contract to purchase from the plan, but when the unit is ready – perhaps a year or two later, a bank mortgage valuation may not cover the purchase price. Meaning the buyer may be unable to complete the transaction. CoreLogic says that in Sydney, 30% of off-the-plan unit valuations were lower than the contract price at the time of settlement in September, double the percentage from a year ago. In Melbourne, 28% of off-the-plan unit settlements received a valuation lower than the contract price. In Brisbane, where unit values remain 10.5% below their 2008 peak, the proportion was substantially higher, at 48%. And they also argue that loss making resales are rising, especially in the unit sector, although it does vary by location.
The latest housing finance figures from the ABS showed that lending flows for owner occupied buyers appear to be following the lead from the investment sector. Both were down. This is consistent with our household surveys. Looking at the original first time buyer data, the number of new loans fell from 9,614 in July to 9,534 in August, a fall by 80, or 0.8%. As a proportion of all loans written in the month, the share by first time buyers fell from 18% to 17.8%.
Looking at the trend lending flows, the only segment of the market which was higher was a small rise in refinanced owner occupied loans. These existing loans accounted for 20.5% of all loans written, up from 20.3%, and we see a rising trend since June 2017, from a low of 17.9%. Total lending was $6.3 billion dollars, up $31 million from last month. Investment loan flows fell 1.2% from last month accounting for $10 billion, down 120 million. Owner occupied loans fell 0.6% in trend terms, down $81 million to $14.5 billion. 41% of loans, excluding refinanced loans were for investment purposes, the lowest for year, from a high of 53% in January 2015.
On these trends, remembering that credit growth begats home price growth, the reverse is also true. Prices will fall further, the question remains how fast and how far? We will be revising our scenarios shortly.
The latest weekly indices from CoreLogic shows price falls in Sydney, down 0.16%, Melbourne down 0.18%, Brisbane down 0.08%, Adelaide down 0.09% and Perth down 0.38% giving a 5 cities average of down 0.18%.
Morgan Stanley revised their house prices forecasts, down. They say “We struggle to see improvement in any of our components over the next year. We now see a 10-15 per cent peak to trough decline in real house prices (from 5-10 per cent), which would mark the largest decline since the early 1980s. With households 2x more leveraged to housing than back then, the impact on housing equity would be larger again. This downgrade largely reflects the downturn’s extended length, as we expect the relatively orderly declines to date will continue. However, an acceleration of declines is in our bear case, and we will continue to monitor stress points, including arrears trends. Strong employment growth and temporary migration has helped contain reported vacancy rates thus far, but we see a sustained overbuild into 2019 weighing on rentals”.
NABs latest quarterly property survey index fell sharply in Q3, to the lowest level in 7 years, Sentiment was dragged lower by big falls in NSW and VIC. NAB’s view is the orderly correction in house prices will continue over the next 18-24 months with Sydney falling around 10% peak to trough and Melbourne 8%. This reflects a bigger fall than previously expected but would still leave house prices well up on 2012 levels. Their central scenario does not include a credit crunch event leading to disorderly falls in house prices. They also say the boom in Australian real estate sales to foreign investors has run its course, with NAB’s latest survey results continuing to highlight a decline in foreign buying activity resulting from policy changes in China on foreign investment outflows and tighter restrictions on foreign property buyers in Australia. In Q3, there were fewer foreign buyers in the market for Australian property, with their market share falling to a 7-year low of 8.1% in new housing markets and a survey low 4.1% in established housing markets.
Expect the calls for an increase in migration, and a freeing of lending standards to reach fever pitch – both of which MUST be ignored. We have to get back to more realistic home price ratios, despite the pain. So it was interesting to note that the NSW State Government this week, suggested that migration needed to slow, to provide breathing space, and for infrastructure to catch up. Better late than never. Remember the 2016 Census revealed that Australia’s population increased by 1.9 million people (+8.8%) in the five years to 2016, driven by a 1.3 million increase in people born overseas (i.e. new migrants)!
We published our latest household survey data this week. Mortgage stress rose again, to cross the one million households for the first time ever. We discussed the results in full in our post “Mortgage Stress Breaks One Million Households” The latest RBA data on household debt to income to June reached a new high of 190.5. This high debt level helps to explain the fact that mortgage stress continues to rise. Across Australia, more than 1,003,000 households are estimated to be now in mortgage stress (last month 996,000). This equates to 30.6% of owner occupied borrowing households. In addition, more than 22,000 of these are in severe stress. We estimate that more than 61,000 households risk 30-day default in the next 12 months. We continue to see the impact of flat wages growth, rising living costs and higher real mortgage rates. Bank losses are likely to rise a little ahead.
Moodys released a report suggesting that Mortgage delinquencies and defaults are more likely to occur in outer suburbs of Australian cities than inner-city areas, because of the lower average incomes and weaker credit characteristics in these suburbs. “Delinquency rates are highest in outer suburban areas. On average across Australian cities, mortgage delinquency rates are lowest in areas within five kilometers of central business districts and highest in areas 30-40 kilometers from CBDs. In the residential mortgage-backed securities they rate, delinquency rates are in many cases higher in deals with relatively large exposures to mortgages in outer areas.
We agree there are higher loan to value and debt to income ratios in the outer areas, but the overall debt commitments are higher closer in and so we suspect that many more affluent households are going to get caught, because of multiple mortgages, including investment mortgages and their more affluent lifestyles. My thesis is the banks have been lending loosely to these perceived lower risk high income households, but it ain’t necessarily so…
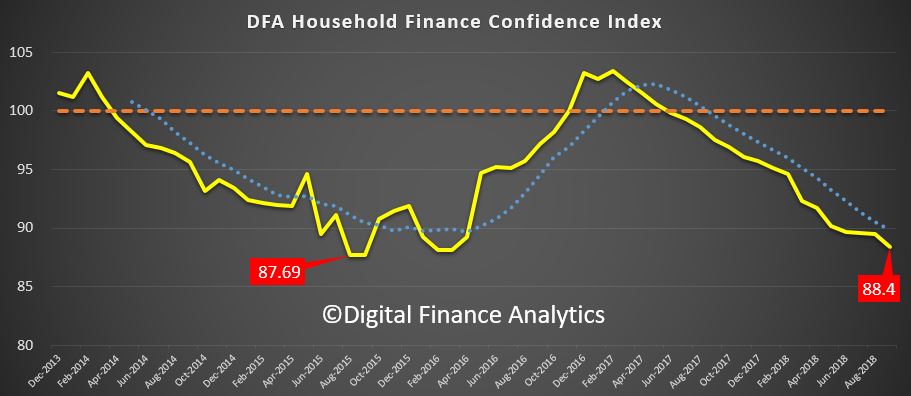
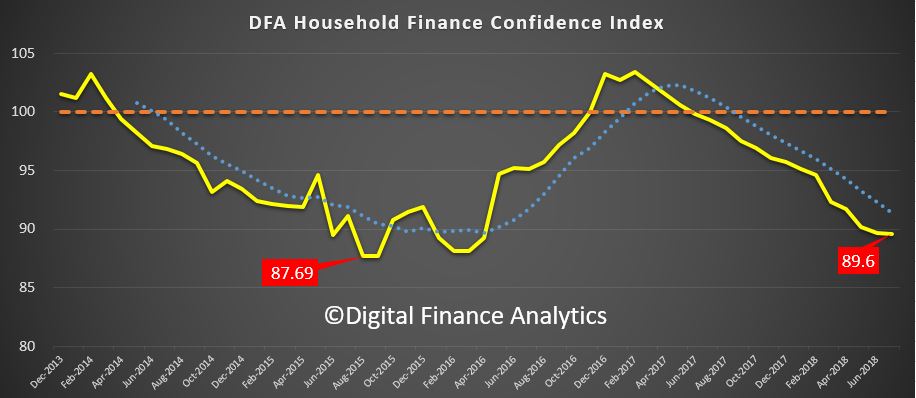
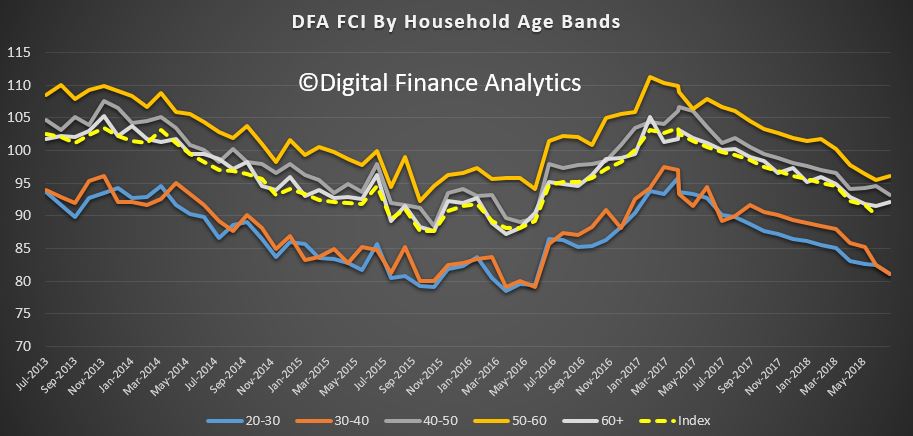
We also published our Household Financial Confidence index. The latest read, to end September shows a further fall, and continues the trend which started to bite in 2017. The current score is 88.4, just a bit above the all-time low point of 87.69 which was back in 2015. Last month – August – it stood at 89.5. You can watch our video “Household Financial Confidence Drifts Lower Again” where we discuss the results. We expect to see the index continuing to track lower ahead, because the elements which drive the outcomes are unlikely to change. Home prices will continue to move lower, the stock markets are off their highs, wages are hardly growing and costs of living are rising. Household financial confidence is set to remain in the doldrums.
Finally, we also published our survey results in terms of forward intentions. So what is in store for the next few months? Well, in short it’s more of the same, only more so, with more households reporting difficulties in obtaining finance, fewer expecting to transact in the next year and to see home prices rise. You can watch our video “Decoding Property Buying Intentions” where we analyse the results. The single most startling observation is the fall in the number of property investors, including those who hold portfolios of investment properties intending to transact. 20% of portfolio investors are expecting to transact, and the bulk of these intend to sell a property, compared with a year ago when 50% said they would transact, and most were looking to add to their portfolios. Most solo property investors are now on the side lines, with around 10% expecting to transact, and most of these on the sell side. Demand for investment property will continue to fall, as rental yields and capital appreciation fall.
So to the markets.
Locally, the ASX 100 ended the week well down, although there was small rise on Friday, after the heavier falls earlier in the week. We ended at 4,849, up 0.20%. The local volatility index remains elevated, ending at 20.4 on Friday, though that 6.5% lower than the previous day. Expect more ahead.
The ASX Financials index however did less well, and ended at 5,744, up just 0.03% and below the June lows. The banking sector is under pressure, for example Macquarie ended at 115.5, up 0.03% on the day, but well down from its 125 range. And AMP continues to languish at 3.05. We heard from some of the major bank CEO’s this week, with Westpac and ANZ apologising for the issues revealed in the Royal Commission, but I also note that CBA has so far only addressed one of the many issues which APRA agreed with them in terms of behavioural remediation. The banks have a long way to go to regain trust, and we expect more weakness ahead. And the latest estimates are that the sector will be up for something like $2.4 billion dollars in remediation costs and other charges. And guess who will end up paying for their bad behaviour?
The Aussie ended the week at 71.10, having reached the 70.5 range in the week. This has more to do with the US dollar movements than changes in sentiment here.
There are debates about what caused the significant falls, after all the FED rate lift strategy, and the trade wars have been around for some time. But my guess is the market has finally understood the era of low-cost or no-cost money is over. Thus expect more volatility ahead. The US fear index fell back on Friday, down 13.8% to 21.31, but is still elevated.
In fact, Wall Street indexes rose on Friday after a week of significant losses as investors returned to technology and other growth sectors, but gains were hampered by ongoing worries about U.S.-China trade tensions and rising interest rates.
Energy and financial stocks continued to fall and bank stocks kicked off the third-quarter financial reporting season with a whimper, while investors fled insurance stocks after Hurricane Michael slammed into Florida.
The technology sector was the biggest gainer of the S&P’s 11 major industry indexes, with a 1.5 percent advance, but it was still on track for its biggest weekly drop since March. The Dow Jones ended up 1.15% to 25,340, but is well off its recent highs. The NASDAQ was up more, 2.29% to 7,497, as buyers came back into the sector. The S&P 500 ended up 1.37% to 2,765.
All three indexes were on track for their biggest weekly declines since late March.
The S&P Financial index was down 0.42% to 465.07, on mixed trading results which came out on Friday. The S&P 500 banks subsector slid 1.6 percent. The biggest drag on the subsector was JPMorgan Chase & Co which reversed early gains to trade down 2 percent despite its quarterly profit beating expectations. PNC Financial led the percentage losers among bank stocks, with a 6.5 percent drop after the regional bank reported disappointing quarterly loan growth and said it expected only a small improvement in lending this quarter. The only gainers among banks were Citigroup, which rose 0.6 percent, and Wells Fargo which eked out a 0.64 percent gain after upbeat results.
The bank results launch a quarterly reporting season that will give the clearest picture yet of the impact on profits from President Donald Trump’s trade war with China.
The short term 3-Month Treasury remained flat at 2.27 at the end of the week, while the 10-Year bond rose a little to 3.165, up 1.09%. The Treasury yield is now at a 7-year high. The suspicion is that perhaps rates have turned and will go higher still, as a longer term view shows. It is also interesting to compare the US 3-Month Bill Rate minus the same rates in Germany and the UK. Short term rates in the US are higher, in fact reaching the highest positive difference since September 1984. This highlights the different path now being taken by the US, but the fall-out will be global.
Gold, which had moved higher among the market ructions, slide a little, and was down 0.52% on Friday to end at 1,221. Bitcoin finished at 6,316 up 0.57%, and continues in its marrow range for now. And Oil which had fallen earlier in the week moved up 0.72% to 71.48.
Finally, it’s worth noting that the Reserve Bank Of New Zealand is now publishing a bank specific set of scorecards to help consumers weigh up the risks bank to bank. This is essential, given the now explicit Deposit Bail-In which exists there. We discussed this most recently in our Post “The Never Ending “Bail-In” Scandal, and in the Video that Economist John Adams and I released yesterday. In fact, the bank specific data which is available in Australia is derisible compared with the NZ stats, but I came across this slide from LF Economics which highlights how the ratio of Bank Loans To Bank Deposits compares across a number of Banks, including the big four. It’s fair to assume the higher the ratio, the greater the potential risk. Westpac, CBA, NAB and ANZ are all in the top half. I believe we need more specific disclosure from the sector, and I suggest that APRA continues to provide only a partial view of the banking system here. The fact is, Bail-In, or no, we need much more transparency. It would help to negate the spin presented in the RBA’s Financial Stability Review, which in my view is not effective. Oh, and look out for our joint video on Gold, coming up in the next few days, it will surprise you!
Finally, a reminder that on Tuesday 16th October at 20:00 Sydney we are running our next live stream Q&A event. The reminder is up on YouTube, and you can send me questions before hand, or join in the live chat. So mark your dairies.
In the final post relating to our latest household surveys this month, we turning to our household financial confidence index.
The latest read, to end September shows a further fall, and continues the trend which started to bite in 2017. The current score is 88.4, just a bit above the all-time low point of 87.69 which was back in 2015. Last month – August – it stood at 89.5.
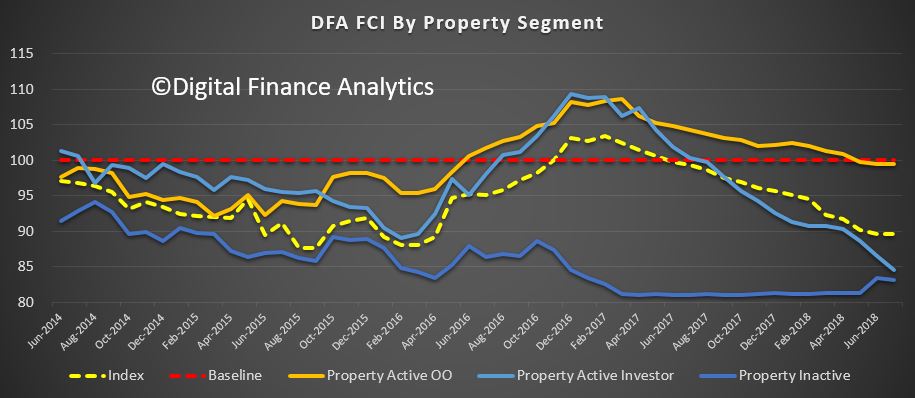
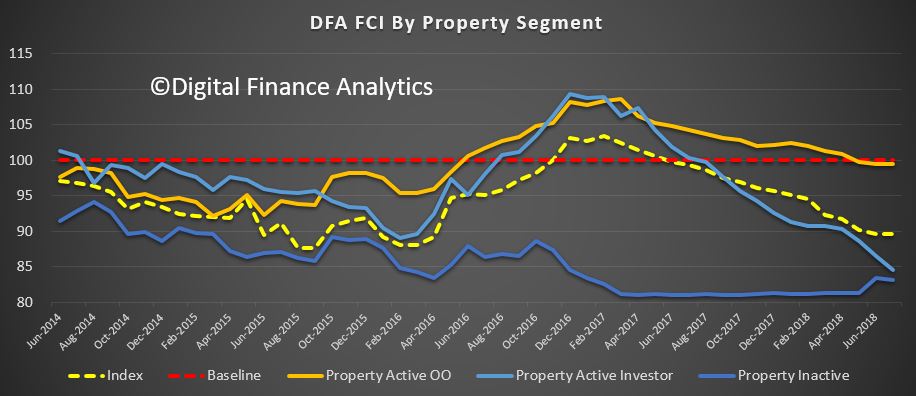
Looking across our property segments, both property investors and owner occupiers were lower, reacting to the falls in home prices, and the difficulty of refinancing many are experiencing. Mortgage rate increases are also putting more pressure on many budgets. Despite this, those renting remain less confident, though investors have really turned sour now.
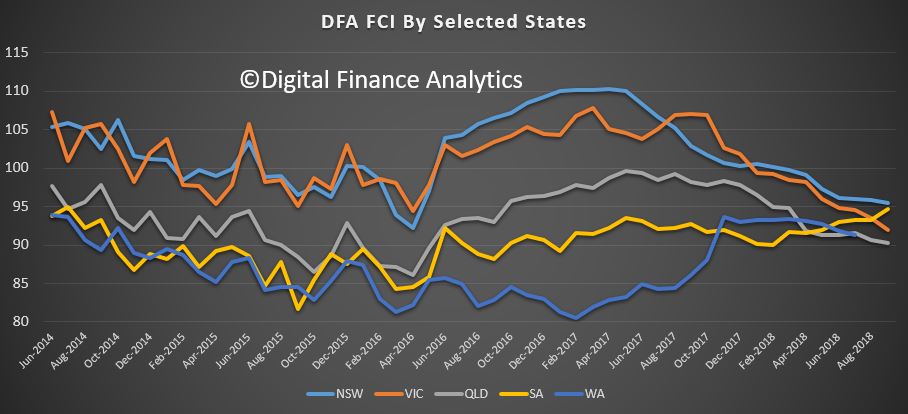
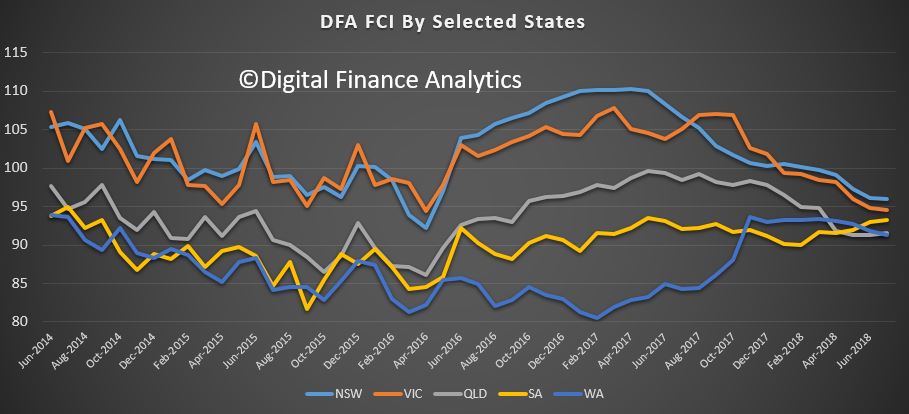
Across the states, we see a bunching of results, though Victoria appears to be heading south, while South Australian households are a little more positive than last month.
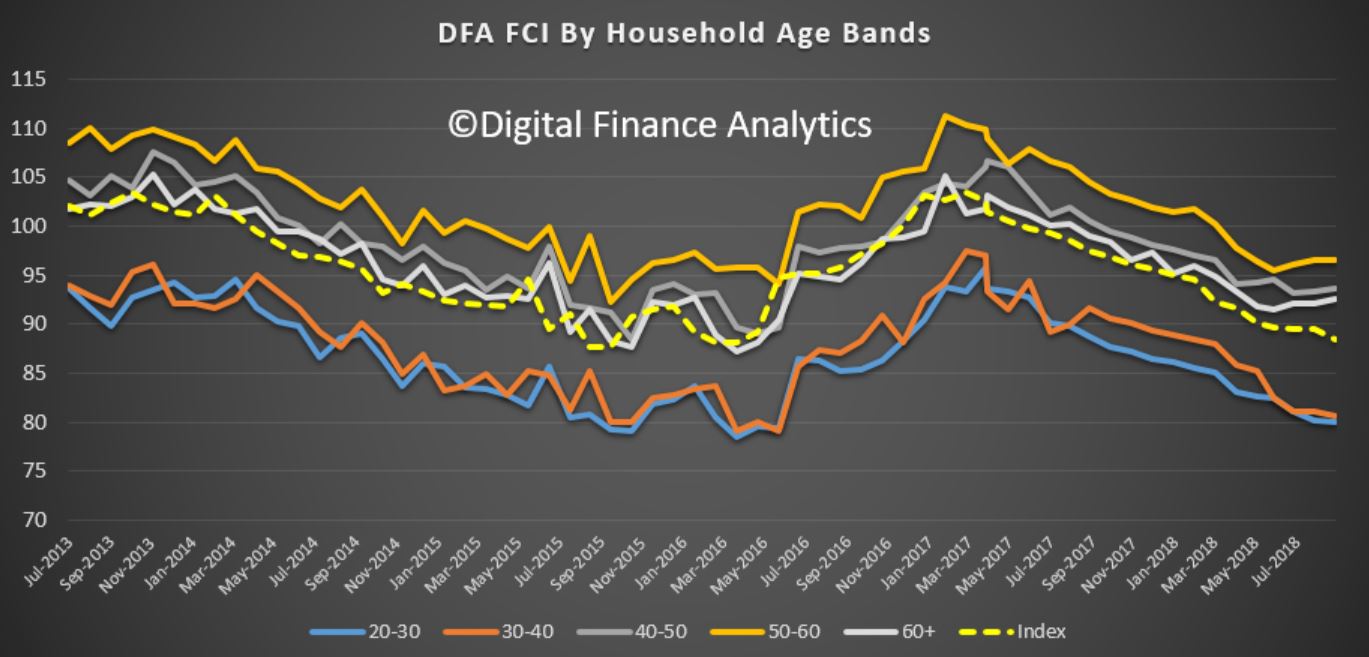
The falling levels of confidence are evident across many of the age bands, older households are still relatively more positively, largely thanks to historic capital growth in their property, and strong stock market performance in recent times. Younger households are more concerned and many are now seeing their property values fall, at least on paper.
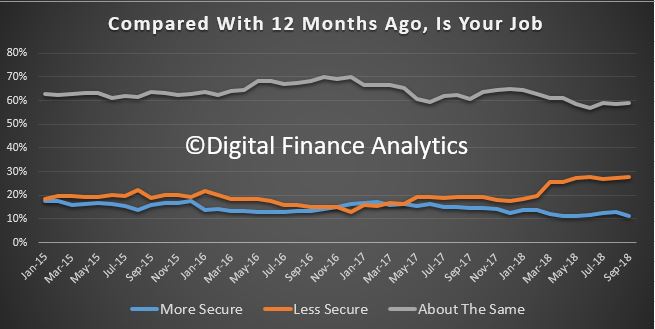
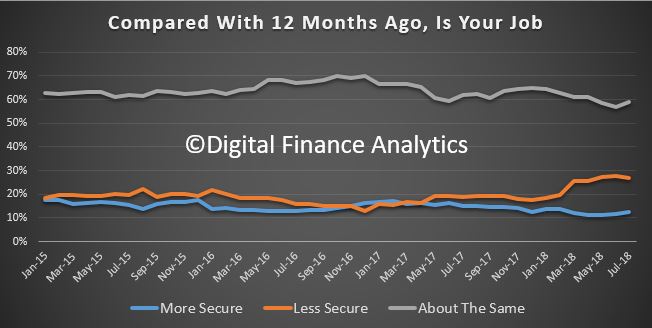
Looking at the moving parts which drive our index, those who felt more confident about their job security than 12 months ago fell 1.8% to 11%. 59% saw no change.
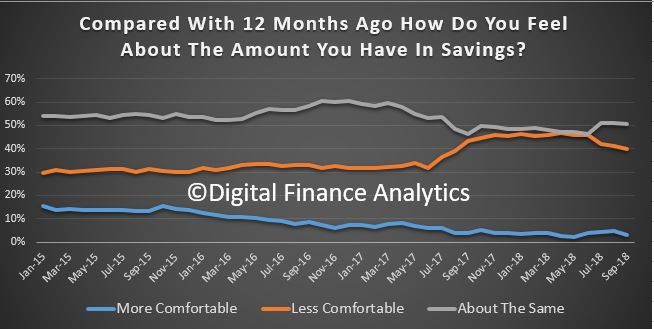
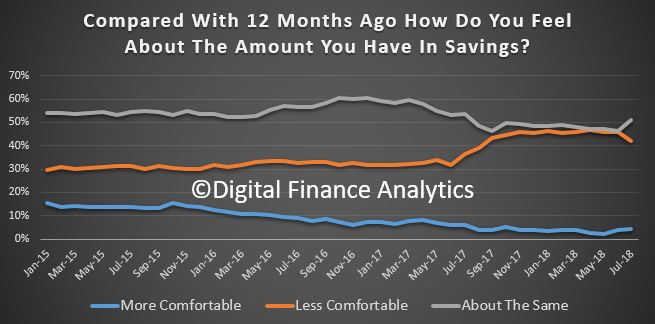
There was a fall in those confident with regards to their savings, with a fall of 1.7% in those feeling more comfortable than a year ago, and 50% feeling about the same. The falling savings rates that many have experienced is part of the story, but so is the fact that more are raiding savings to make ends meet. This of course is not a sustainable position.
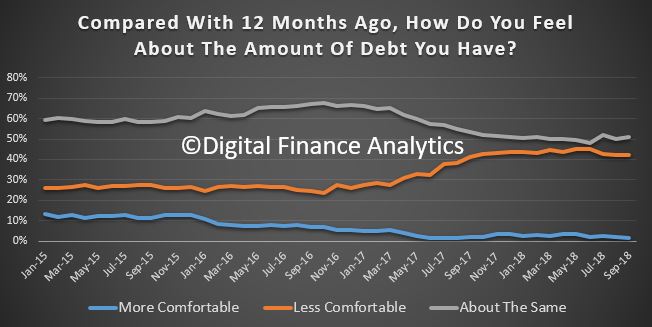
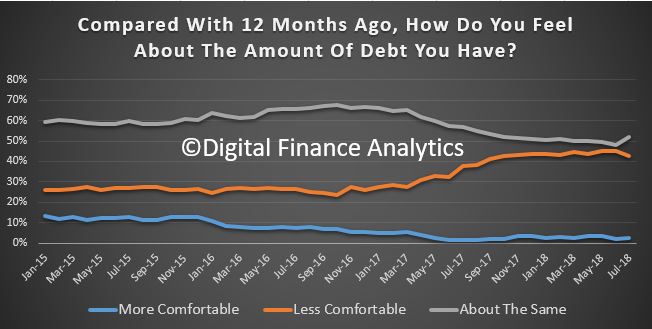
There was a fall of 1.3% in those who are comfortable with the amount of debt they hold, and 42% are less comfortable than a year ago, reflecting recent mortgage rate increases, and problems with getting an appropriate refinance deal.
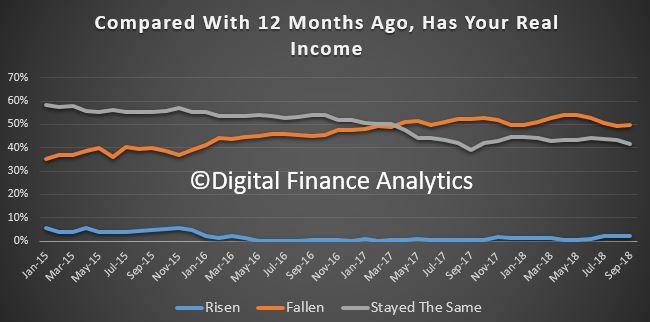
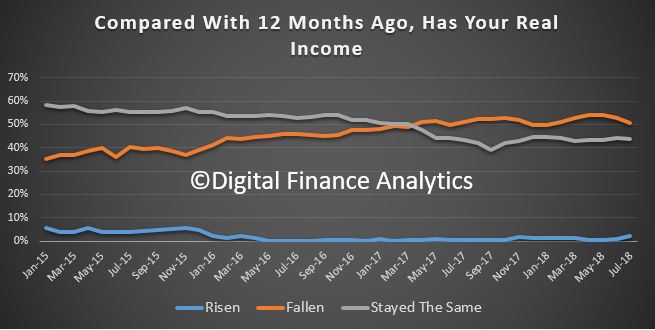
Overall income remains an issue for many, with 42% saying there had been no increase in the past year, and 50% saying there had been a decrease in real income. Many households are relying on multiple jobs to pay the bills, and some of these are zero hours and uncertain in terms of income. We still see high levels of under employment, suggesting that many households want more work than they can get.
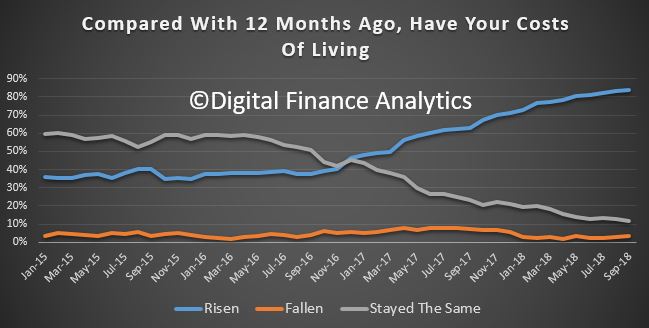
The costs of living remain a significant issue with 84% saying their costs have risen in the past year. It is the normal story, higher electricity and fuel bills, rising medical costs and child care as well as school fees. The standard reported CPI measure does not appear to align with many households current experience.
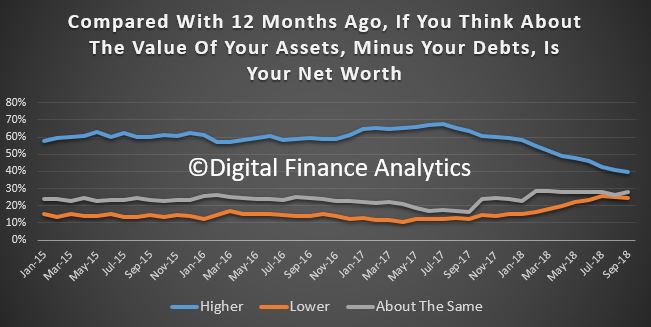
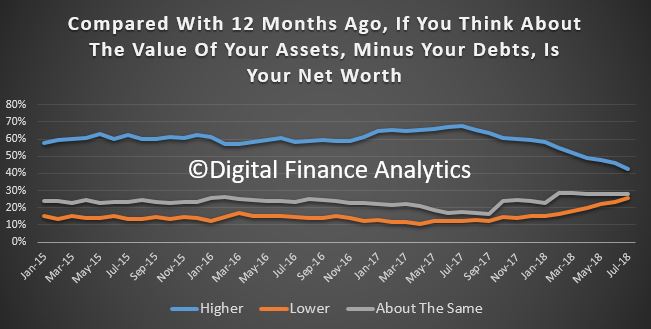
Putting all this together, 39% say their net worth is higher now than a year ago, mainly thanks to the strong stock market, 28% say they see no change and 25% say their net worth has dropped. The most significant factor here is the fall in property values over the past 12 months.
We expect to see the index continuing to track lower ahead, because the elements which drive the outcomes are unlikely to change. Home prices will continue to move lower, the stock markets are off their highs, wages are hardly growing and costs of living are rising. Household financial confidence is set to remain in the doldrums.
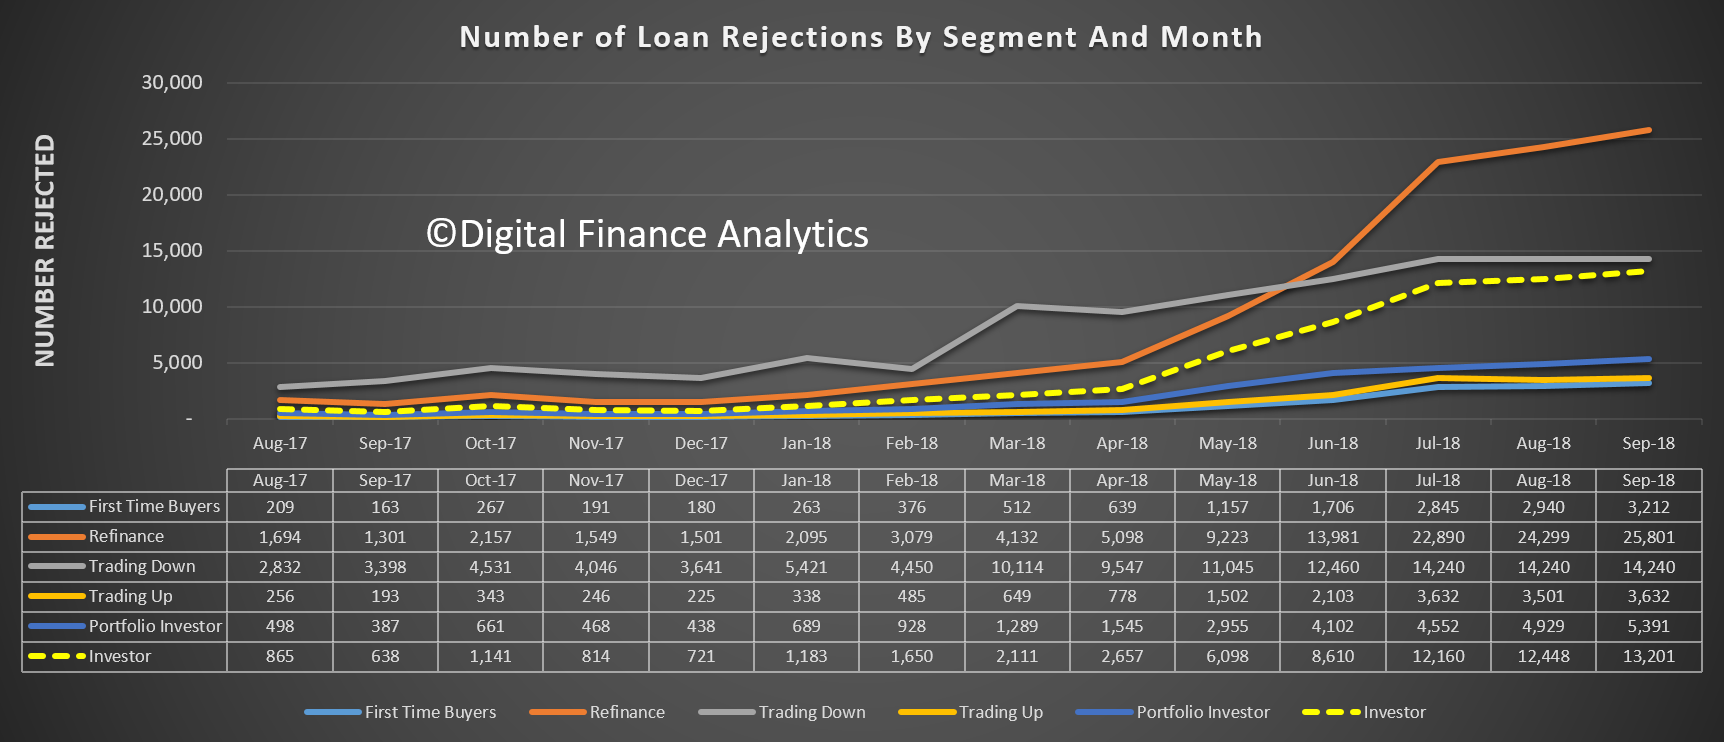
Finally, despite the attractor mortgage rates on offer from the banks continues, (in an attempt to keep mortgage volumes up), our research shows that many households cannot access them in the new tighter lending environment. 40% of applications are being rejected.
By way of background, these results are derived from our household surveys, averaged across Australia. We have 52,000 households in our sample at any one time. We include detailed questions covering various aspects of a household’s financial footprint. The index measures how households are feeling about their financial health. To calculate the index we ask questions which cover a number of different dimensions. We start by asking households how confident they are feeling about their job security, whether their real income has risen or fallen in the past year, their view on their costs of living over the same period, whether they have increased their loans and other outstanding debts including credit cards and whether they are saving more than last year. Finally we ask about their overall change in net worth over the past 12 months – by net worth we mean net assets less outstanding debts.
We have completed the latest round of our 52,000 household surveys, and today we discuss the results relating to property buying intentions by extracting the data from our Core Market Model. It was this data six months back which enabled us to predict the currently observed slowdown in sales, auction clearances and home prices.
So what is in store for the next few months? Well, in short its more of the same, only more so, with more households reporting difficulties in obtaining finance, fewer expecting to transact in the next year and to see home prices rise.
So we start with transaction intentions. The first startling observation is the fall in the number of property investors, including those who hold portfolios of investment properties intending to transact. 20% of portfolio investors are expecting to transact, and the bulk of these intend to sell a property, compared with a year ago when 50% said they would transact, and most were looking to add to their portfolios. Most solo property investors are now on the side lines, with around 10% expecting to transact, and most of these on the sell side. Demand for investment property will continue to fall, as rental yields and capital appreciation fall.
On the other hand, the number of people trading down is rising, with more than 50% of these looking to sell before prices fall further. There is some demand from first time buyers, and up-traders, but the net conclusion is there will be more property coming to market and fewer buyer, so prices are set to fall further, and quite quickly. The spring season appears all but shot.
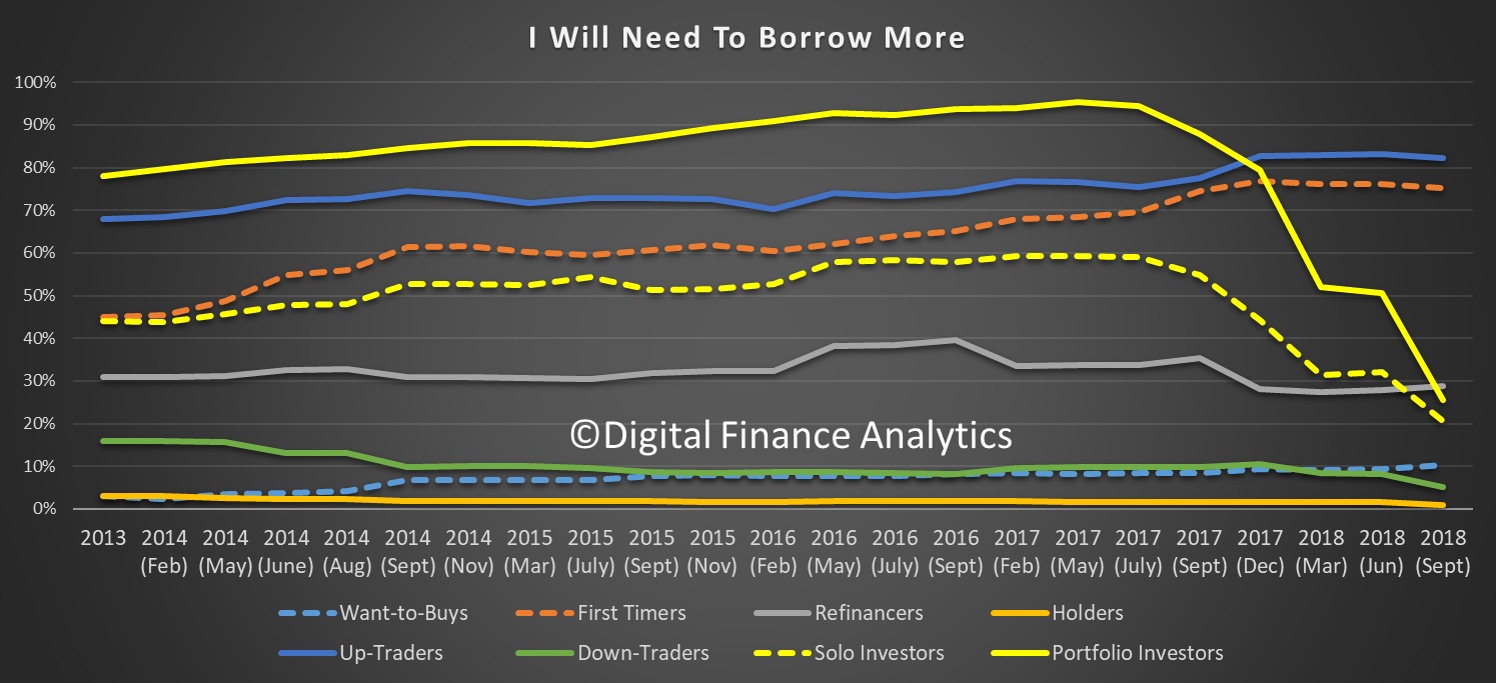
These trends are mirrored in the demand for credit. Property investors are now less likely to borrow, while those trading-up and first time buyers are still in the market (but in terms of volumes this is a smaller group). Refinance households are still in the market for a replacement loan, but these do not add to new demand for credit.
As a result, we expect demand for credit to wilt further in the months ahead. Of course for the banks to maintain their profit output they need to see real growth in new credit, we do not expect that will eventuate, so credit will continue to ease.
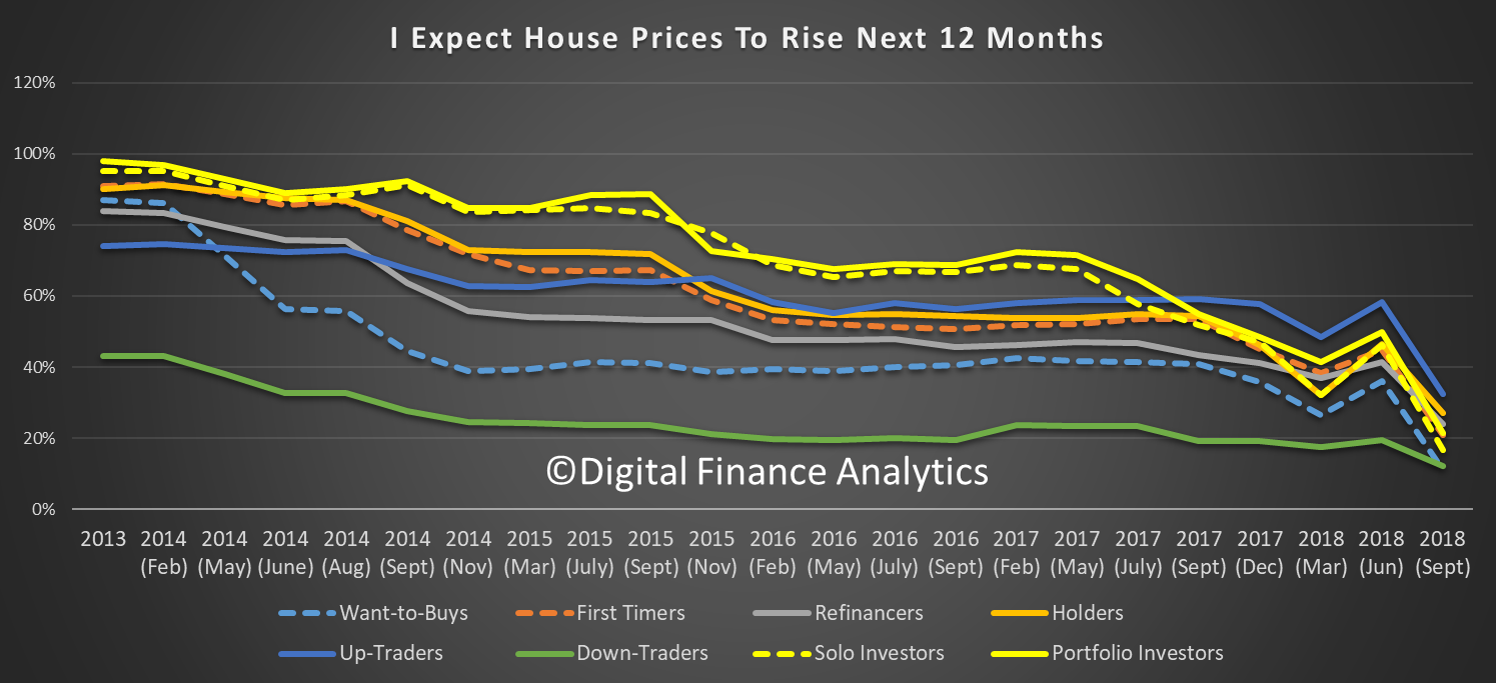
Universally, households are less bullish on home price growth, than a year ago, with a sharp down turn since June 2018. Down traders are the least likely to expect rises at 18%, while 35% of those trading up were bullish on home price values. Property investors are getting less and less positive about future price accumulation.
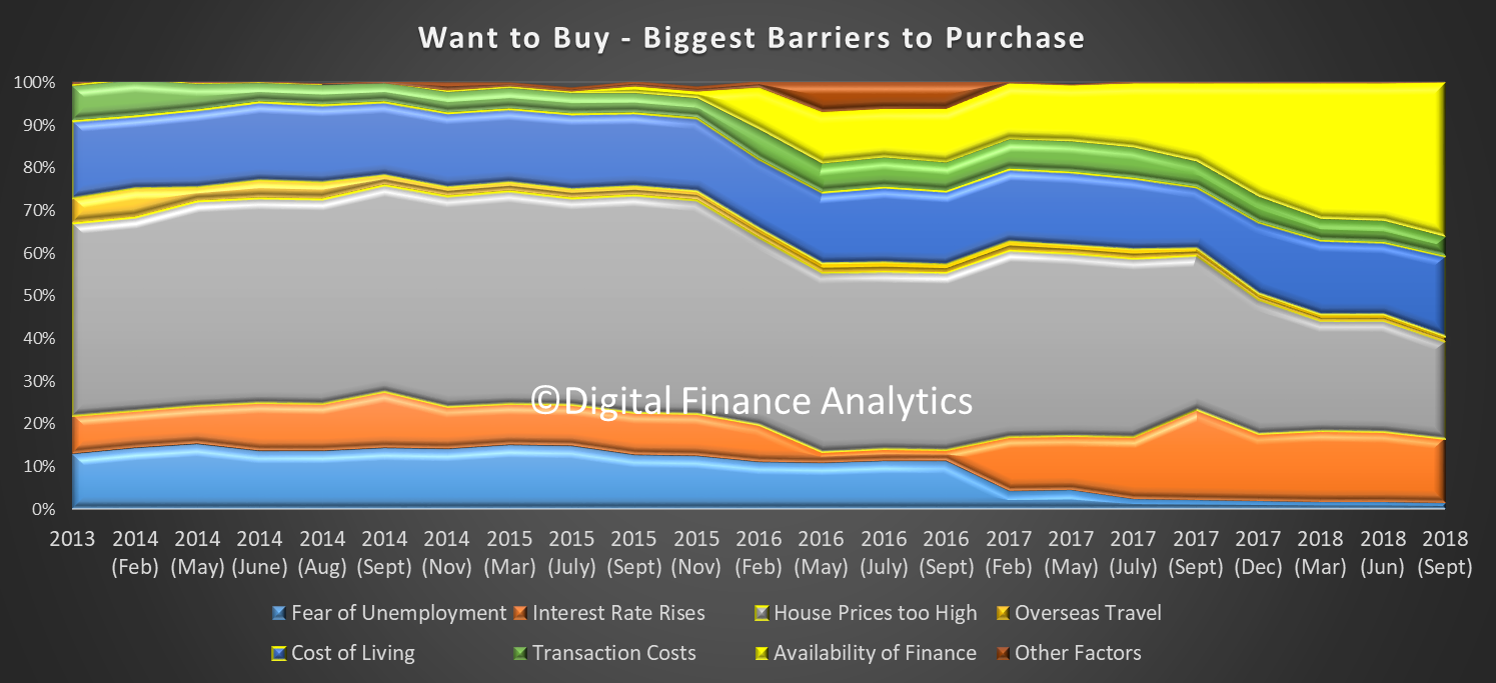
Turning to the specific segments, 36% of those wanting to buy, but who cannot, reported their barrier related to the (non) availability of finance. This is a record, and reflects the tighter underwriting standards now in force.
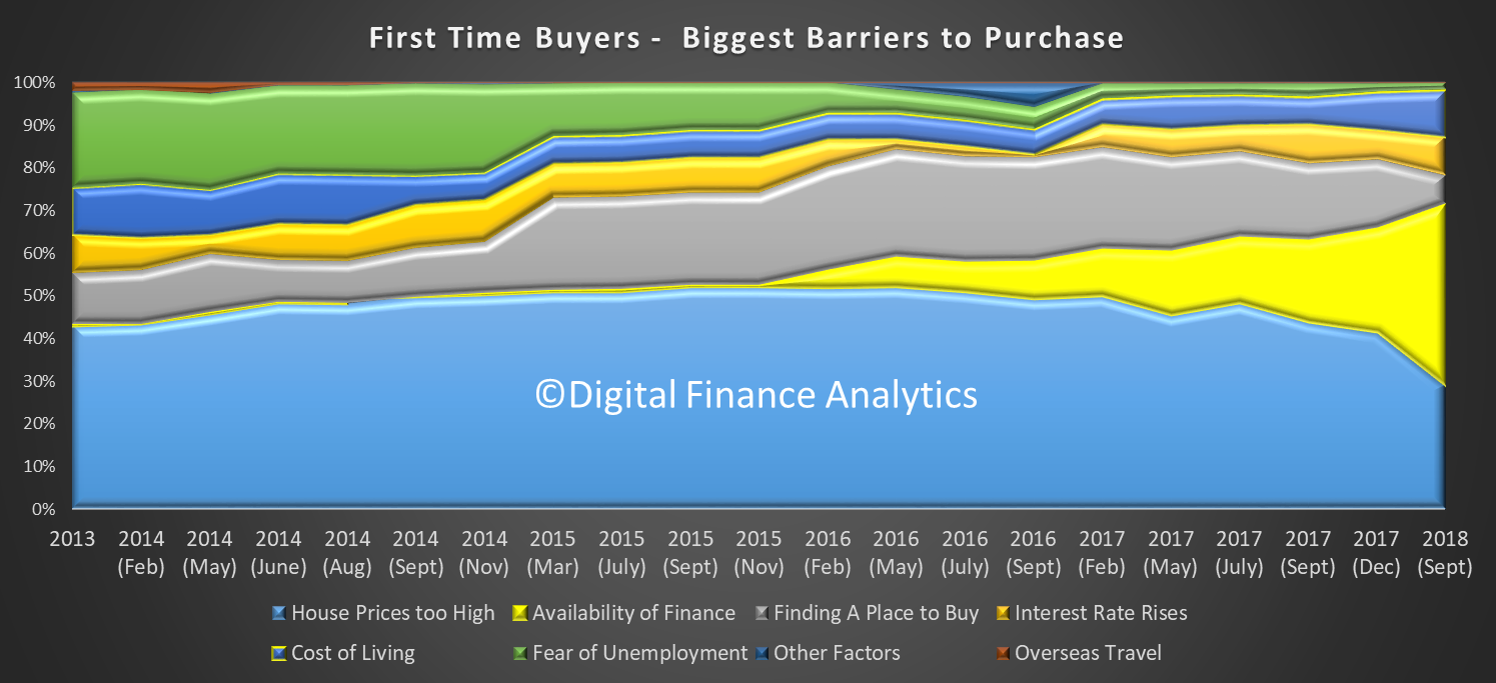
We find the same thematic among first time buyers where 42% report a problem with finance availability, a record.
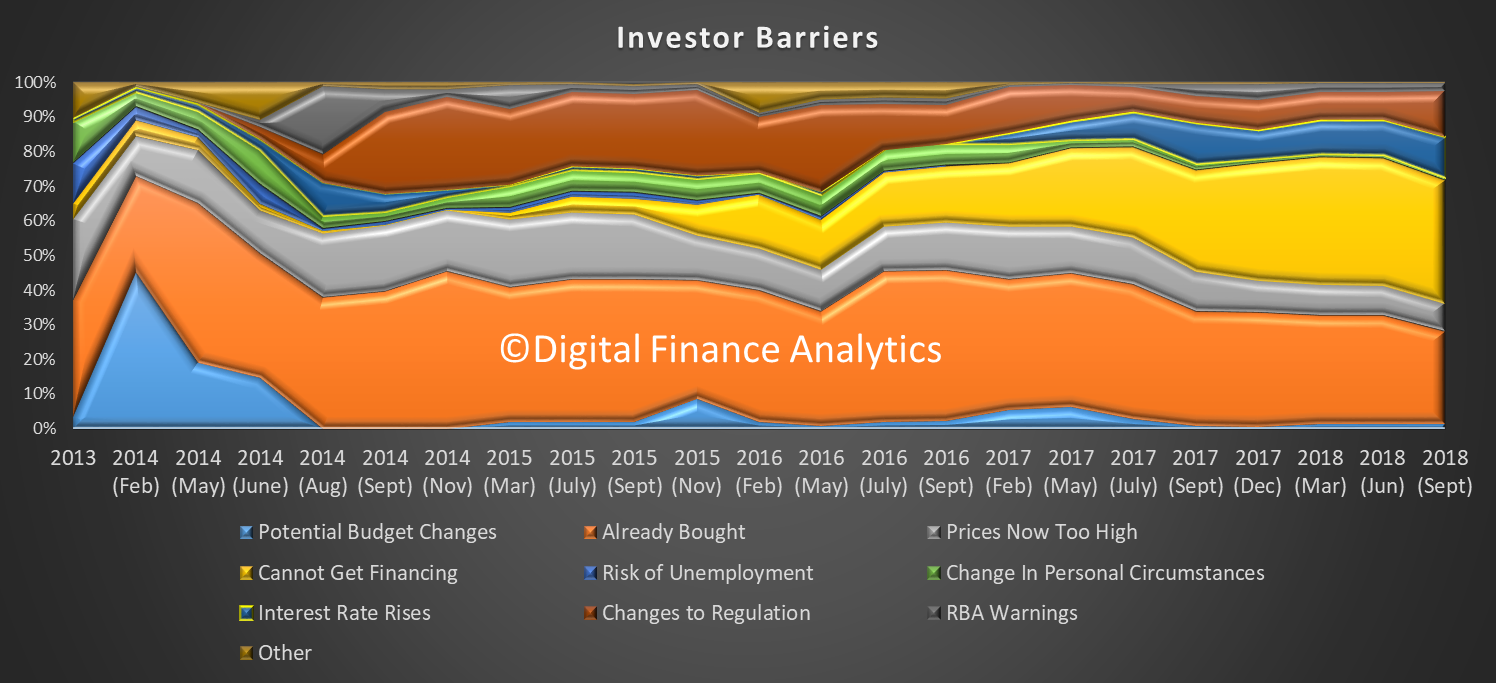
Investors have a similar problem with 36% saying they have issues with finance, and more are now concerned about potential changes in regulation (including Labor’s changes to negative gearing).
In fact, Investors are ever more reliant on the tax breaks, as capital growth eases. 40% are banking on the tax benefits, while 15% expect future capital appreciation.
When we look at the motivations of those seeking to trade down, 48% are looking to capital release, and now few are interested in acquiring an investment property. Increased convenience remains a significant driver.
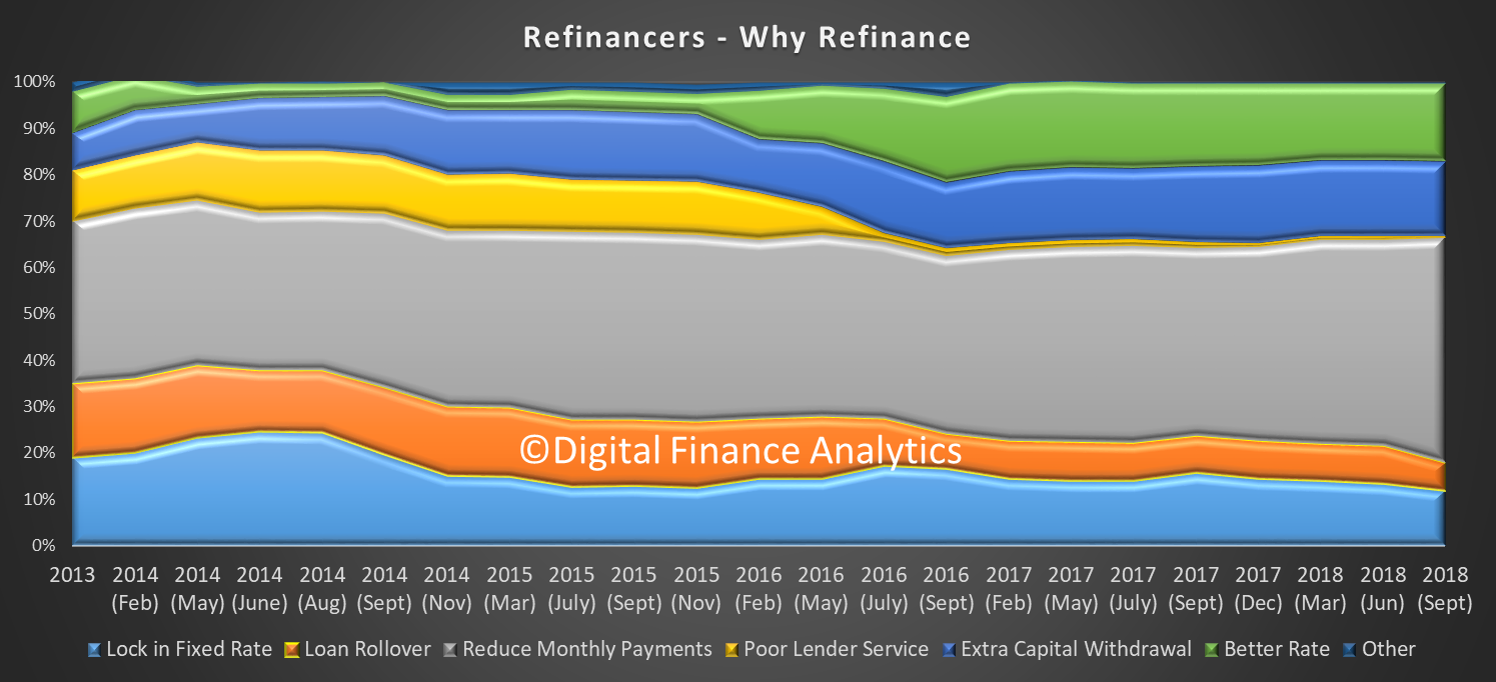
Households seeking to refinance are mainly being driven by a quest to reduce monthly repayments (49%) and there is a high correlation with those experiencing mortgage stress, as we reported yesterday. Lender service, or the lack of it, does not seem to count for much.
And finally, to ice the cake, as it were, the number of loan rejections continues to rise, especially among refinance and investor cohorts.
Add this new data to the other factors:
Tighter Lending Standards – focus on income AND expenses, not HEM
Mortgage Borrowing Power dropped up to 40%
Foreign Buyers dropped 35%, and significant hike in extra fees and taxes
SMSF borrowing restricted
Interest Only Borrowing Restricted ($120 billion for reset each year)
Investors less likely to transact, as capital growth reverses
Tighter returns on rentals (half under water in cash flow terms)
Higher interbank funding costs
Rising mortgage costs and rates (NAB holds)
Risk from Class Actions and Royal Commission
Etc…
and there is plenty to suggest further home price falls are in the offing. We will add this new set of data into our scenarios, and we will update our findings in a future post.
But our conclusion is “you ain’t seen nothing yet” to quote an old Bachman Turner Overdrive song from 1974!
Digital Finance Analytics (DFA) has released the September 2018 mortgage stress and default analysis update. We have just crossed the 1 million, for the first time ever in our history.
The latest RBA data on household debt to income to June reached a new high of 190.5[1]. This high debt level helps to explain the fact that mortgage stress continues to rise.
Across Australia, more than 1,003,000 households are estimated to be now in mortgage stress (last month 996,000). This equates to 30.6% of owner occupied borrowing households. In addition, more than 22,000 of these are in severe stress. We estimate that more than 61,000 households risk 30-day default in the next 12 months. We continue to see the impact of flat wages growth, rising living costs and higher real mortgage rates. Bank losses are likely to rise a little ahead.
Martin North, Principal of Digital Finance Analytics says this rise in stress is to be expected, and should be of no surprise at all. Indeed, the fact that significant numbers of households have had their potential borrowing power crimped by lending standards belatedly being tightened, and are therefore mortgage prisoners, is significant. More than 40% of those seeking to refinance are now having difficulty. This is strongly aligned to those who are registering as stressed. These are households urgently trying to reduce their monthly outgoings”.
“Continued rises in living costs – notably child care, school fees and fuel – whilst real incomes continue to fall and underemployment is causing significant pain. Many are dipping into savings to support their finances.”
Our analysis uses the DFA core market model which combines information from our 52,000 household surveys, public data from the RBA, ABS and APRA; and private data from lenders and aggregators. The data is current to end September 2018. We analyse household cash flow based on real incomes, outgoings and mortgage repayments, rather than using an arbitrary 30% of income.
Households are defined as “stressed” when net income (or cash flow) does not cover ongoing costs. They may or may not have access to other available assets, and some have paid ahead, but households in mild stress have little leeway in their cash flows, whereas those in severe stress are unable to meet repayments from current income. In both cases, households manage this deficit by cutting back on spending, putting more on credit cards and seeking to refinance, restructure or sell their home. Those in severe stress are more likely to be seeking hardship assistance and are often forced to sell.
Probability of default extends our mortgage stress analysis by overlaying economic indicators such as employment, future wage growth and cpi changes. Our Core Market Model also examines the potential of portfolio risk of loss in basis point and value terms. Losses are likely to be higher among more affluent households, contrary to the popular belief that affluent households are well protected. This is shown in the segment analysis below:
Stress by the numbers.
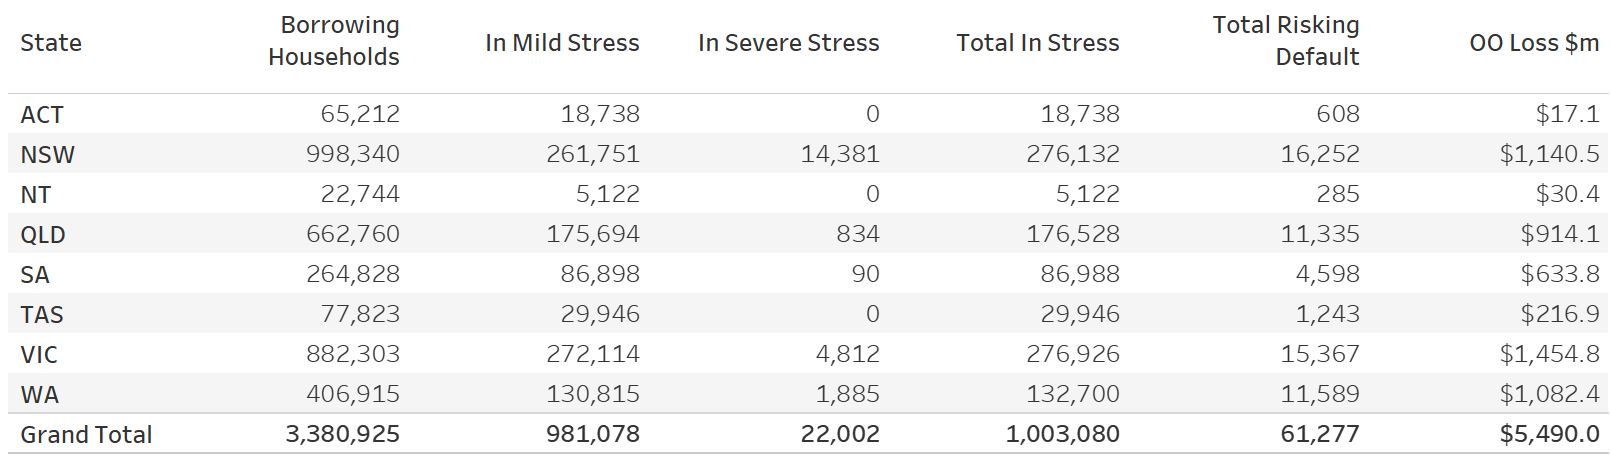
Regional analysis shows that NSW has 276,132 households in stress (270,612 last month), VIC 276,926 (270,551 last month), QLD 176,528 (175,102 last month) and WA has 132,700 (134,333 last month). The probability of default over the next 12 months rose, with around 11,589 in WA, around 11,300 in QLD, 15,300 in VIC and 16,252 in NSW.
The largest financial losses relating to bank write-offs reside in NSW ($1.1 billion) from Owner Occupied borrowers) and VIC ($1.45 billion) from Owner Occupied Borrowers, though losses are likely to be highest in WA at 3.4 basis points, which equates to $1,082 million from Owner Occupied borrowers.
Here is a more detailed regional breakdown.
[1] RBA E2 Household Finances – Selected Ratios June 2018
You can request our media release. Note this will NOT automatically send you our research updates, for that register here.
[contact-form to=’mnorth@digitalfinanceanalytics.com’ subject=’Request The September 2018 Stress Release’][contact-field label=’Name’ type=’name’ required=’1’/][contact-field label=’Email’ type=’email’ required=’1’/][contact-field label=’Email Me The September 2018 Media Release’ type=’radio’ required=’1′ options=’Yes Please’/][contact-field label=”Comment If You Like” type=”textarea”/][/contact-form]
Note that the detailed results from our surveys and analysis are made available to our paying clients.
I recently ran our monthly YouTube live stream event, in which we discussed the trajectory of home prices, and why we expect more falls in the months ahead.
The event is available to watch on YouTube, complete with the chat room questions and answers in real-time.
You can learn more about the 60 Minutes segment I participated in, as well as the latest trends in lending, home prices and sales transactions.
The “killer slide” is this one:
The number of property transfers are way, way down, and not just in Sydney. This is based on ABS data released yesterday.
The latest edition of the DFA Household Financial Confidence Index to end July 2018 remains in below average territory, coming in at 89.6, compared with 89.7 last month. We had expected a bounce this month, in fact the rate of decline did slow, thanks to small pay rises for some in the new financial year, and refinancing of some mortgage loans to the “special” rates on offer currently. However, the index at this level is associated with households keeping their discretionary spending firmly under control. And the property grind is still impacting severely.
Looking at the results by our property segmentation, owner occupied households overall remain around the neutral reading, while property investor confidence continues to fall, into territory normally associated with those who are renting or living with family. This signals significant risks in the property investment sector ahead.
Owner occupied property owners who have been able to refinance (lower LVR loans) have been able to shave their monthly repayments, while for some in rented accommodation they have found it easier to find a rental at a lower rent. Investment property holders reported continued concerns about servicing their loans, and of potentially higher interest rates ahead. Those on interest only loans were particularly concerned about their next reset review, given the tighter underwriting standards now in play. The peak of the resets however is well more than a year away.
The spread of scores across the states continues to bunch, as NSW and VIC households react to lower home prices. WA continues to show little real recovery in household finance (despite the hype) although there was a small rise in Queensland, thanks to recent pay lifts for some.
Across the age bands, younger households remain the least confident, while those aged 50-60 were more bullish, thanks to recent stock market lifts, and access to lower rate refinance mortgages. The inter-generational dynamic is in full force, with younger households not in the property market seemingly unable to access the market (despite the recent incentives in NSW and VIC) and those with a property, and mortgage wrestling with the repayments.
Looking in more detail at the index components, job security improved a little this month, with 12.5% feeling more secure, up 0.67%, 27% less secure, down 0.92% and those about the same at 58.8%, up 2%. However, we see many households in multiple part-time jobs, and around 20% of households are actively seeking more work/hours.
There was a small rise in those reporting an income improvement, thanks to changes which kicked in from July. 2.3% said their income has improved, up 1.5% from last month, while 43.7% stayed the same, and there was a drop of 2.2% of those reporting a fall in income, to 50.5%.
Households continue to see the costs of living rising, with 82.3% reporting higher costs, up 1%, 13% reporting no change, and 2.5% falling. The usual suspects included power bills, child care costs, the price of fuel, plus health care costs and the latest rounds of council rate demands. The reported CPI appears to continue to under report the real experience of many households. Many continue to dip into savings to pay the bills.
In terms of debts outstanding, there was a small fall in those reporting they were less comfortable, with 42% reporting compared with 44% last month. This is attributable to changes in interest rates, and refinancing, especially for owner occupied households with a lower Loan to Income ratio. Many with large mortgages also have other debts, including credit cards and personal loans which also require servicing. Around 52% reported no change in their debt, up 3.5%. Property Investors were more concerned overall.
Looking at savings, those with stocks and shares have enjoyed significant gains (at least on paper) and recent dividends, so tended to be more confident. Some were able to benefit from higher savings rates on selected term deposits, though rates attached to on-call accounts continue to languish as lenders manage their margins. Around a quarter of households have less than one months spending in savings, so many are facing a hand to month situation with regards to their finances. Many of these households are in the younger age bands and have no savings to protect them should their personal situations change.
We noted in the survey that a number of households were actively seeking alternative savings vehicles as property and bank deposits look less interesting. We will have to see whether these alternatives are as attractive (in terms of risk-return) as some are claiming. We have our doubts. But then risk is relative.
So finally, putting this all together, the proportion of households who reported their new worth was higher than a year ago continues to slide as property price falls continue to hit home, and as savings are raided to maintain lifestyle. 42% said their net worth had improved, down 3.75% from last month. 25.6% said their net worth had fallen, up 2.5% and 28% reported no real change.
We had expected to see a small bounce in the index this month as some incomes rise in the new tax year and other changes take effect. But the impact of the fading property sector, and cash flow constraints are likely to dwarf this impact. The only “get out of jail card” will be income growth above inflation, and as yet there is little evidence of this occurring. Thus we expect the long grind to continue.
Finally, the spate of attractor rates from the banks continues, in an attempt to keep mortgage volumes up. However, our research shows that many households cannot access them in the new tighter lending environment.
By way of background, these results are derived from our household surveys, averaged across Australia. We have 52,000 households in our sample at any one time. We include detailed questions covering various aspects of a household’s financial footprint. The index measures how households are feeling about their financial health. To calculate the index we ask questions which cover a number of different dimensions. We start by asking households how confident they are feeling about their job security, whether their real income has risen or fallen in the past year, their view on their costs of living over the same period, whether they have increased their loans and other outstanding debts including credit cards and whether they are saving more than last year. Finally we ask about their overall change in net worth over the past 12 months – by net worth we mean net assets less outstanding debts.
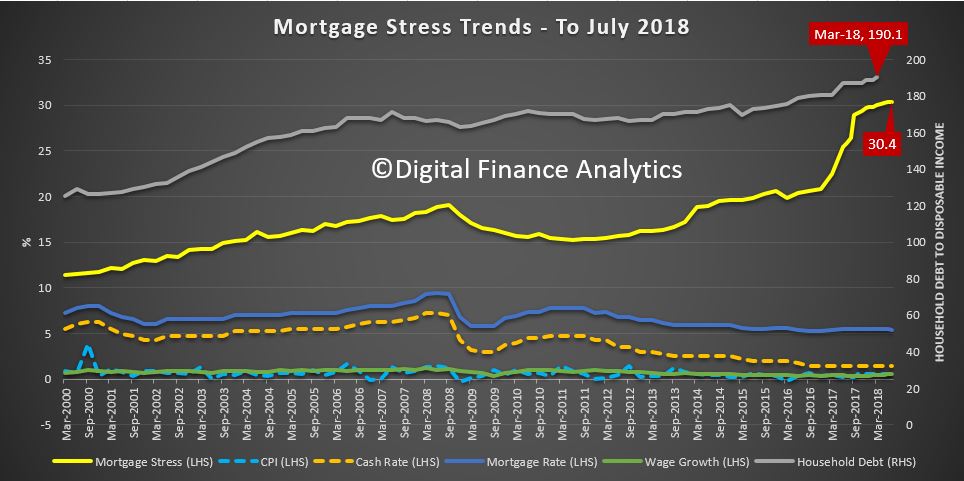
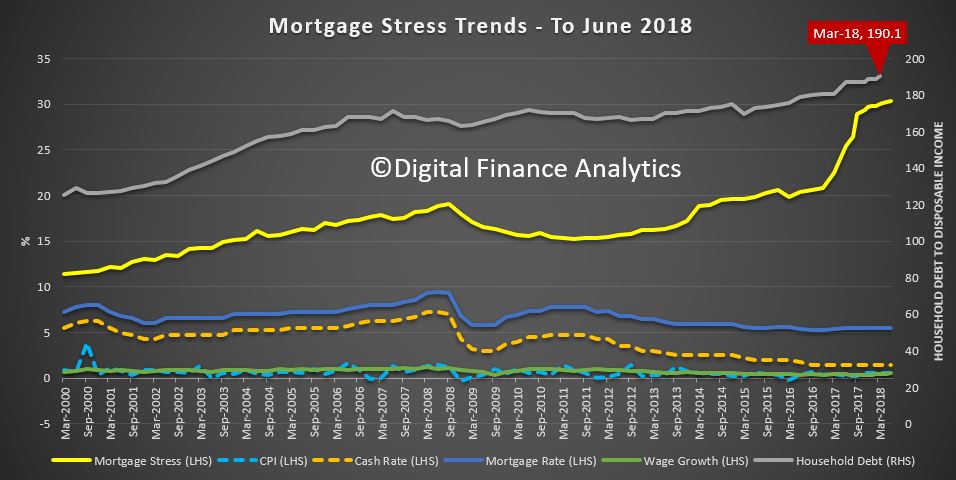
Digital Finance Analytics (DFA) has released the July 2018 mortgage stress and default analysis update. The latest RBA data on household debt to income to March reached a new high of 190.1[1], and CBA today said in their results announcement ”there has been an uptick in home loan arrears as some households experienced difficulties with rising essential costs and limited income growth, leading to some pockets of stress”.
So no surprise to see mortgage stress continuing to rise. Across Australia, more than 990,000 households are estimated to be now in mortgage stress (last month 970,000). This equates to 30.4% of owner occupied borrowing households. In addition, more than 23,000 of these are in severe stress. We estimate that more than 57,900 households risk 30-day default in the next 12 months. We expect bank portfolio losses to be around 2.7 basis points, though losses in WA are higher at 5.1 basis points. We continue to see the impact of flat wages growth, rising living costs and higher real mortgage rates.
Martin North, Principal of Digital Finance Analytics says “households remain under pressure, with many coping with very large mortgages against stretched incomes, reflecting the over generous lending standards which existed until recently. Some who are less stretched are able to refinance to cut their monthly repayments, but we find that the more stretched households are locked in to existing higher rate loans”.
“Given that lending for housing continues to rise at more than 6% on an annualised basis, household pressure is still set to get more intense. In addition, prices are falling in some post codes, and the threat of negative equity is now rearing its ugly head”.
“The caustic formula of coping with rising living costs – notably child care, school fees and fuel – whilst real incomes continue to fall and underemployment is causing significant pain. Many households have larger mortgages, thanks to the strong rise in home prices, especially in the main eastern state centres, and now prices are slipping. While mortgage interest rates remain quite low for owner occupied borrowers, those with interest only loans or investment loans have seen significant rises. Many are dipping into savings to support their finances.”
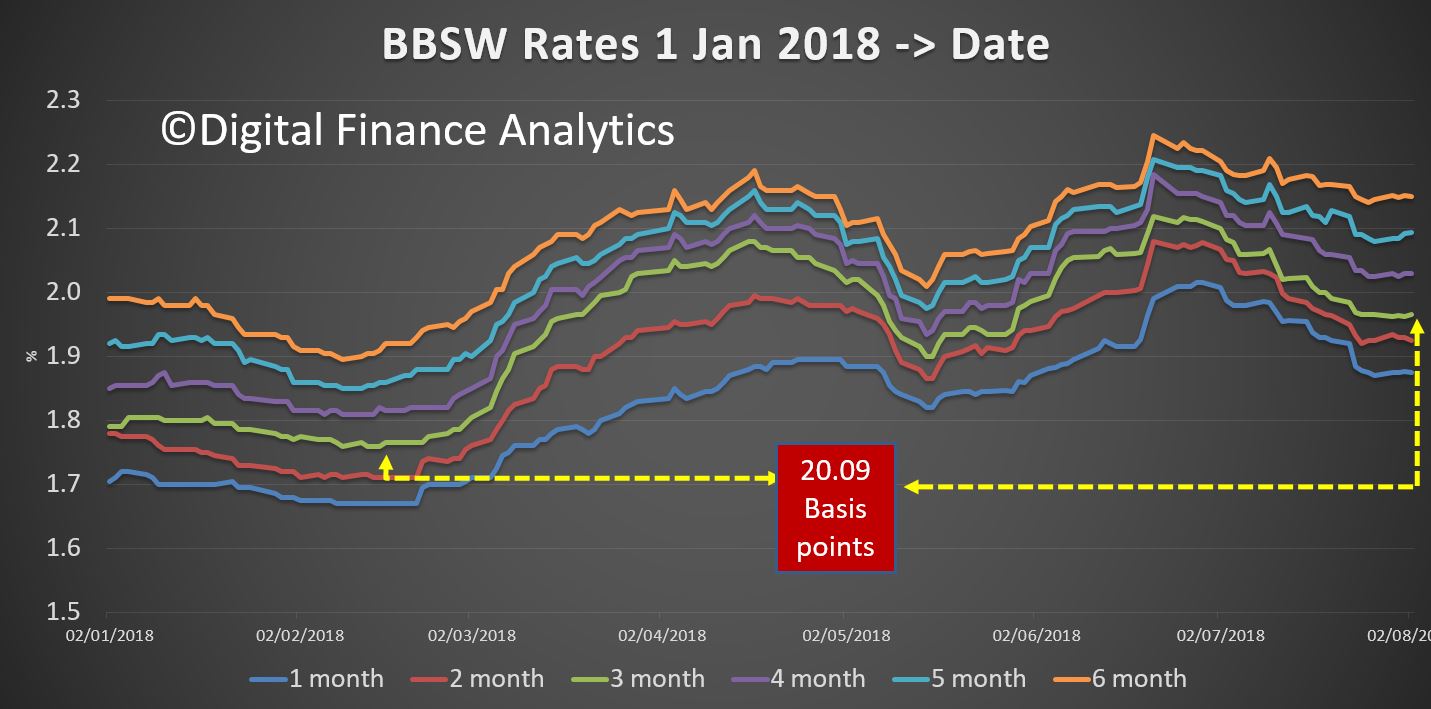
Recent easing interest rate pressures on the banks has decreased the need for them to lift rates higher by reference to the Bank Bill Swap Rates (BBSW), despite the fact that a number of smaller players have done so already.
Our analysis uses the DFA core market model which combines information from our 52,000 household surveys, public data from the RBA, ABS and APRA; and private data from lenders and aggregators. The data is current to end June 2018. We analyse household cash flow based on real incomes, outgoings and mortgage repayments, rather than using an arbitrary 30% of income.
Households are defined as “stressed” when net income (or cash flow) does not cover ongoing costs. They may or may not have access to other available assets, and some have paid ahead, but households in mild stress have little leeway in their cash flows, whereas those in severe stress are unable to meet repayments from current income. In both cases, households manage this deficit by cutting back on spending, putting more on credit cards and seeking to refinance, restructure or sell their home. Those in severe stress are more likely to be seeking hardship assistance and are often forced to sell.
Probability of default extends our mortgage stress analysis by overlaying economic indicators such as employment, future wage growth and cpi changes. Our Core Market Model also examines the potential of portfolio risk of loss in basis point and value terms. Losses are likely to be higher among more affluent households, contrary to the popular belief that affluent households are well protected.
The outlined data and analysis on mortgage stress does not occur in a vacuum. The revelations from the Royal Commission into Misconduct in the Banking, Superannuation and Financial Services Industry (the Commission) have highlighted deep issues in the regulatory environment that have contributed to the household debt “stress bomb”. However, most of the media commentary on the regulatory framework has been superficial or poorly informed. For example, several commentators have strongly criticised the Australian Securities and Investments Commission (ASIC) for not doing enough but have failed to explain what ASIC has in fact done, and what it ought to have done.
The Commission has highlighted major concerns regarding the law and practice of responsible lending. North has published widely on responsible lending law, standards and practices over the last 3-4 years, and continues to do so. Her latest work (which is co-authored with Therese Wilson from Griffith University) outlines and critiques the responsible lending actions taken ASIC from the beginning of 2014 until the end of June 2017. This paper was published by the Federal Law Review, a top ranked law journal, this month. A draft version of the paper can be downloaded at https://ssrn.com/author=905894.
The responsible lending study by North and Wilson found that ASIC proactively engaged with lenders, encouraged tighter lending standards, and sought or imposed severe penalties for egregious conduct. Further, ASIC strategically targeted credit products commonly acknowledged as the riskiest or most material from a borrower’s perspective, such as small amount credit contracts (commonly referred to as payday loans), interest only home loans, and car loans. North suggests “ASIC deserves commendation for these efforts but could (and should) have done more given the very high levels of household debt. The area of lending of most concern, and that ASIC should have targeted more robustly and systematically, is home mortgages (including investment and owner occupier loans).”
Reported concerns regarding actions taken by the other major regulator of the finance sector, the Australian Prudential Regulation Authority (APRA), have been muted so far. However, an upcoming paper by North and Wilson suggests APRA (rather than ASIC) should be the primary focus of regulatory criticism. This paper concludes that “APRA failed to reasonably prevent or constrain the accumulation of major systemic risks across the financial system and its regulatory approach was light touch at best.”
Stress by The Numbers.
Regional analysis shows that NSW has 267,298 households in stress (264,737 last month), VIC 279,207 (266,958 last month), QLD 174,137 (172,088 last month) and WA has 132,035 (129,741 last month). The probability of default over the next 12 months rose, with around 11,000 in WA, around 10,500 in QLD, 14,500 in VIC and 15,300 in NSW.
The largest financial losses relating to bank write-offs reside in NSW ($1.3 billion) from Owner Occupied borrowers) and VIC ($943 million) from Owner Occupied Borrowers, which equates to 2.10 and 2.7 basis points respectively. Losses are likely to be highest in WA at 5.1 basis points, which equates to $744 million from Owner Occupied borrowers.
Top Post Codes By Stressed Households
[1] RBA E2 Household Finances – Selected Ratios March 2018
You can request our media release. Note this will NOT automatically send you our research updates, for that register here.
[contact-form to=’mnorth@digitalfinanceanalytics.com’ subject=’Request The July 2018 Stress Release’][contact-field label=’Name’ type=’name’ required=’1’/][contact-field label=’Email’ type=’email’ required=’1’/][contact-field label=’Email Me The July 2018 Media Release’ type=’radio’ required=’1′ options=’Yes Please’/][contact-field label=”Comment If You Like” type=”textarea”/][/contact-form]
Note that the detailed results from our surveys and analysis are made available to our paying clients.
Single-parent families are experiencing a near-unprecedented level of housing stress as soaring house prices force many into unaffordable rental properties.
Analysis conducted by the Melbourne Institute as part of its annual HILDA survey revealed over 20 percent of single-parent families are stretching their budgets further than ever to keep up with annual rent rises or changes in their mortgage.
Amongst all Australians, household stress peaked at an all-time high in 2012, when 11.2 percent of all Australians were classified as having to make “unduly burdensome” mortgage repayments.
In economic terms, housing stress is technically defined as spending more than 30 percent of a household’s disposable income on housing costs, not including council rates.
In 2016, where the HILDA survey data ends, 9.6 percent of the population were experiencing housing stress.
Although single-parent families were found to be under the most dire levels of housing stress, the survey found that single elderly Australians and renters are also suffering under the weight of paying rent or covering their mortgage.
Couples without children were found to have the lowest levels of housing stress.
“Among those with housing costs, private renters have the highest rate of housing stress and owners with mortgages have the lowest rate,” wrote HILDA survey researchers.
“Moreover, over the HILDA Survey period, housing stress has increased considerably among renters—particularly renters of social housing—whereas it has decreased slightly for home owners with a mortgage.”
The survey also found that the type of home you owned or rented was directly correlated to the likelihood of having difficulty in making rent or mortgage repayments.
Australians living in apartments were found to have the highest rates of housing stress, followed by those living in semi-detached houses.
People living in separate, free-standing homes were found to have the lowest rates of housing stress – most likely because they live away from heavily-populated urban centres.
“Housing stress is generally more prevalent in the mainland capital cities, with Sydney in particular standing out,” wrote the researchers.
“However, differences across regions are perhaps not as large as one might expect given the differences in housing costs across the regions.
“Also notable is that housing stress is very high in other urban Queensland. It is only in the last sub-period (2013 to 2016) that it is not the region with the highest rate of housing stress, and even in that period only Sydney has a higher rate.”
The HILDA survey follows the lives of more than 17,000 Australians over the course of their lifetimes and published information on an annual basis on many aspects of their lives including relationships, income, employment, health and education.
The latest findings back up analysis from Digital Finance Analytics (DFA), which estimates that more than 970,000 Australian households are now believed to be suffering housing stress.
That equates to 30.3 percent of home owners currently paying off a mortgage.
Of the 970,000 households, DFA estimates more than 57,100 families risk 30-day default on their loans in the next 12 months.
“We continue to see households having to cope with rising living costs – notably child care, school fees and fuel – whilst real incomes continue to fall and underemployment remains high,” wrote DFA principal Martin North.
“Households have larger mortgages, thanks to the strong rise in home prices, especially in the main eastern state centres, and now prices are slipping.
“While mortgage interest rates remain quite low for owner occupied borrowers, those with interest only loans or investment loans have seen significant rises.”

 In addition, more than 22,000 of these are in severe stress. We estimate that more than 61,000 households risk 30-day default in the next 12 months. We continue to see the impact of flat wages growth, rising living costs and higher real mortgage rates. Bank losses are likely to rise a little ahead.
 Probability of default extends our mortgage stress analysis by overlaying economic indicators such as employment, future wage growth and cpi changes. Our Core Market Model also examines the potential of portfolio risk of loss in basis point and value terms. Losses are likely to be higher among more affluent households, contrary to the popular belief that affluent households are well protected. This is shown in the segment analysis, with some more wealthy households up against it.
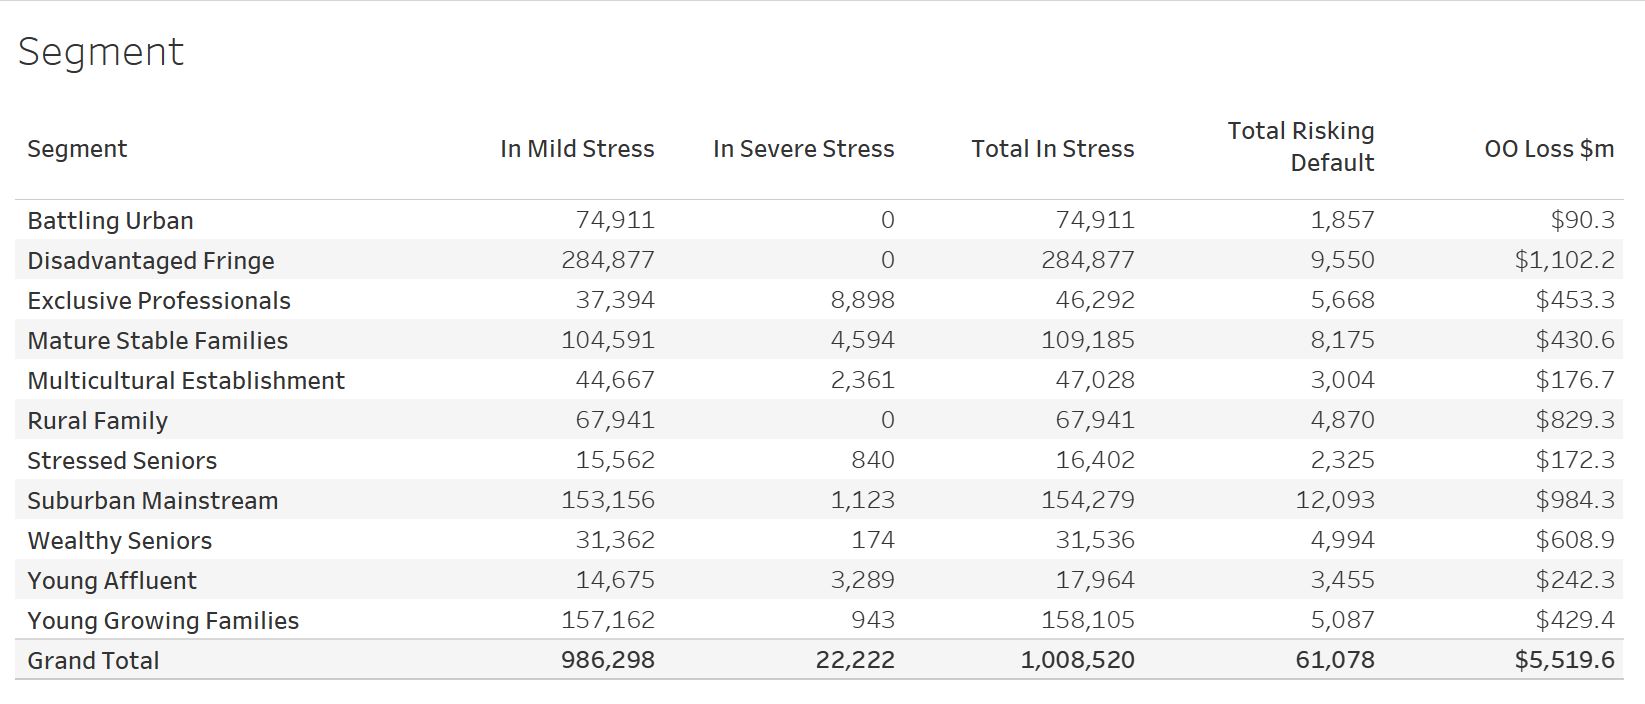 Regional analysis shows that NSW has 272,536 households in stress (276,132 last month), VIC 281,922 (276,926 last month), QLD 178,015 (176,528 last month) and WA has 132,827 (132,700 last month). The probability of default over the next 12 months rose, with around 11,630 in WA, around 11,300 in QLD, 15,200 in VIC and 16,200 in NSW.
 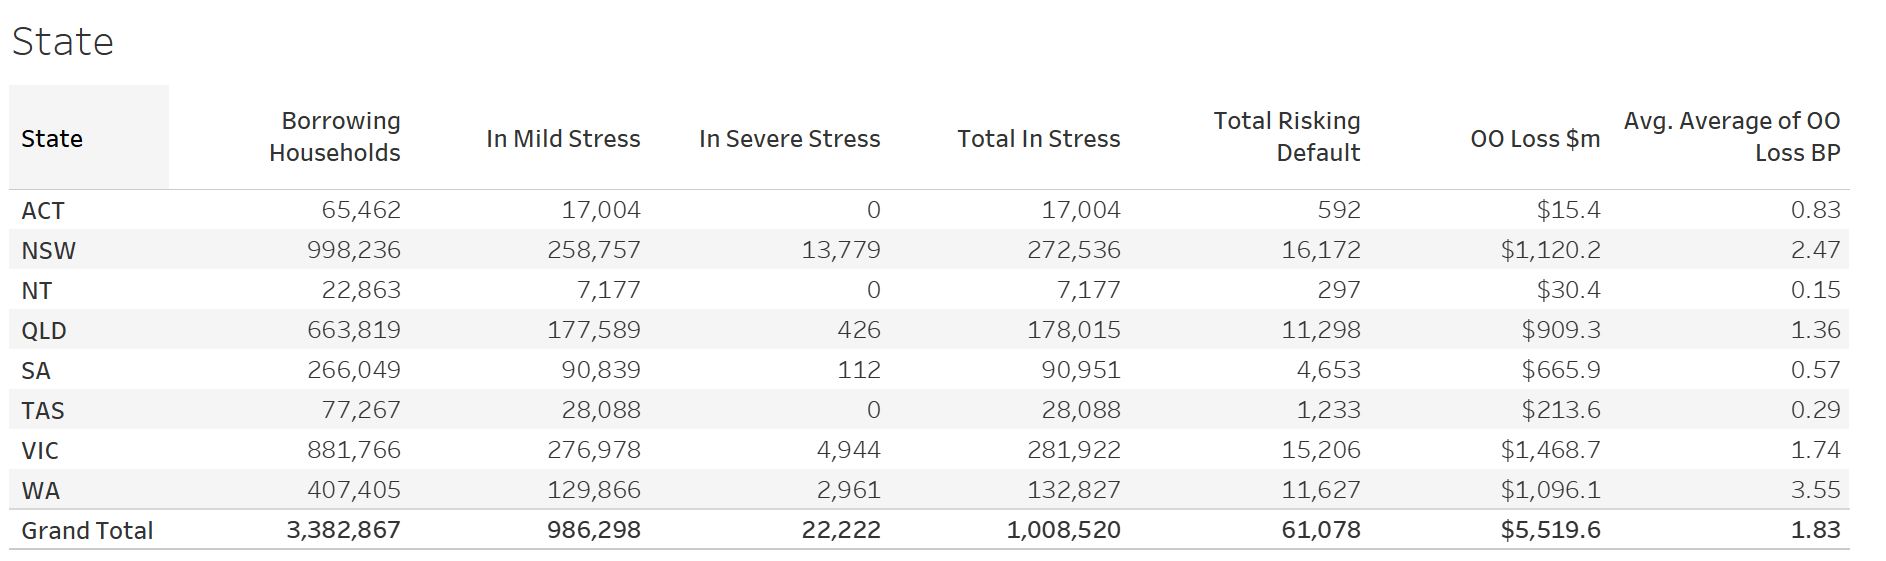 The largest financial losses relating to bank write-offs reside in NSW ($1.1 billion) from Owner Occupied borrowers) and VIC ($1.74 billion) from Owner Occupied Borrowers, though losses are likely to be highest in WA at 3.6 basis points, which equates to $1,096 million from Owner Occupied borrowers.
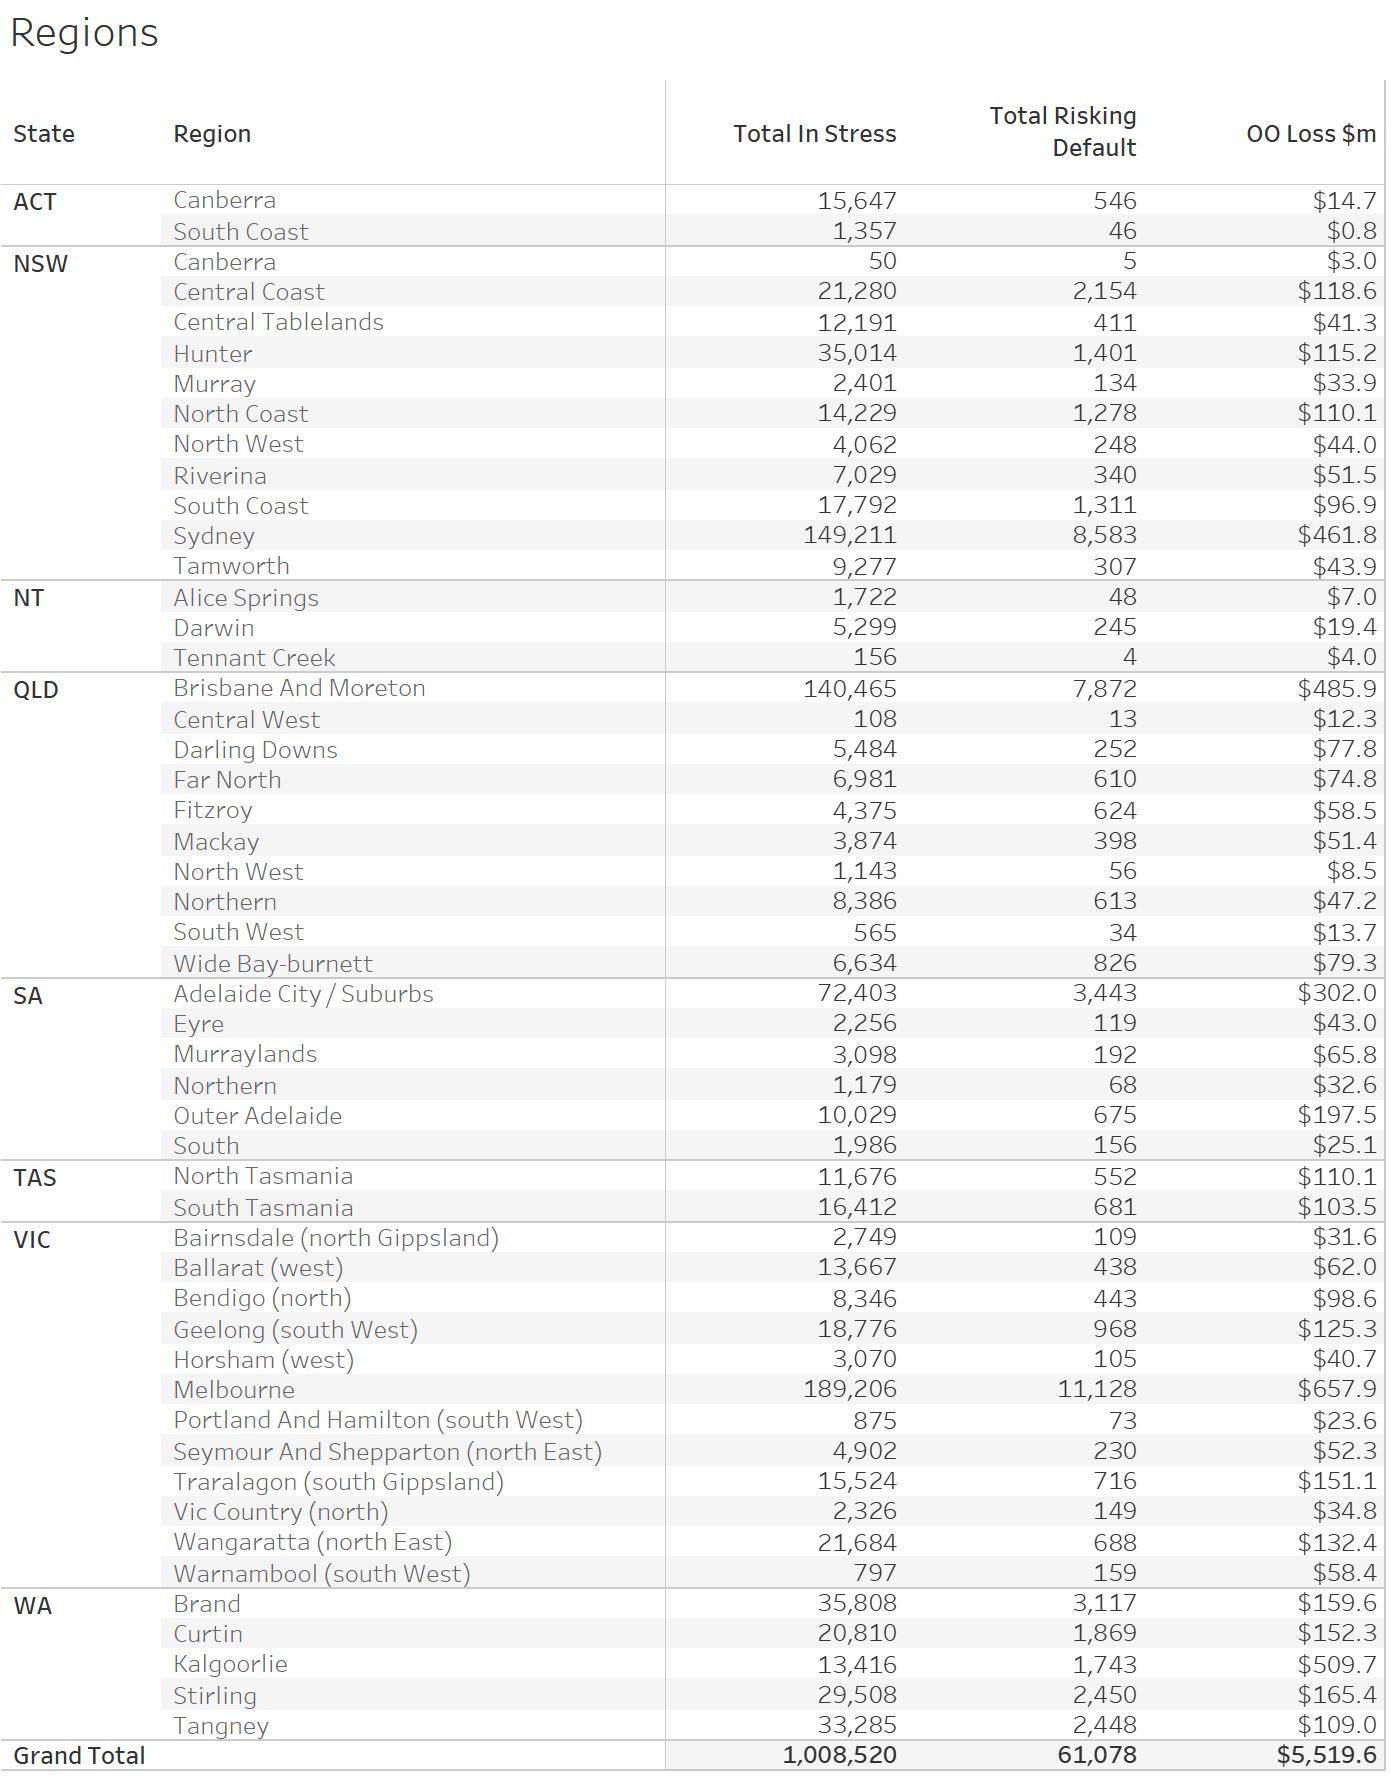 Turning to the post codes with the largest counts of households in stress, fifth was Melbourne suburb Berwick and Harkaway, 3806, with 5,267 households in stress and 143 risking default.