In the current discussions about macroprudential, stimulated by the RBA comments last week and likely to be stoked further as the RBA appears before the Senate Banking Committee on Thursday, many are claiming that household balance sheets and incomes are supporting the growth in house prices, and so no intervention is needed. The chair of the Banking Committee Sam Dastyari is “concerned about the unanticipated consequences of the Reserve Banks’s view-change on the sustainability of the housing boom and whether it needed to interfere with bank lending”.
The debate has shifted to first time buyers, and not wishing to put further barriers in the way of the small number able to enter the market at prices which are already too high. They may be missing the point. First, the increase in household wealth is directly linked to the rise in house prices (a weird piece of feedback here, as prices rise, households are more wealthy, so can accommodate higher prices – spot the chicken and egg problem?). In addition, wealth is growing thanks to stock market movements (though down recently) driven partly by the US and European low rates and printing money strategies. This will reverse as rates are moved to more normal levels later. Superannuation, the third element is of course savings for retirement, so cannot be touched normally (there are exceptions, and no, first time buyers should not be allowed to use their super to get into the property market). More first time buyer incentives won’t help.
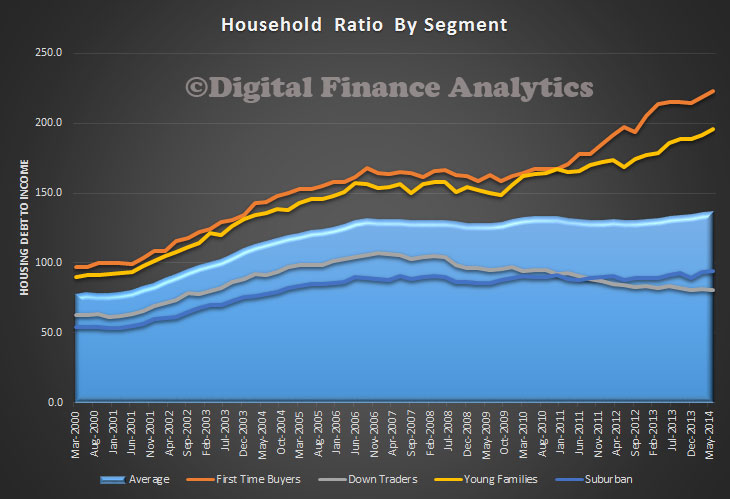
But, we have been looking at household incomes, after inflation, at a segment level. We segment based on property ownership, and you can read about the DFA segments here. On average, across all households, income growth is falling behind inflation. This is the ABS data from June 2014. In the past few months, real income is going backwards, before we consider rising costs of living.
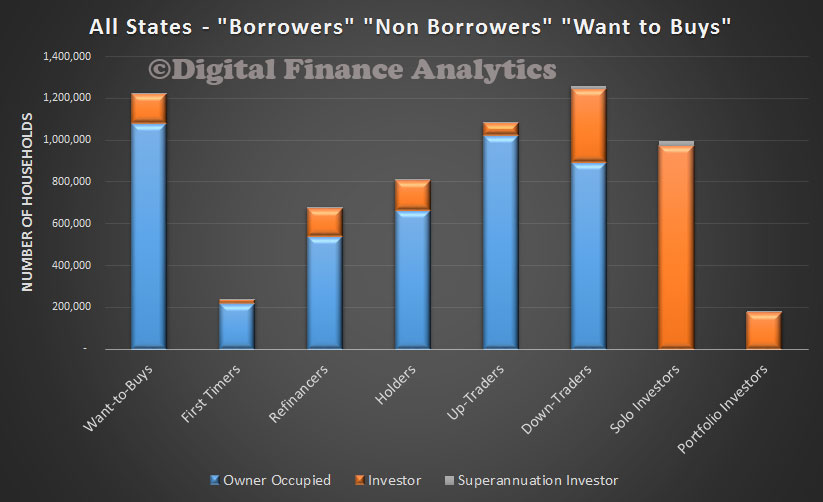
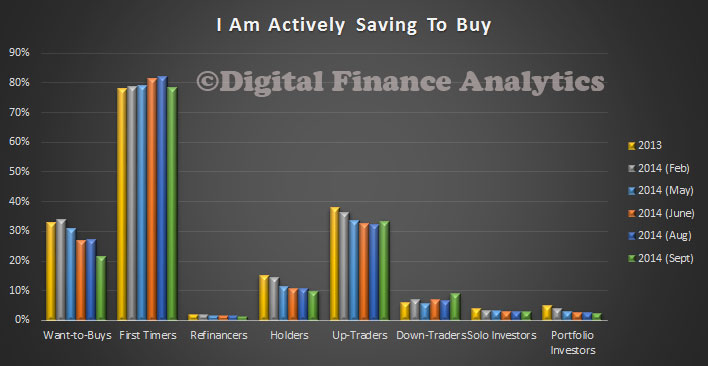
 However, at a segment level, the situation is even more interesting, and diverse. Those wanting to buy, but unable to enter the market are seeing their incomes falling sharply, inflation adjusted, making the prospect of buying a house more unlikely. We are seeing the number of households in this group rising steadily, see our Property Imperative Report.
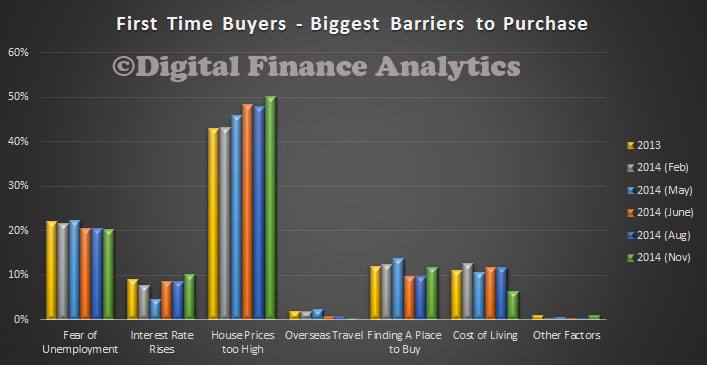
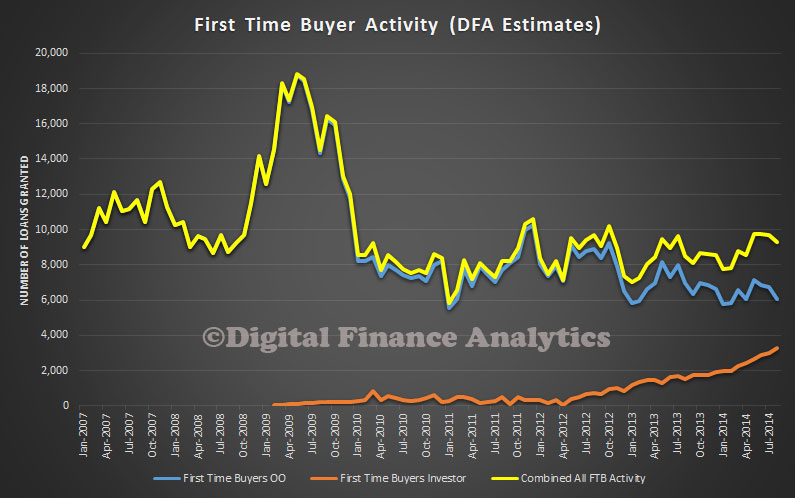
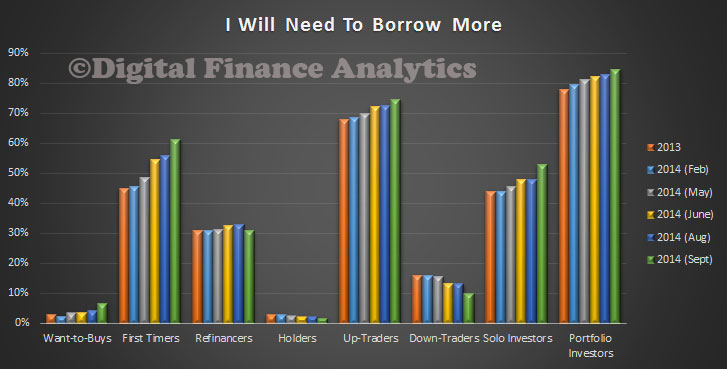
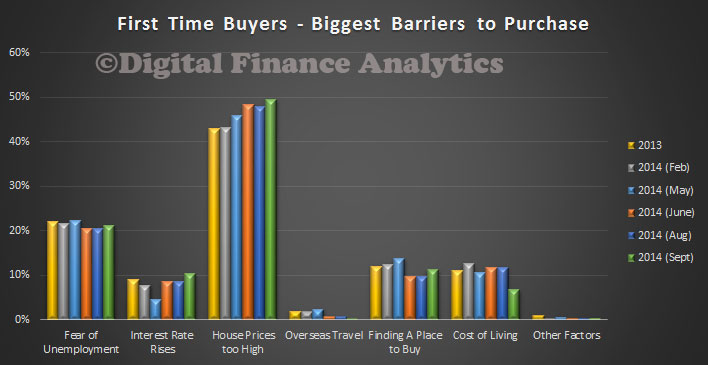
 First time buyers, those who have, or are purchasing for the first time, are also seeing income falling in real terms, more sharply than the average. This is why we are predicting a higher proportion of first time buyers will get into mortgage stress, especially if interest rates are increased. This is one reason why loan to income ratios for this group are high.
 Then looking at holders, their incomes are moving closer to the average. Holders have no plans to change their property, many have mortgages.
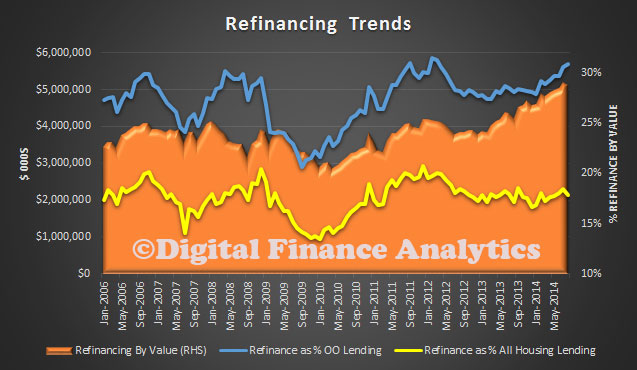
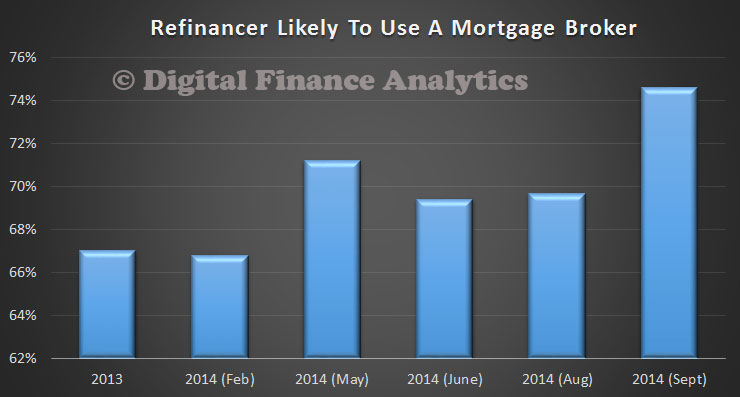
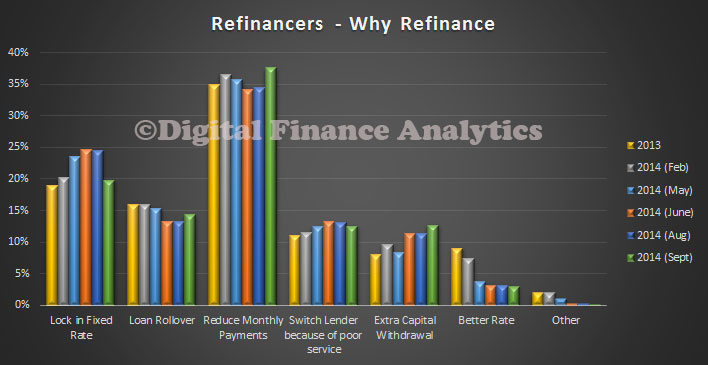
 Refinancers, are hoping to lock in lower rates, though we note the forward rates are now higher than they were, which may suggest the lowest deals are evaporating. One of the prime motivations for switching in this segment is to reduce outgoings, not surprising when we see incomes falling faster than the average in real terms.
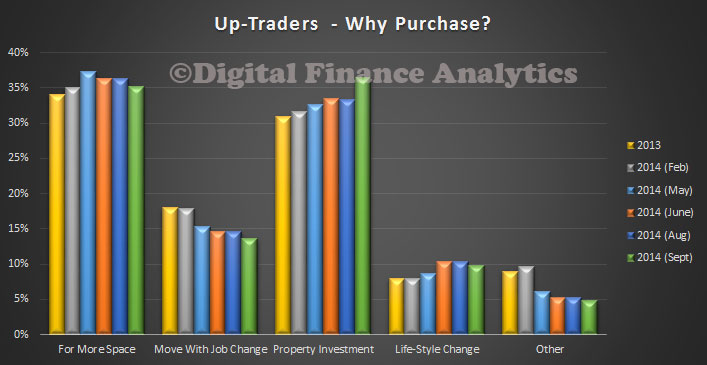
 Now, looking at Up Traders, we find their incomes are rising more quickly than the average. Up Traders have been active recently. They have the capacity to service larger loans. They will be purchasing primarily for owner occupation.
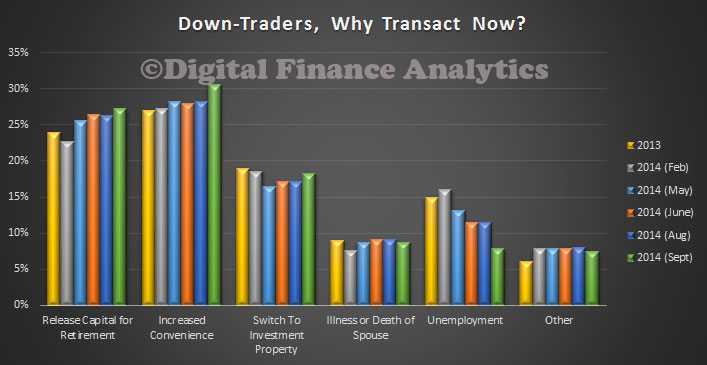
 Down Traders have incomes rising more quickly, thanks to investment income, and there still about one million households looking to sell and move into a smaller property, releasing capital in the process. They are also active property investors, directing some of their released capital in this direction, either direct, or via super funds.
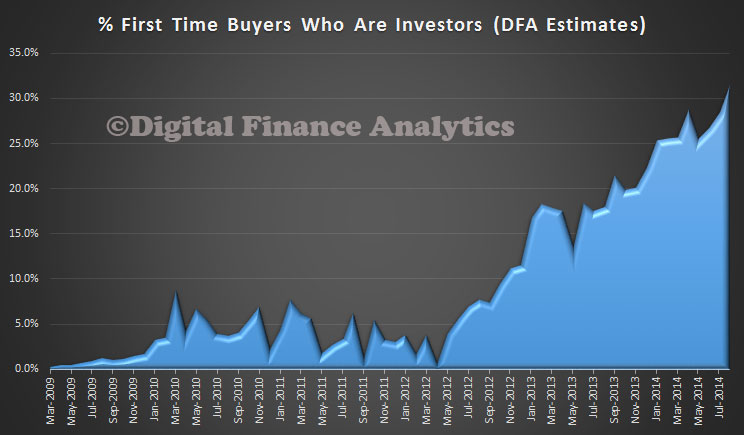
 Investors also have incomes which are rising faster than the average, so no surprise they are active in the market, seeking yields higher than deposits, and taking advantage of negative gearing. We continue to see a small but growing number of investors using super funds for the transaction.
 So, the segmental analysis highlights how complex the market is, and that there are no easy fixes. Any rise in interest rates would hit first time buyers very hard. Demand from investors (the foreign investment discussions is only a sideshow in my view) will be sustained, with the current policy settings. Raising interest rates will not help much on this front, because interest will be set against income. So macroprudential controls on investment loans makes more sense.
One option would be to differentially increase the capital buffers the banks hold for investment loans, making their pricing less aggressive, and the banks more willing to lend to suitable owner occupiers and businesses, which is what we need. Trimming demand for investment properties may help to control prices.
The bottom line though is that many years of poor policy are coming home to roost, on both the supply and demand side. A number of settings need to be changed, as discussed before.

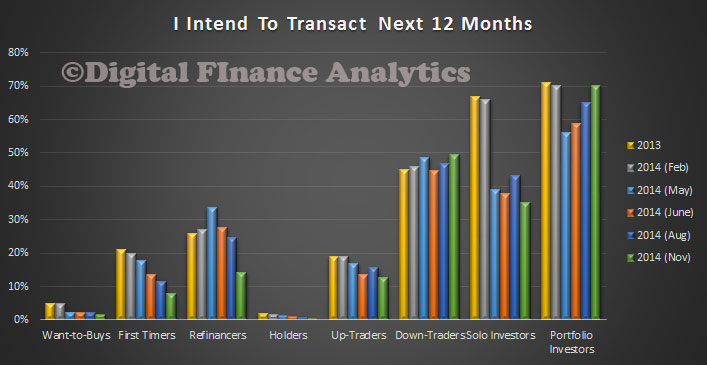
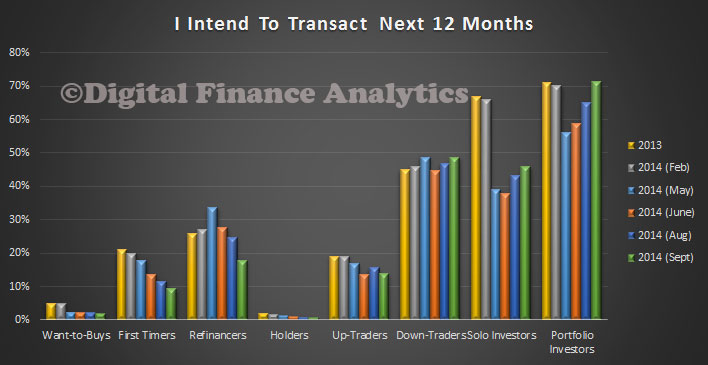
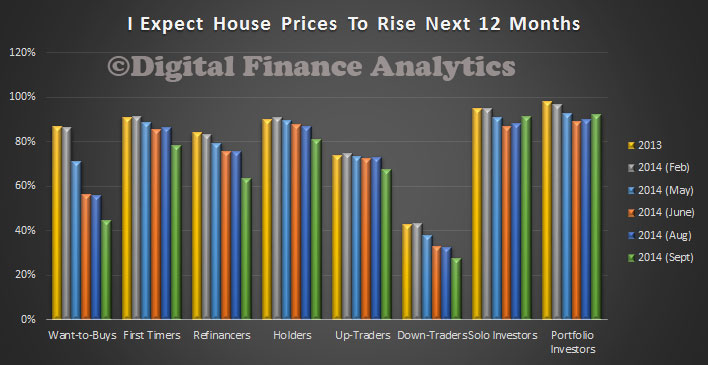
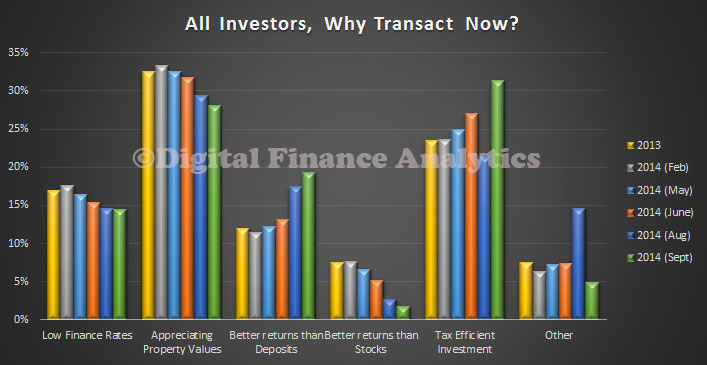
 Looking at solo investors in particular, they are driven by tax efficiency, and expectation of appreciating property values. They see net returns from property a better bet than deposits.
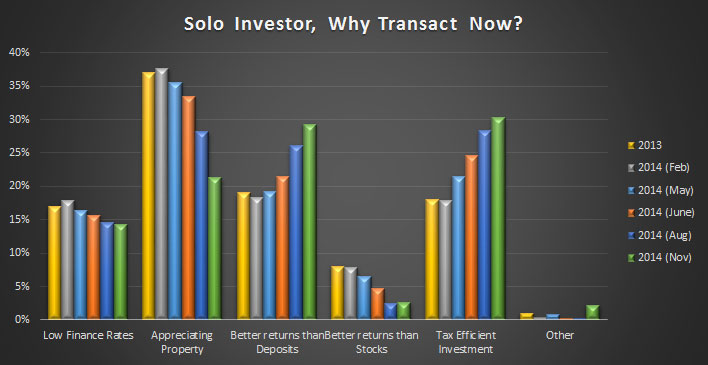 The picture for portfolio investors is somewhat similar. They are move motivated by the hope of appreciating values than solo investors and the tax advantages of leveraged property investment.
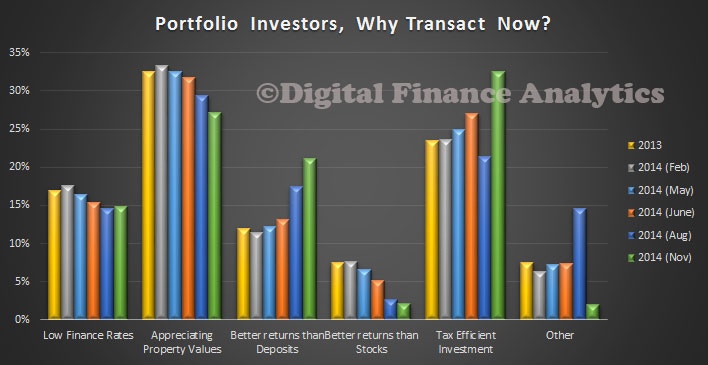 Those investors considering investing in property via a SMSF wrapper, are clearly driven by tax strategies and the expectation of rising property values.
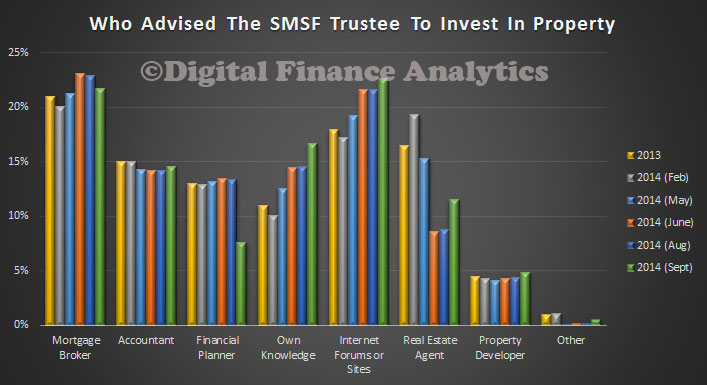
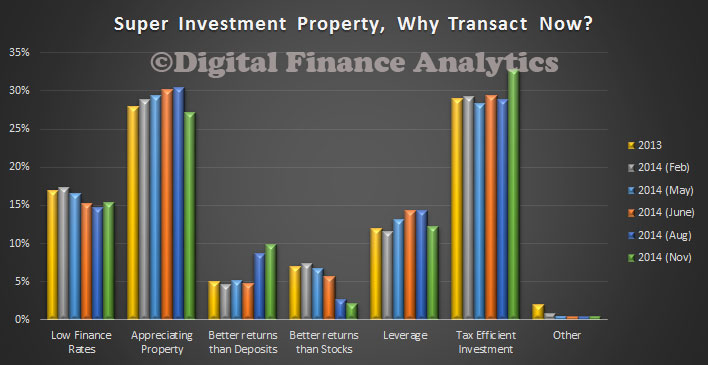 We see these SMSF investors are getting their advice from a number of sources, mortgage brokers, and internet sites have the greatest impact, and we noted a rise in advice from real estate agents as an influence. (In this survey, investors could score multiple advice sources).
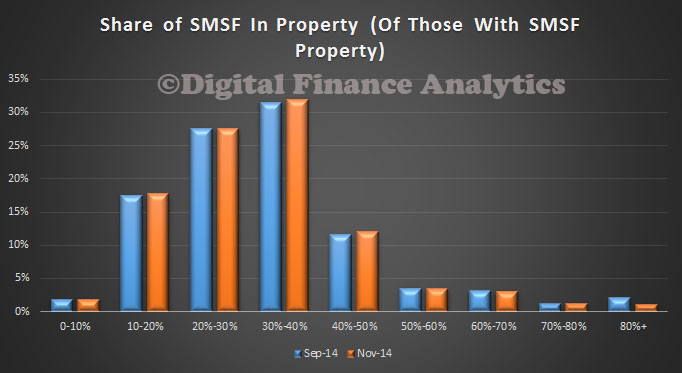
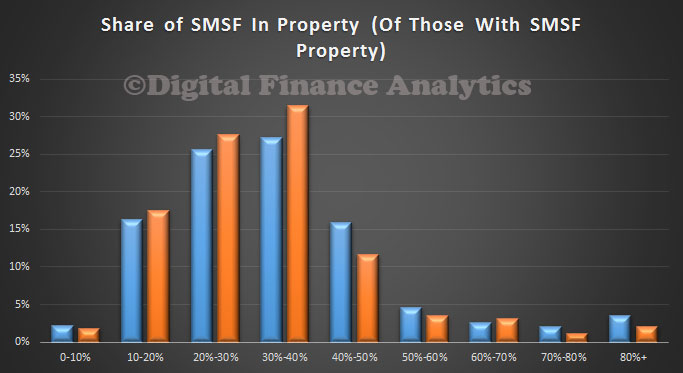
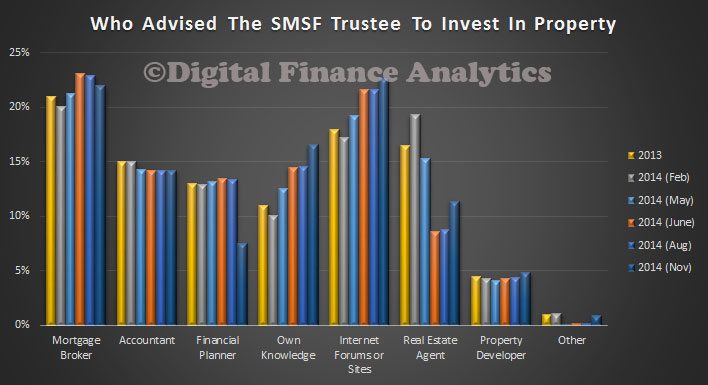 Finally, we asked about the property distribution within a SMSF, and the greatest proportion is between 20 and 40 per cent of the portfolio.