RBA On ‘Emergency Liquidity Injections’

The RBA released “Research Discussion Paper – RDP 2019-10 Emergency Liquidity Injections” by Nicholas Garvin.

Here is the non-technical summary.

Understanding liquidity crises has long been, and will probably long be, an important objective for economic policymakers. Liquidity risk is inherent to banking systems because banks fund long-term assets (like mortgages) with short-term and at-call debt (like deposits). This process benefits the economy by making more credit available for households and businesses. However, it also generates the risk that if short-term debtholders withdraw their funds en masse, banks are unlikely to be able to pay them. This paper contributes to the research literature that studies how a policymaker can handle such a situation, which broad monetary stimulus is not designed for, by modelling the scenario faced by the United States and other global financial centres in late 2008. This type of situation appears highly unlikely in Australia in the foreseeable future.

The model depicts a banking system that is solvent, but a system-wide withdrawal by debtholders leaves banks with short-term payment obligations that exceed their available funds (i.e. their liquidity). It is then in the policymaker’s interests to inject liquidity into the banking system, which can prevent bank failures and the harm to the economy that would likely follow. However, injecting liquidity incentivises banks to take more liquidity risk the next time around, which makes future liquidity crises more likely. This paper compares different types of liquidity injection policies by where they sit in the trade-off between the perverse incentives generated, and the ability to support the banking system during a crisis.

To address the subject, I develop a game-theoretic model in which banks decide how many liquid assets to hold as protection against funding withdrawals. Banks consider the losses they would suffer if a crisis eventuated, which depend on the type of liquidity injection policy implemented by the policymaker. If a crisis eventuates, the type of policy also influences how the crisis unfolds. By placing a particular type of policy into the model, we can therefore analyse that policy’s influence on banks’ risk-taking decisions and on crisis outcomes. The model replicates some features of liquidity injection policies highlighted previously in the research literature. It also generates two new insights, which are the paper’s main contributions.

The first insight is that, if the policymaker injects liquidity by lending to banks, there is an indirect benefit of requiring them to provide collateral. The benefit arises through the (secondary) markets for the securities that the policymaker accepts as collateral. In the model, the crisis is characterised by falling prices in these markets, driven by selling pressure from the banks that need more cash. However, banks cannot sell securities that they are providing as collateral. Collateral requirements can therefore alleviate ‘fire sales’ in these markets, which benefits other banks through the higher market prices. In aggregate, the banking system ends up better off after the crisis, but, for each individual bank, there is no increase in the return to taking more liquidity risk.

The second insight is about whether a policymaker can disincentivise risk-taking by charging high ‘penalty’ interest rates on its emergency lending. Farhi and Tirole (2012) argue that, regardless of the effects on banks’ incentives, once a crisis occurs, the policymaker will then offer low rates. This is because the risk-taking that caused the crisis has already taken place, and charging banks penalty rates could now put them in further distress. Therefore, banks view any claims by the policymaker that it would charge penalty rates in a crisis as not credible, so such claims are powerless to influence risk-taking. I present a counterargument: penalty rates can be credible if the emergency loans are long term. In the crisis I model, banks are in liquidity distress but they are still solvent (i.e. they have not run out of capital). This means they will have no trouble making the repayments once liquidity conditions in the banking system improve. Charging banks penalty rates on long-term loans during a crisis will therefore not put them in further distress, which gives penalty rates more credibility.

Household Financial Confidence Crushed Some More

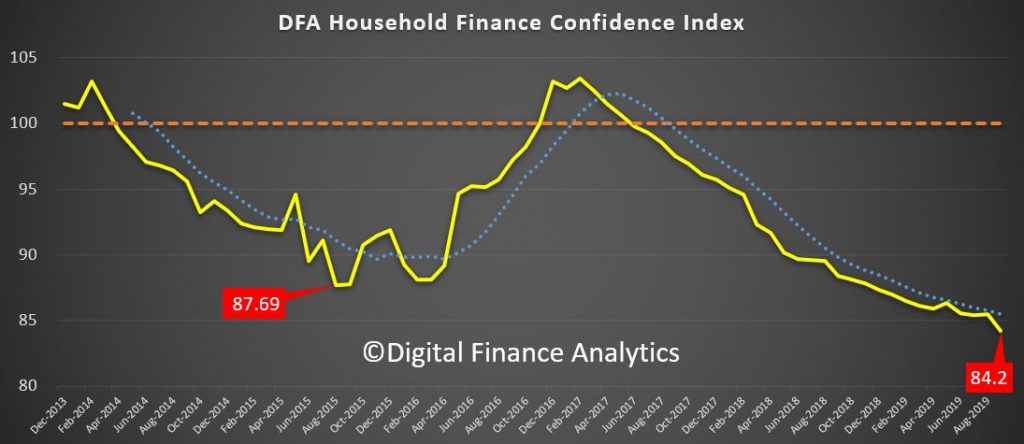
In our latest release to September 2019, the DFA Household Financial Confidence Index fell again, having move sideways more recently. In essence households are simply reflecting that rate cuts, a lower dollar and the international bad news from Trump’s Trade Wars, Brexit and Hong Kong are all making them more concerned, and less willing or able to spend. On top of that the local pressure on wages and rising costs, plus the heavy toll on savers with funds on bank deposit are also hitting. Finally, property is not in recovery mode and buying intentions are down again, after being a little higher after the election. The economy is in deep trouble. The Government and Regulatory response is not cutting the mustard from a household and small business perspective.

Overall the index fell to a new low of 84.2, compared with 85.5 last time, this is a significant one month fall.

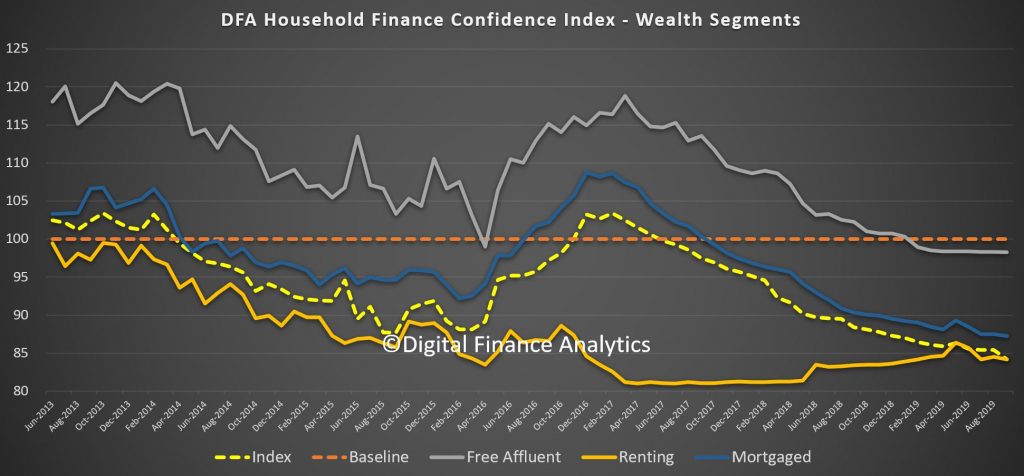
All wealth segments faded, but those holding property without mortgage, and with market investment (stocks and shares) did a little better than those with a mortgage and those renting. All three segments are below their 100 neutral setting.

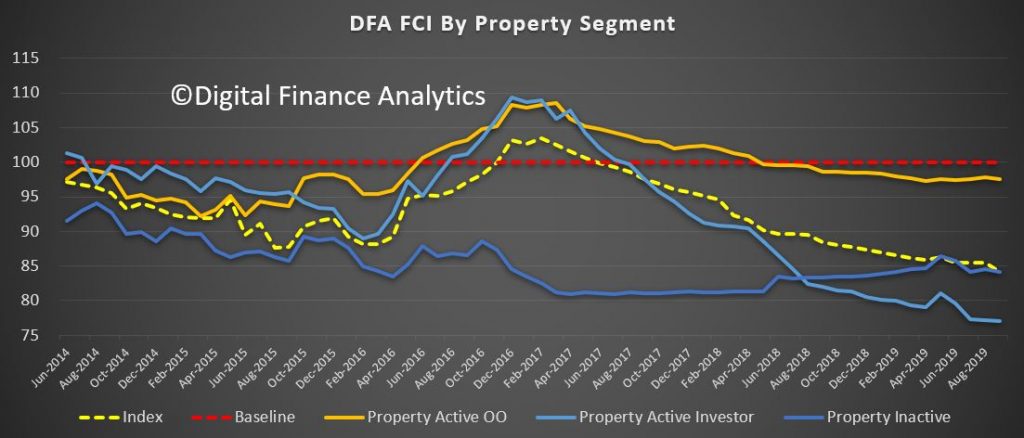
Across the property segments, those owner occupied households with a mortgage are relatively more positive compared with property investors who continue to see their rental streams under pressure, and now even those renting or living with family or friends are also reacting to costs of living rises, and flat incomes. We also registered a number who say landlords recently lifted their rental agreements, adding to the pain.

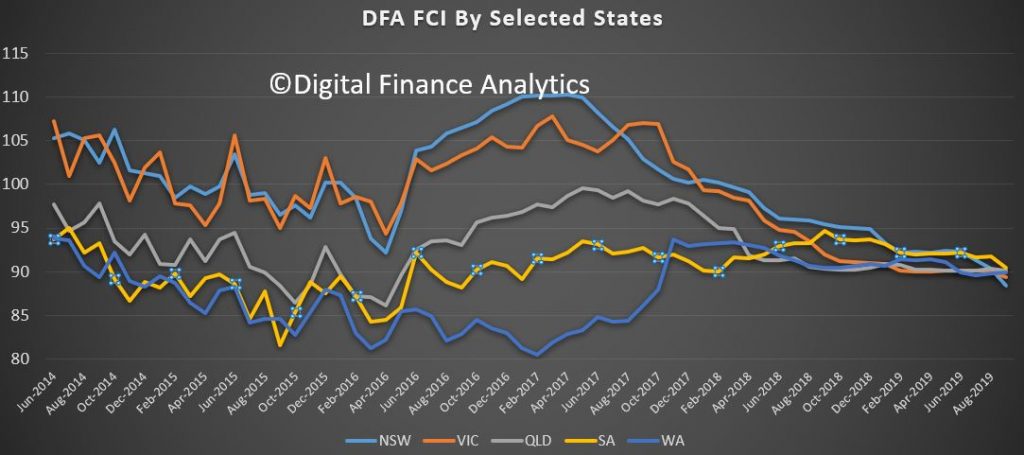
Across the states, the falls are relatively uniform, with the confidence levels bunching at low values in the eastern states. Falls in SA and QLD were offset by a slight rise in WA. But NSW and VIC both fell.

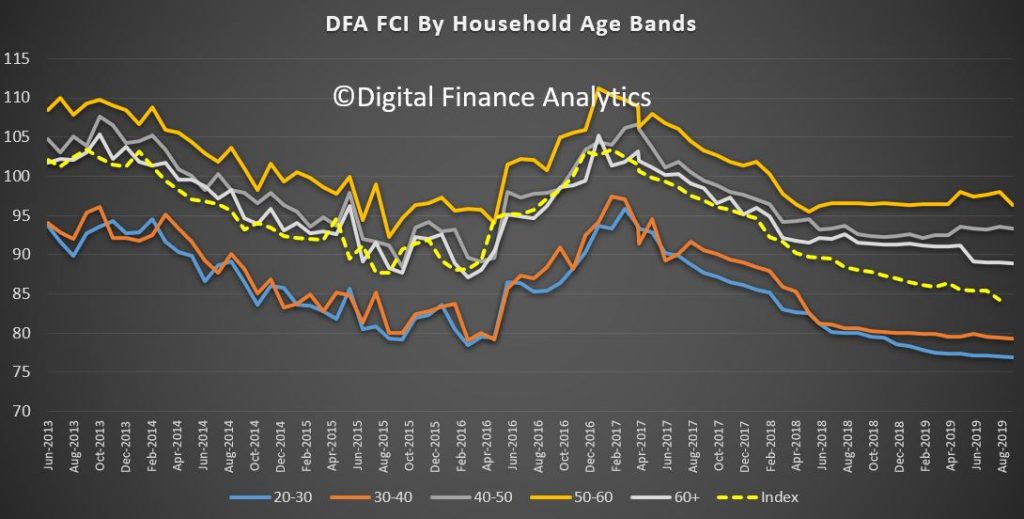
Across the age bands, those aged 50-60 registered a significant decline as falling income from bank deposits hit home following the recent cash rate cuts. All other segments fell too. This is a broad based decline.

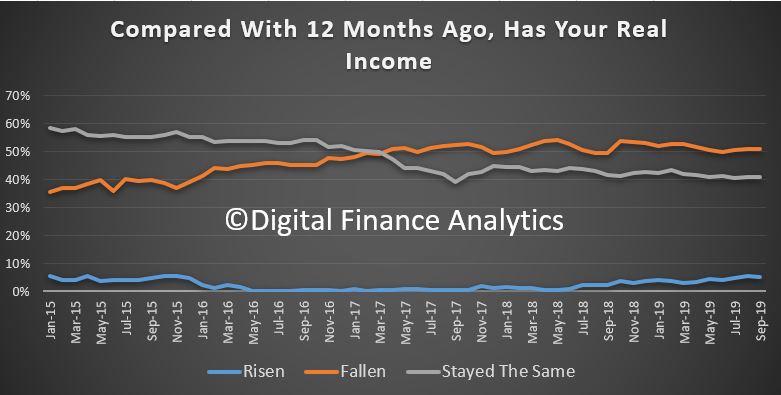
Turning to the moving parts, household incomes remain under pressure, with little evidence of any recovery in the system. More than half have real incomes lower than a year ago.

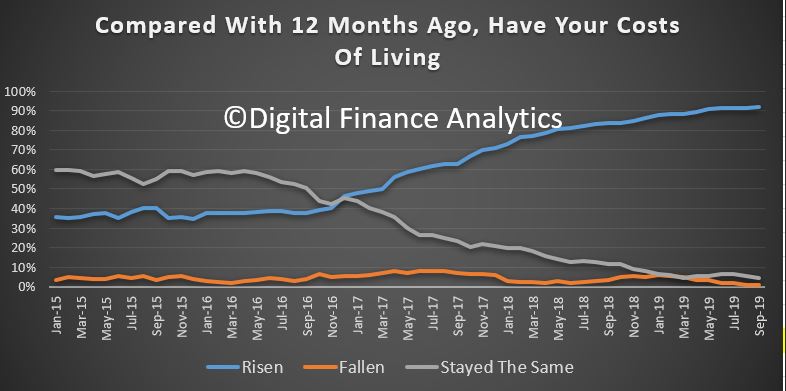
Costs of living continue to rise, and recent petrol prices are making an impact, along with council rates and childcare costs. Food bills are also rising and here the impact of the drought is hitting some costs hard now. 92% of households reported a rise in living costs compared with one year ago.

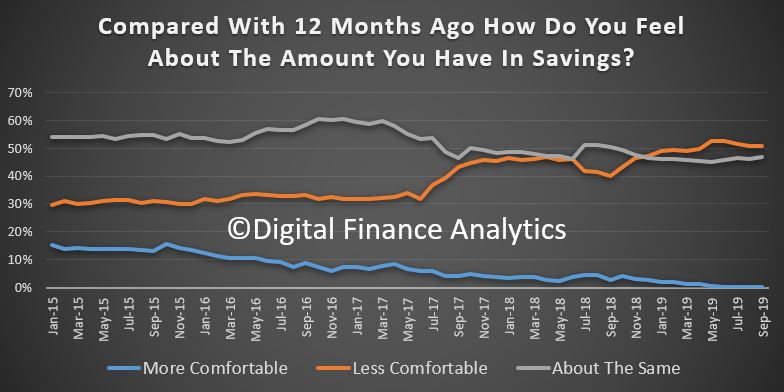
Savings are under pressure, as many households continue to tap into their savings to support their life-styles. But those with savings in bank deposits continue to see rates falling, meaning that incomes from deposits are being crushed. That said, of the 3 million relying on income from savings, less than one third are considering seeking out higher risk saving options to boost returns. The rest are moderating their spending patterns to suit the new low rate environment. However, there are limits to this approach as rates continue to tumble. Those on fixed term rates are facing a real challenge when their funds are due to roll next!

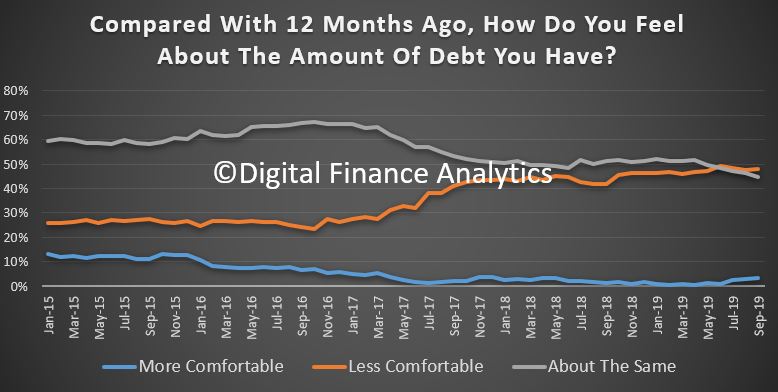
Rate cuts have helped at the margin, but there was a further rise in those feeling less comfortable about their level of debt. We see a rise in concern about making monthly repayments on time, but also an issue with paying off debt in due course (given home price growth is anemic at best). Many continue to pay down credit card debt, though a minority continue to accumulate more debt, in order to balance their budgets.

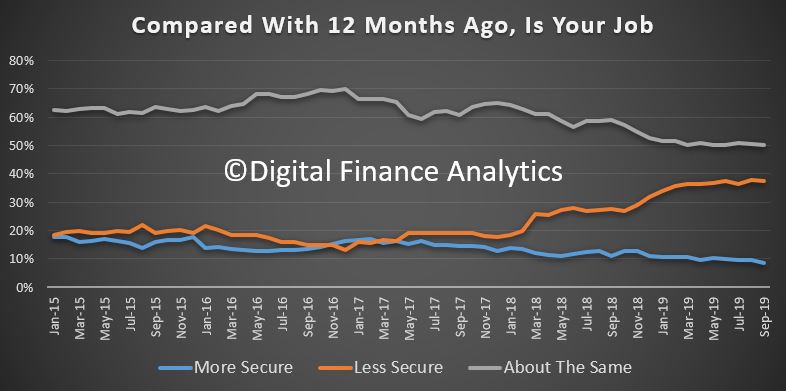
Employment prospects are under pressure in the retail and construction sectors, across all states. There was a 1% fall in those feeling more comfortable, to 8.6%. But there is a marked fall in NSW and VIC and there residential construction has stalled. Employment prospects are brighter in the Public Sector, so Canberra is showing more positive news here.

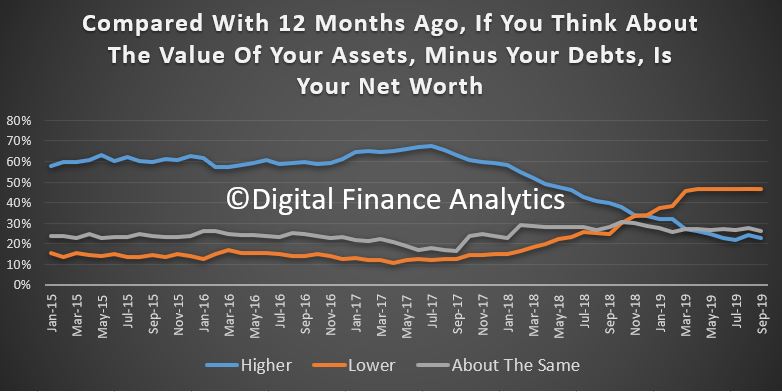
Finally, net worth has taken a hit again, as property values are not rising for many (and the evidence of negative equity is growing). The oft quoted recent rises in Sydney and Melbourne clearly do not tell the full story. Property investors with units across the country are increasingly nervous about the true value of their property in the light of the poor quality certification and construction issues which are rife in the sector.

So, there is really little here to offset the gloom. Whilst lower cash rates may translate to lower mortgage rates for some, this is not sufficient to counter the negative news. And more households are seeking to pay down debt in an attempt to protect themselves ahead.

This signals more economic weakness ahead.

GFC Lessons For Banks Remain Unlearned

On 7 October, the European Central Bank (ECB) published its liquidity stress test results for 103 euro area banks. ECB’s increased focus on stressed liquidity is credit positive for these banks. As the liquidity coverage ratio (LCR) has a very short 30-day horizon, ECB looking at liquidity stresses lasting six months provides a much more meaningful measure. The test results will be used to strengthen the liquidity risk assessment in the 2019 Supervisory Review and Evaluation Process (SREP), but will not have a direct effect on capital requirements. Via Moody’s.

Overall, the stress test highlights a marked variation in euro area banks’ ability to cope with severe liquidity shocks. It demonstrated that there are pronounced pockets of vulnerability, with 75% of banks being unable to cope with a severe stress that lasted six months. While individual bank results were not released, the ECB stated that large universal banks and G-SIBs were the most exposed.

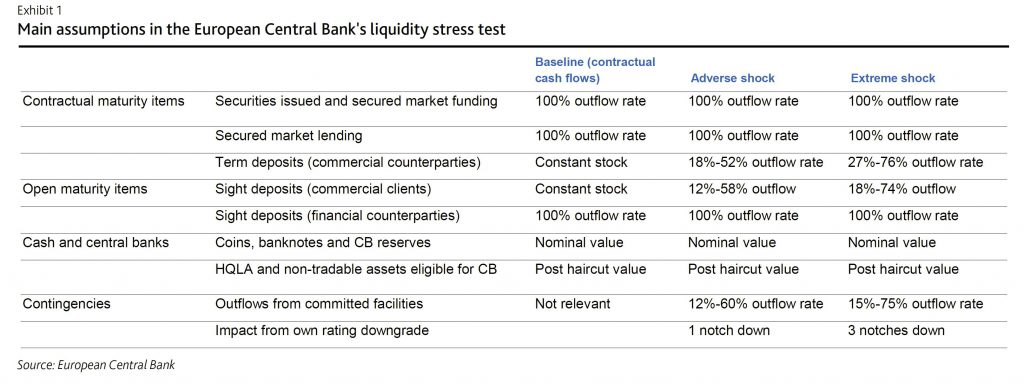
The ECB focused on idiosyncratic (rather than systemwide) shocks calibrated on the basis of recent liquidity crises. The effect was measured in terms of survival horizons by looking at banks’ cumulative cash flows and available counterbalancing capacity (i.e. the liquidity the banks can generate based on available collateral) in three scenarios. The scenarios include a baseline, in which the bank is no longer able to tap the wholesale funding market; an adverse shock, which adds a limited deposit outflow, limited withdrawals of committed lines, and a one-notch rating downgrade; and an extreme shock scenario, which adds severe deposit run-offs, pronounced withdrawals of committed lines, and a three-notch rating downgrade.

Overall, the banks’ reported median survival period was 176 days, or almost six months, under the adverse shock scenario and 122 days (just over four months) in the extreme shock scenario. Only 25% of the banks have liquidity buffers that would withstand the extreme shock scenario for six months or longer, and the majority (75%) have a survival period that is shorter than six months. Survival periods varied markedly, with differences driven mainly by the banks’ funding mix.

There are significant pockets of vulnerability. Although results for individual banks have not been disclosed, four banks from different
jurisdictions and with different business models have a survival period of less than six months even in the baseline scenario, which we consider very weak, and 11 banks have a survival period of less than two months under the extreme shock scenario. Universal banks and global systemically important banks (G-SIBs) are also harder hit by the stress scenarios.

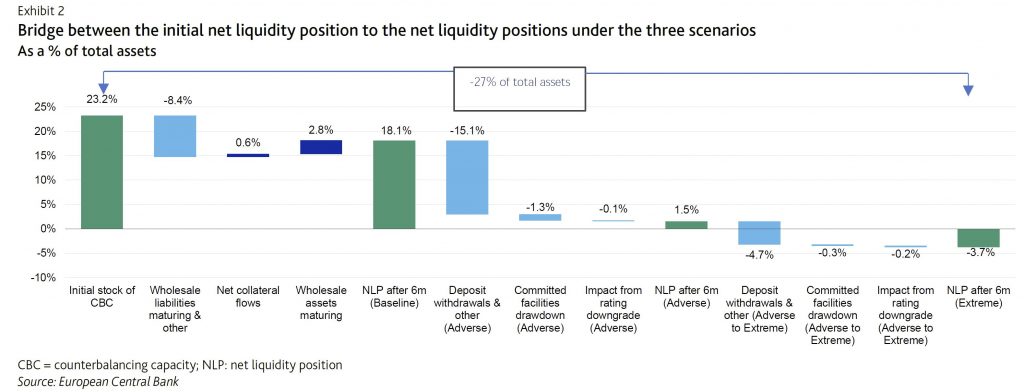
Exhibit 2 shows the (simple average) effect of the three scenarios compared to the initial stock of net liquidity, with overall outflows equivalent to around 27% of total assets under the extreme scenario. The key effect under the baseline scenario is caused by the lack of access to wholesale markets, followed by deposit withdrawals under the adverse and extreme scenarios.

Although any stress test must be based on assumptions and scenarios, we note that past liquidity crises (according to the ECB’s stress test announcement in February 2019) lasted between four and five months on average. However, 43% of the real life stresses lasted longer than six months. With a median survival horizon of a little longer than four months, many banks may have a survival horizon that may prove short, particularly in a bank-specific crisis with more limited opportunities for the central bank to intervene with extraordinary measures. It also points to the need for banks to mobilize additional non-tradable collateral in addition to the readily available liquidity buffers, which is one of the areas where the ECB observed scope for improvement.

Universal banks and G-SIBs, which are generally more reliant on less stable deposits and wholesale funding, despite having large liquidity buffers, were the hardest hit by the stress scenarios. Their median survival in the adverse shock scenario was 126 days, and 80 days in the extreme shock scenario.

Small domestic and retail lenders, which generally benefit from more stable deposits and lower reliance on wholesale funding, were relatively less affected. Their median survival was more than 180 days under the adverse shock scenario and was 140 days under the extreme shock scenario, indicating that they would maintain positive liquidity for significantly
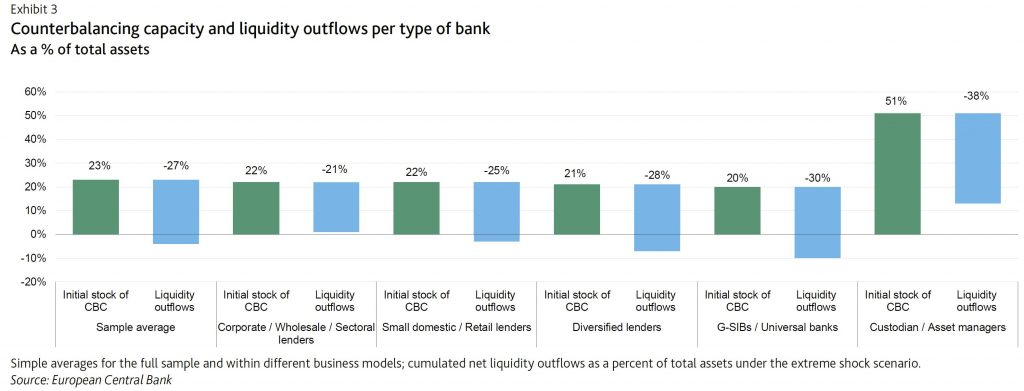
longer than the universal banks and G-SIBs. The results are in line with our assessment where large banks often have weaker funding and liquidity assessments compared to smaller domestic retail banks. Exhibit 3 shows the counterbalancing capacity and the liquidity outflows per type of bank, with G-SIBs/universal banks significantly more negatively affected compared to small domestic/retail lenders.

The stress test also identified vulnerabilities related to cash flows in foreign currencies, where survival periods generally are shorter than those reported at consolidated level. Whereas the median survival period in EUR was 125 days, the median survival periods in USD and GBP were 57 and 53 days, respectively. This suggests that the lessons during the global financial crisis have not been fully learnt. In addition, some banks’ collateral management practices, which are essential in the event of a liquidity crisis, also need improvement.

The ECB also cautioned that banks may underestimate the negative effect that a credit rating downgrade could trigger. Previous liquidity crises have shown that deteriorations can go quickly and fast.

Nine in 10 Global Funds Have Zero Exposure to Australian Banks

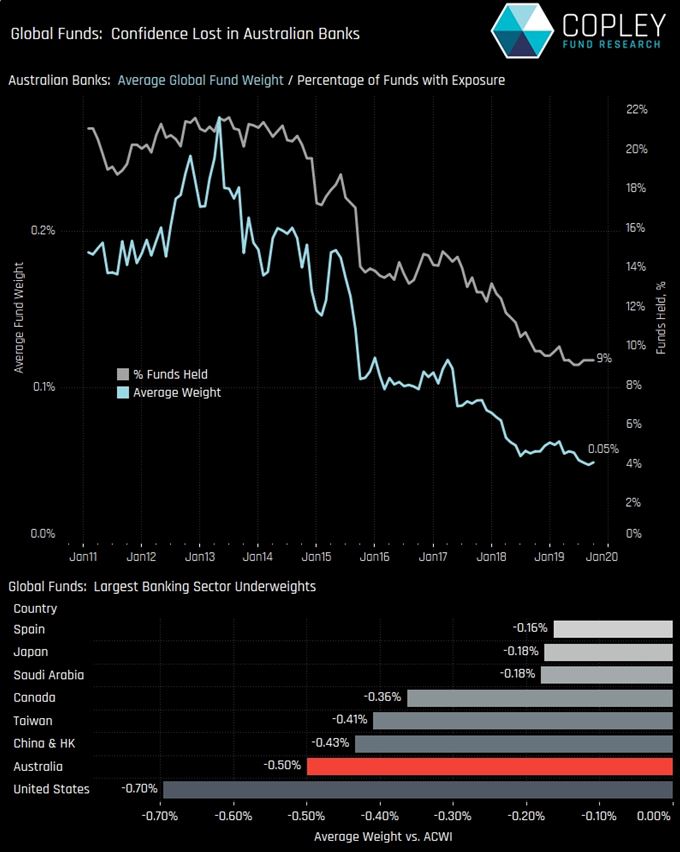
Australian banks are having their toughest time attracting investors, according to new analysis from Copley Fund Research, which monitors flows in funds with $1.2 trillion under management.

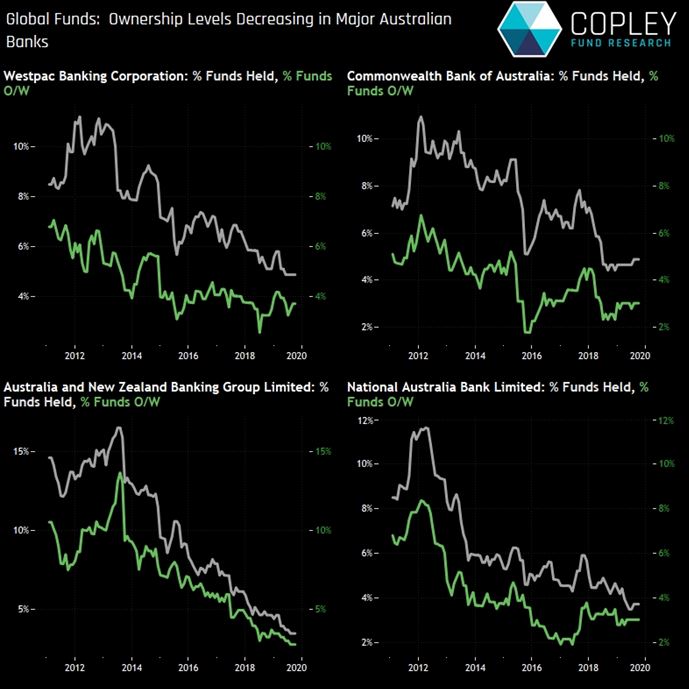
An exodus by fund managers has left 91% of the 430 funds in Copley’s global analysis with zero exposure to the sector. That’s the lowest take-up on record. On average, allocations to the industry are equivalent to just 0.05% of global funds. 

“Regulatory concerns, faltering housing markets and a low interest rate environment have prompted global investors to all but throw in the towel on their Australian bank investments,” said Steven Holden, CEO of Copley Fund Research. “Opportunities elsewhere in the Asia-Pacific region are proving more attractive, such as Singapore and India.”

Copley Fund Research provides data and analysis on global fund positioning, fund flows and fund performance.  

This report is based on the latest published filings as of 31 August 2019 from three fund categories:

Global:                 $800bn total AUM,     432 funds

Global EM:          $350bn total AUM,     193 funds

Asia Ex-Japan:    $65bn total AUM,       104 funds


ANZ Takes Another $559 million Remediation Bill Hit

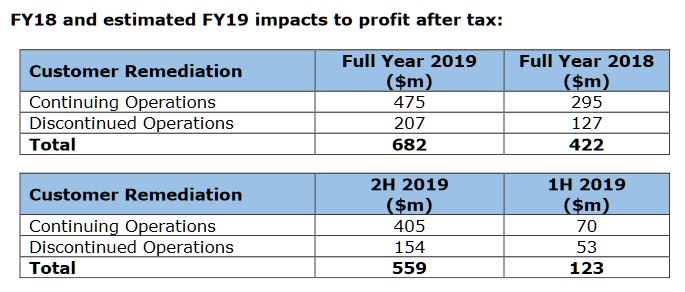
ANZ has announced that its second half 2019 (2H19) cash profit will be impaired by a charge of $559 million (after-tax) as a result of increased provisions for customer related remediation.

The costs include a $405 million after-tax ($485 million before tax) charge within continuing operations, which the bank said largely related to product reviews in Australia retail & commercial for fee and interest calculation and related matters.

ANZ added that such costs also include historical matters recently identified during the period, as well as refinements to estimates of existing customer compensation programs and associated costs.

Further, within discontinued operations, remediation charges recognised in ANZ’s 2H19 results will be $154 million after-tax ($166 million before tax), which ANZ claimed are primarily associated with the advice remediation program and customer compensation charges for other wealth products.

This might not be the end of the matter, as the charges relate to issues that have been identified from previous reviews and from reviews which remain ongoing.  

Following the announcement, ANZ chief financial officer Michelle Jablko said: “We recognise the impact this has on both customers and shareholders.

“We are well progressed in fixing issues and have a dedicated team of more than 500 specialists working hard to get any money owed back to customers as quickly as possible.”

ANZ will release its full-year 2019 financial results on 31 October.