Credit Growth Remains In The Doldrums

The RBA released their data to end of July today . Off the bat in should be noted they made a number of reporting changes, and the growth rates have been “adjusted” as well as applying seasonal adjustments (we assume based on earlier years, though this year might be unique!).

This data shows the total domestic lending commitments (allowing for new loans written, old loans repaid or refinanced – so this is net stock movements.

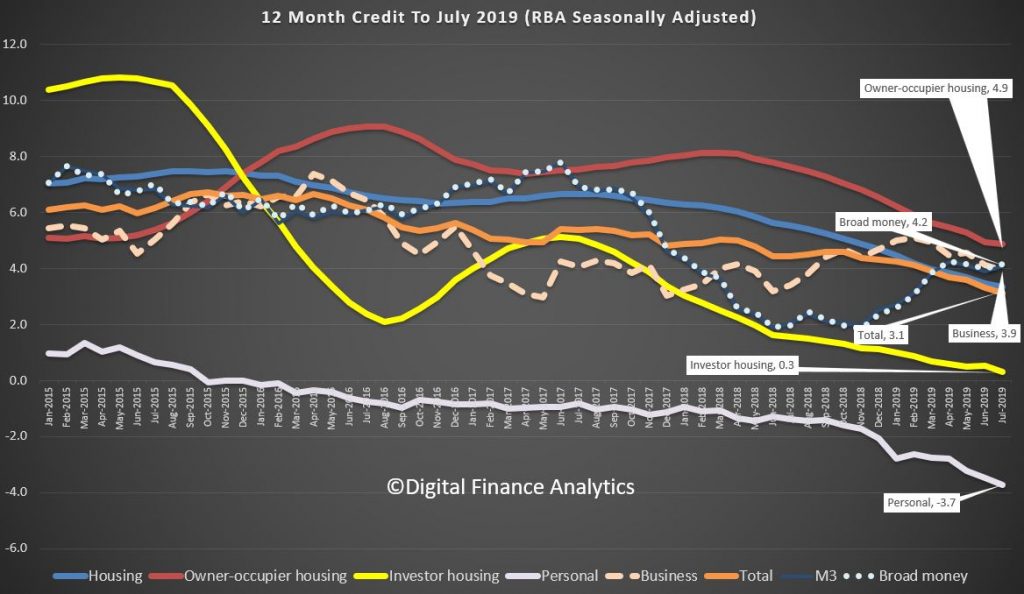
In the D1 data we see that owner occupied lending growth for the past 12 months fell again, down to 4.9%, investment housing lending was down to 0.3%, and so total housing growth fell from 3.5% to 3.3%, another record low. Business lending grew at 3.9% over the past 12 months. Personal lending fell 3.7% and total credit grew 3.1%.

So no evidence of any pick-up on these annualised numbers.
The one month numbers show a small rise in owner occupied loans from 0.2% last month, to 0.5%, a level last seen in September. Investment lending fell down 0.1%. Personal credit fell 0.4% from the previous month, and business lending up from 0.0% to 0.2%. Even with those of the bullish disposition, this is weak. And this data is always noisy, so there is really little to see which signals an improvement.
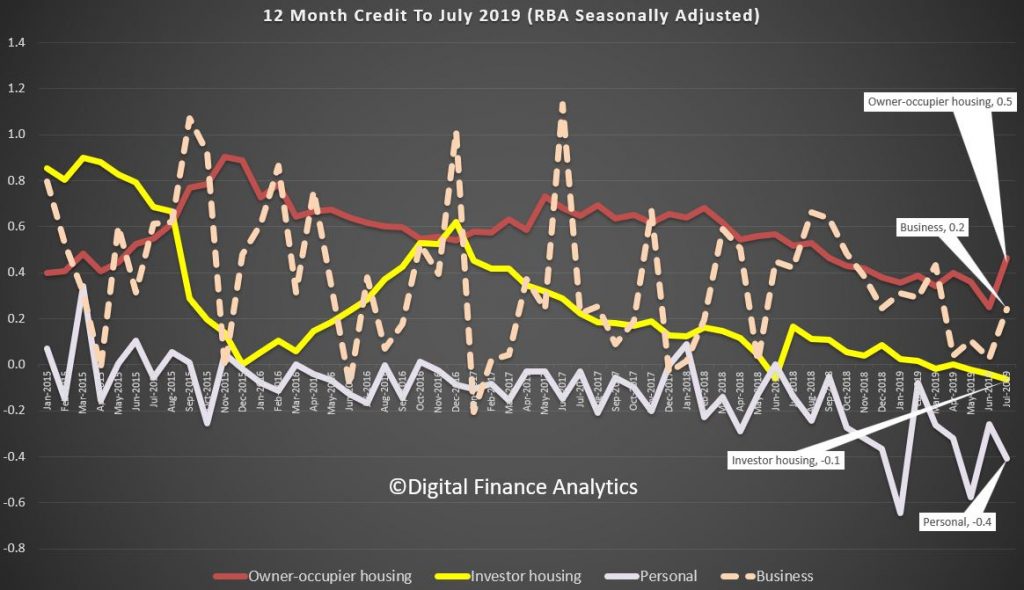
So, its true to say there is little evidence to show the stimulus from lower cash rates, or APRA’s loosening has made any substantive difference – which by the way chimes with our recent household surveys. Which begs the question, where then are the supposed home price rises coming from. Perhaps the ABS flow data in a few days will tell us more. But I remain skeptical. On any basis, property investors are sitting out still.

But we also know the RBA has done some heavy tweaking to the data. This is because the raw D2 data shows big swings between owner occupied and investment lending between June and July, thanks to their revisions. This is what they say:

From this release onward, the financial aggregates incorporate an improved conceptual framework and a new data collection. This is referred to as the Economic and Financial Statistics (EFS) collection. For more information, see Updates to Australia’s Financial Aggregates. All growth rates have been adjusted for the effects of series breaks resulting from these changes. Minor revisions to the historical growth rates of the financial aggregates reflect improvements in the RBA’s seasonal adjustment processes. Revisions to the historical growth rates of the money aggregates – specifically M3 and Broad Money – also reflect methodological improvements to their production.

The implementation of the EFS collection has led to larger-than-usual movements in the levels of the outstanding stocks of series published in the table Lending and Credit Aggregates – D2 between June and July 2019. In particular, the EFS collection seeks to resolve ambiguity about the classification of finance according to its purpose and residency. The sample of entities participating in the collection has also changed and the measurement of housing credit extended by non-authorised deposit-taking institutions has improved. Some of the key changes resulting from the EFS collection are reclassifications between: owner-occupier housing loans and investor housing loans; housing loans and other personal loans; and loans to residents and loans to non-residents (loans to non-residents are not included in the credit aggregates). In combination, these changes have led to: decreases in the levels of total credit, business credit, housing credit and owner-occupier housing credit; and increases in the levels of other personal credit and investor housing credit. In contrast to the published growth rates, the levels of the credit aggregates are not adjusted for series breaks. Growth rates should not be calculated from data on the levels of credit.

The table Monetary Aggregates – D3 has changed; for more information, please see the change notice published on 31 July 2019. The history of M1 has been revised to include all transaction deposits, whereas previously some of these deposits were only included in M3. The history of M3 and Broad Money has also been revised, reflecting minor conceptual changes. Beyond these historical revisions, movements in transaction and non-transaction deposits between June and July 2019 are larger than usual. This is because the EFS collection used to compile the monetary aggregates more accurately classifies deposits by their type. The levels of the monetary aggregates are not adjusted for series breaks. Growth rates should not be calculated from data on the levels of money.

Owing to the EFS collection, ‘Net switching of housing loan purpose – from investor to owner-occupied within the same lender’ will now be published with a one-month delay.

As usual, all growth rates for the financial aggregates are seasonally adjusted, and adjusted for the effects of breaks in the series as recorded in the notes to the tables listed below. Data for the levels of financial aggregates are not adjusted for series breaks. The RBA credit aggregates measure credit provided by financial institutions operating domestically. They do not capture cross-border or non-intermediated lending.

More data noise in the machine. We will look at the APRA bank specific data in a later post.

Macquarie launches $1.6bn raise

Macquarie Group has kicked off a $1.6 billion raise, with the bank aiming to spread the capital across three of its subsidiaries, intending to make investments and comply with regulatory change. Via InvestorDaily.

The raise is occurring the form of an institutional placement, expected to raise around $1 billion, in addition to a share purchase plan being offered to shareholders afterwards, which could produce a further $600 million.

Macquarie indicated to shareholders it will be investing across the renewables, technology and infrastructure sectors through both the Macquarie Capital and Asset Management subsidiaries.

In particular, it noted significant investments including wind farms offshore from the UK and in Taiwan.

Macquarie said it is anticipating approximately $1 billion in net capital investment in the current quarter ending 30 September. 

The investments are expected to primarily occur through Macquarie Capital.

Further, due to a new standardised approach being implemented by APRA for measuring counterparty credit risk exposures, Macquarie’s Commodities and Global Markets business will have an estimated $600 million increase in capital requirements. 

Shemara Wikramayake, chief executive, Macquarie said: “We have continued to identify opportunities to invest capital with the potential for attractive risk-adjusted returns for shareholders over the medium term.”

“Raising new capital at this point allows us to maintain strategic flexibility in light of these opportunities.”

Alongside the capital raise, the bank provided an update on its outlook. It confirmed its previous guidance given at its annual meeting in July, continuing to expect the group’s result for the full year to be slightly down in financial year 2019. 

Macquarie anticipates the first half of FY20 is will be up by 10 per cent on the prior corresponding period, but down on its strong second half, which had benefitted from increased contributions from the market-facing businesses. 

The outlook remains subject to shaky market conditions, regulatory changes and tax uncertainties, among other factors.

Macquarie generated a net profit of $2.9 billion in FY19, up 17 per cent from the year before.

The bank paused trading before it opened the capital raise.

The placement price for is being determined through a bookbuild process, with the placement to represent around 2.5 per cent of total existing Macquarie shares on issue.

Macquarie will offer eligible shareholders an opportunity to participate in a non-underwritten share purchase plan with a maximum application size of $15,000 per eligible shareholder.

ASIC research highlights the importance of reforms for mortgage brokers and home lending

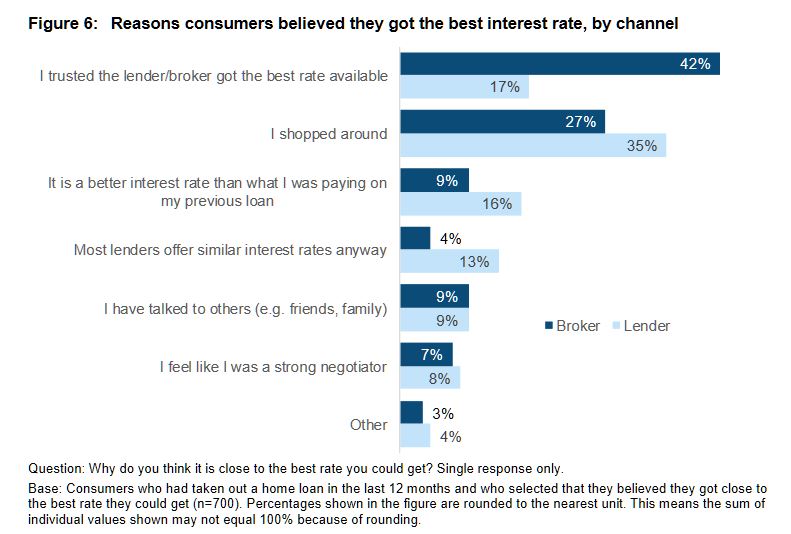
ASIC has highlighted that some consumers are taking out home loans when cheaper alternatives may well exist. Brokers do not come out that well!

Today ASIC has released a report Looking for a mortgage: Consumer experiences and expectations in getting a home loan. As part of this research, ASIC followed over 300 consumers in the process of taking out a home loan and surveyed another 2,000 consumers.

This research examines consumer decision-making in relation to home loans to identify what factors influence their journey.  

Key findings from our research include:

  • consumers who visit a mortgage broker expect the broker to find them the ‘best’ home loan
  • mortgage brokers were inconsistent in the ways they presented home loan options to consumers, sometimes offering little (if any) explanation of the options considered or reasons for their recommendation
  • first home buyers were more likely to take out their loan with a mortgage broker. 

The report shows that consumers taking out a loan directly through a lender were more likely to be a refinancer or have had previous experience taking out home loans. Consumers who went directly to a lender valued convenience, with 69% taking out their loan with a lender they had an existing relationship with.

Taking out a home loan is a complex process and consumers told us it can be an ‘overwhelming’ experience. Although most consumers set out to find the best loan they could, 1 in 5 consumers believed that they could have got a better interest rate on their home loan or were not sure whether they had even got a good rate.

In launching ASIC’s report, Commissioner Sean Hughes said, ‘A home loan is one of the most important financial commitments a consumer will make. Lenders, brokers and aggregators must step up to make it easier for consumers to meaningfully compare loan options and for brokers to communicate how a home loan option has been selected for them.’ 

‘ASIC strongly supports the recent Government announcement to enact a best interests duty for mortgage brokers. Importantly, the implementation of such a duty will align the role of brokers to the reasonable expectations of consumers.’

‘Our research also suggests that some consumers are taking out home loans when cheaper alternatives may well exist. We are working with other regulators to develop a new home loan interest rate tool to improve price transparency for consumers to compare options. We expect this tool will be made available on ASIC’s MoneySmart website next year.’

Background

In March 2017, ASIC published the findings of our review into the effect of remuneration structures in the mortgage broking market on the quality of consumer outcomes: see Report 516 Review of mortgage broker remuneration (REP 516). We found that current remuneration practices create conflicts of interest that may contribute to poor consumer outcomes.

As part of this review we also found that consumers who obtained their loan through a broker:

  • borrow more
  • have higher loan to valuation ratios
  • spend more of their wage on a mortgage
  • take out more interest-only loans
  • get the same rate as customers that go directly to a lender.

ASIC’s MoneySmart website has information for consumers about choosing a home loan and using a broker.

Consumers can also use MoneySmart’s mortgage calculator to compare home loans and work out whether they can save money by switching to another mortgage. 

Property Transaction Intentions By Segment

Today we continue the discussion of the latest findings from our rolling household surveys. Yesterday we over-viewed the segments, and trends, and looked at relative demand. Today we go deeper. The accompanying video explains our findings in more detail.

Want To Buy.

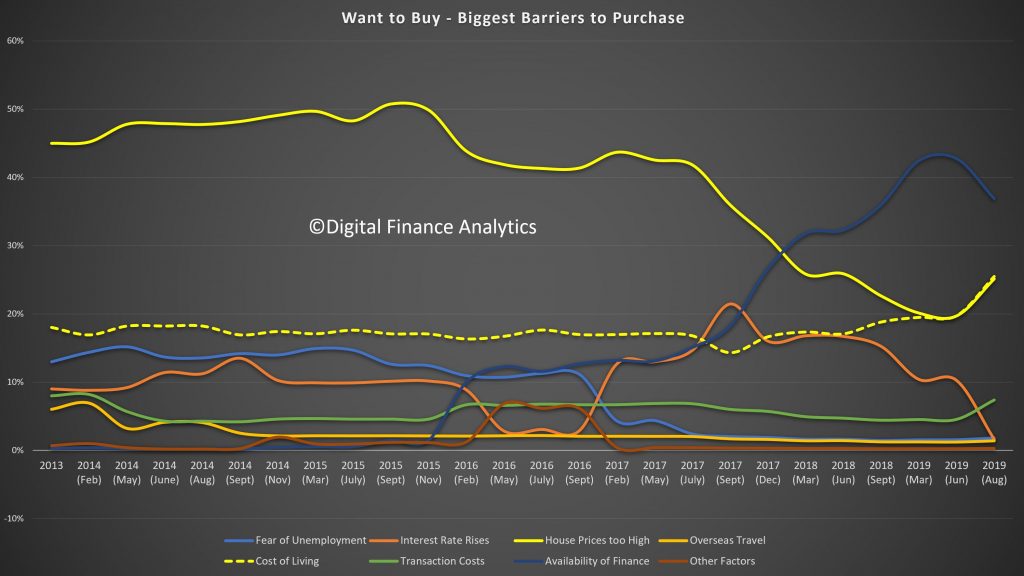
The 1.6 million Want To Buys are not able to progress because finance is not available (37%). This is been a growing issue in recent times, though has eased back, as pressure from cost of living (25%) and high home prices (25%) bite. Many therefore remain in rental property or in other living arrangements.

First Time Buyers.

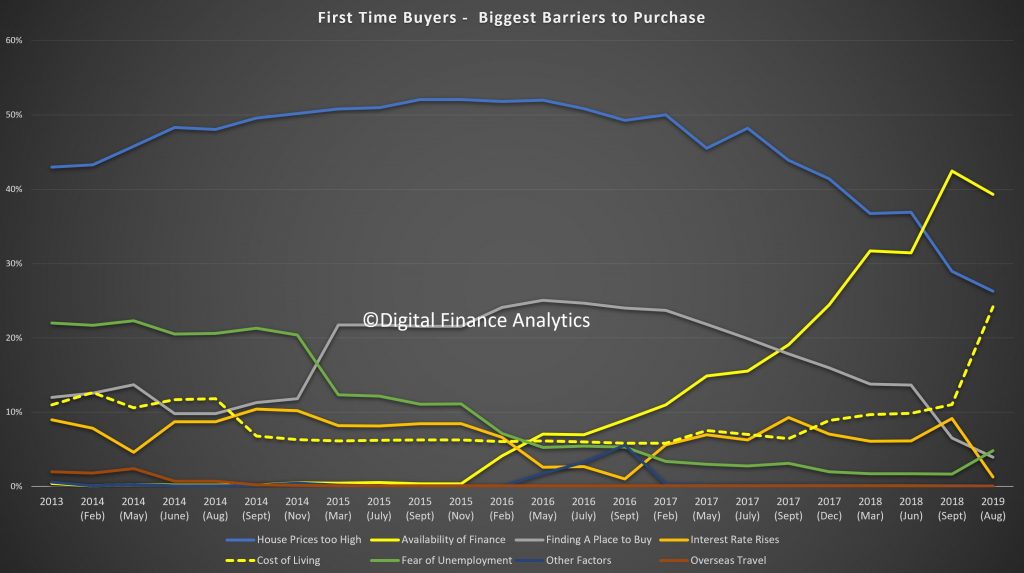
There have been some changes in the drivers of purchase by the 350,000 first time buyers. Needing a place to live is high on the agenda (29%), but the expectations of future capital growth have dropped to 15%, while greater security remains around 15%. There is a rise in the use of First Owner incentives (13%).

However, availability of finance remains a significant barrier (39%) – though it dropped a little in response to lower rates and changed underwriting standards, along with high home prices (26%) and costs of living (24%). Fear of unemployment is on the rise (5%).

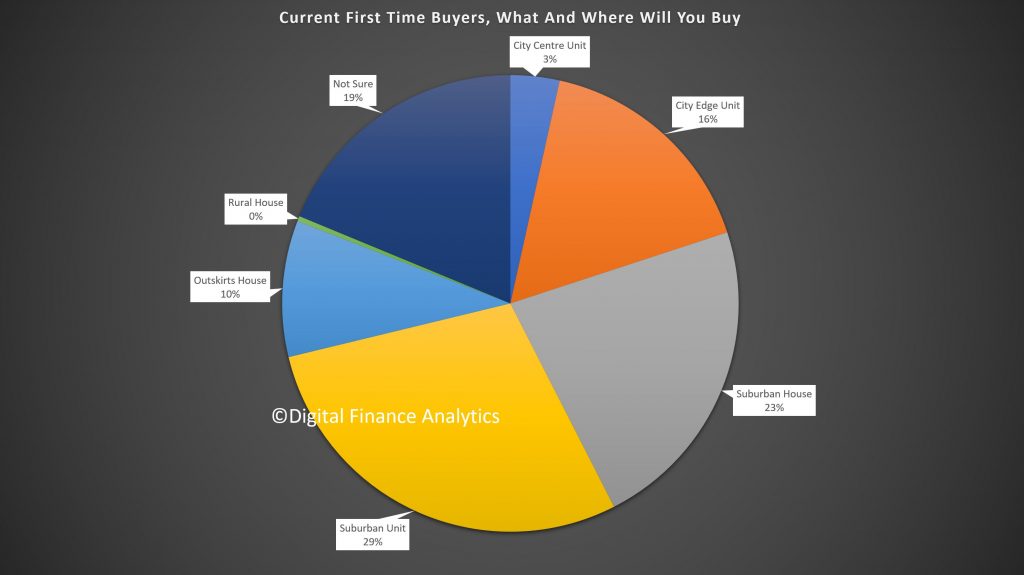
There has been a reduction in demand for units relative to houses, partly in response of the coverage of poor quality high-rise construction. We expect this to continue.

Refinancers.

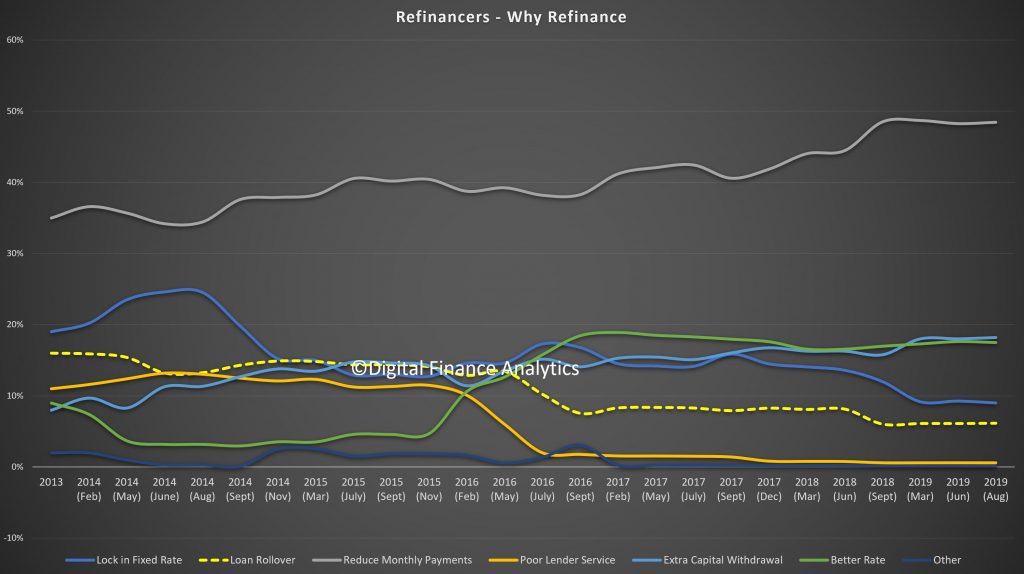
There is a significant demand from those seeking to refinance an existing loan. The main aim is to reduce monthly repayments (48%), a factor which have become more important as financial pressures and mortgage stress build, helped by lower rates (18%). Around 18% are seeking to withdraw capital to repay other debts or improve their finances. Fixed rates are becoming less attractive (9%). Poor lender service is not a significant factor; price is.

Up-Traders.

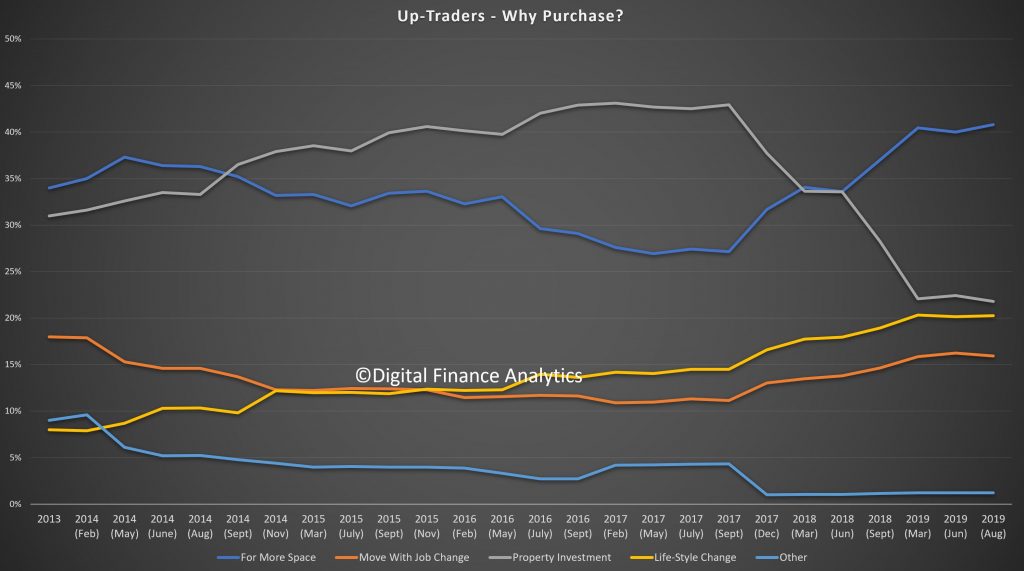
Households looking to buy a larger property are driven by the desire for more space (41%), job move (16%), life-style change (20%), or property investment (22%), the latter dropping from recent highs of 43%.

Down Traders.

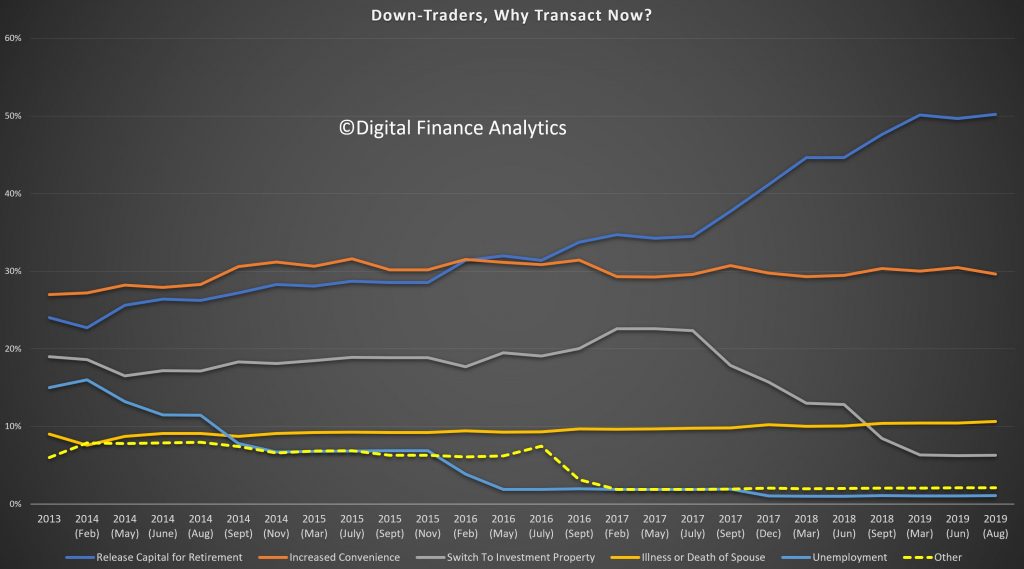
Those seeking to down size are mainly driven by the need to release capital, often for retirement, or supporting the “Bank of Mum and Dad” (50%). Around 30% are driven by increased convenience – either by changing location or to a more manageable property. A switch to an investment property has faded to 5% from a peak of 22% in 2017.

Property Investors.

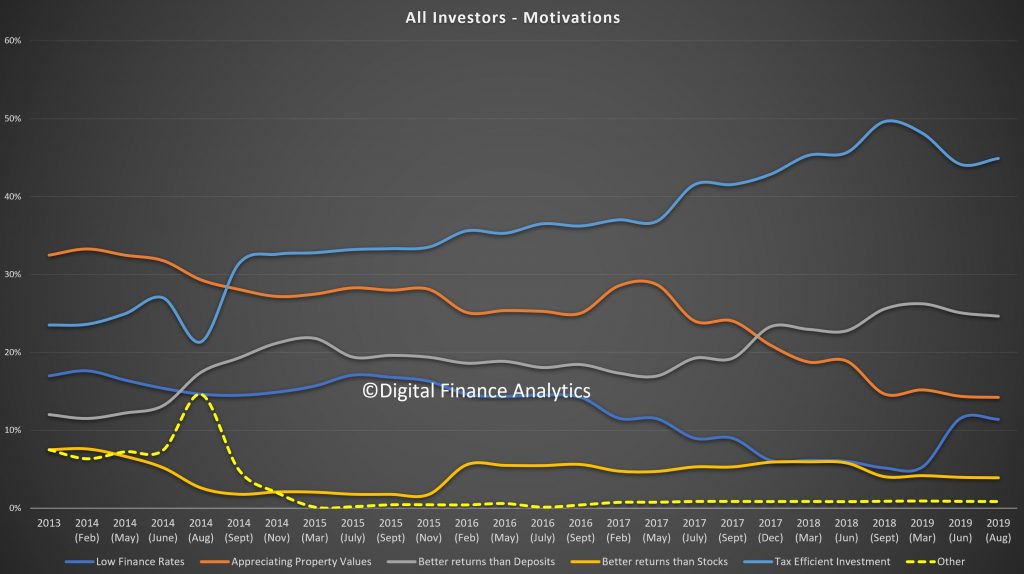
Tax efficiency remains the strongest driver for investors (45%), while appreciating property values have dropped from more than 30% down to 15% now. Low finance rates have risen to 12% thanks to the recent changes and better returns than bank deposits registered at 25%. So investors believe the tax breaks make investing a reasonable proposition (though many would find in net cash flow terms they are underwater, without significant capital gains).

The main barriers are difficulty in obtaining finance (40%), have already bought (30%), and changes to regulation (15% – and falling now). Fears of interest rate rises have dropped from 11% in March 2019 to 1% now and the local and international economic scene has changed.

In the accompanying video we look in more detail at the differences between Solo Investor, Portfolio Investor and Super Investor motivations.

Finally, its worth noting that across the segments, when choosing a mortgage, price remains the main driver, though some segments rate other features a little more significant than others.

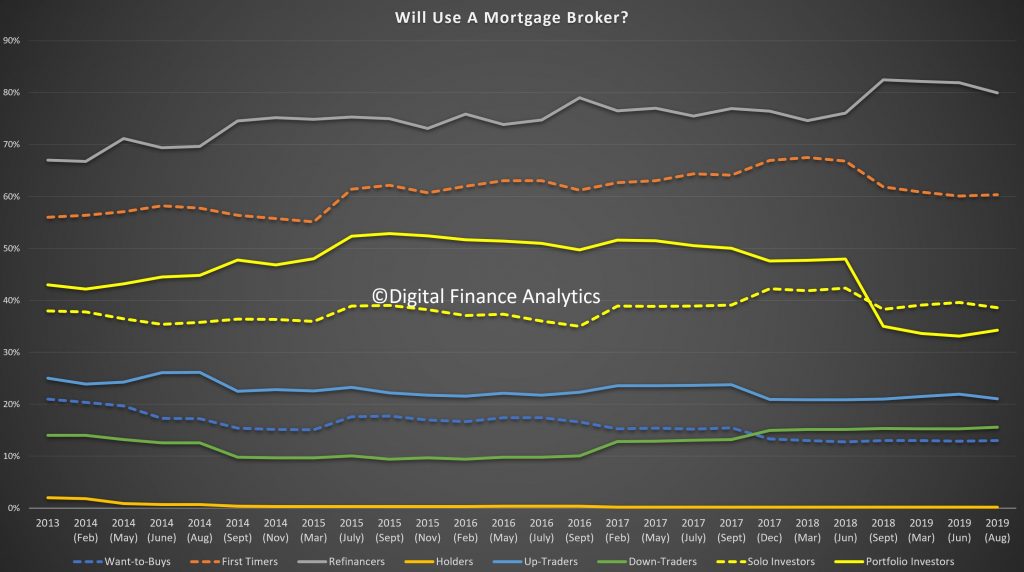
Prospective use of mortgage brokers also varies across the segments, with refinancers and first time buyers the most likely to use an adviser.

So, in summary, households are reacting to the changing market and economic conditions. However there is little here to suggest a significant upswing in demand.

The Property Supply Demand Disequilibrium

Digital Finance Analytics will be releasing the results from our rolling household surveys over the next few days. This is the first in the series.

These are the results from our 52,000 households looking at property buying propensity, price expectations and a range of other factors.

We use a segmented approach to the market for this analysis, and in our surveys place households in one of a number of potential segments.

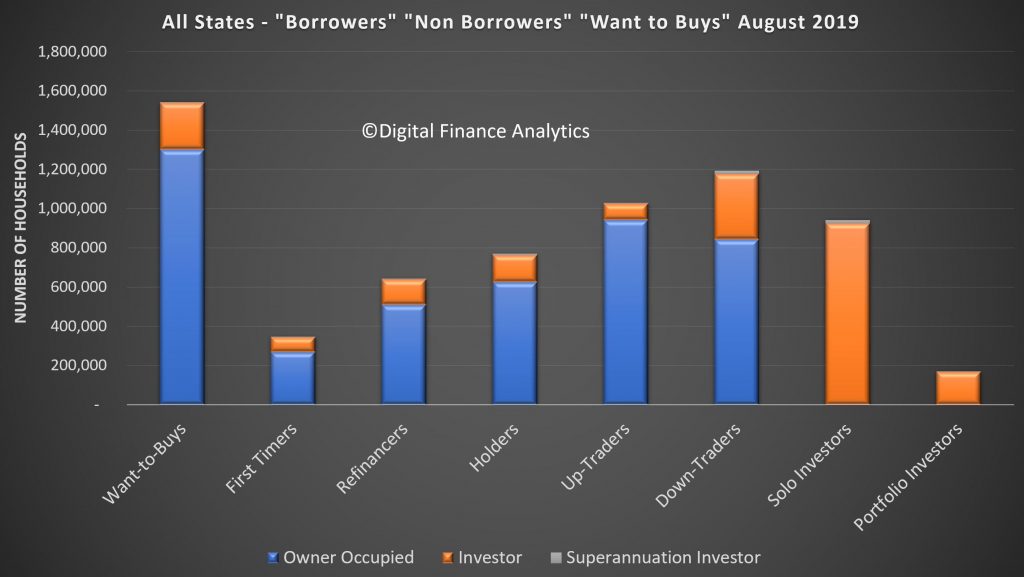
Want To Buys: households who would like to buy, but have no immediate path to to purchase. There are more than 1.5 million households currently in this group.

First Timers: first time buyers with active plans to purchase. There are around 350,000 households in this segment.

Up-Traders: households with plans to buy a larger property (and sell their current one to facilitate the up-sizing. There are around 1 million households in this group.

Down Traders: households wishing to sell and down size, sometimes buying a smaller property at the same time. There are around 1.2 million households in this group.

Some of these households will hold investment property as well. We categorise investors into one of two groups.

Solo Investors: households with one or two investment properties. There are about 940,000 of these.

Portfolio Investors: households with more than two investment properties. There are around 170,000 of these.

Finally we also identify those who are planning in refinance existing loans, but are not intending to buy or sell property – flagged as Refinancers, and those with no plans to buy, sell or refinance – flagged as Holders.

It is the interplay of all these segments which drives the property market and demand for mortgages.

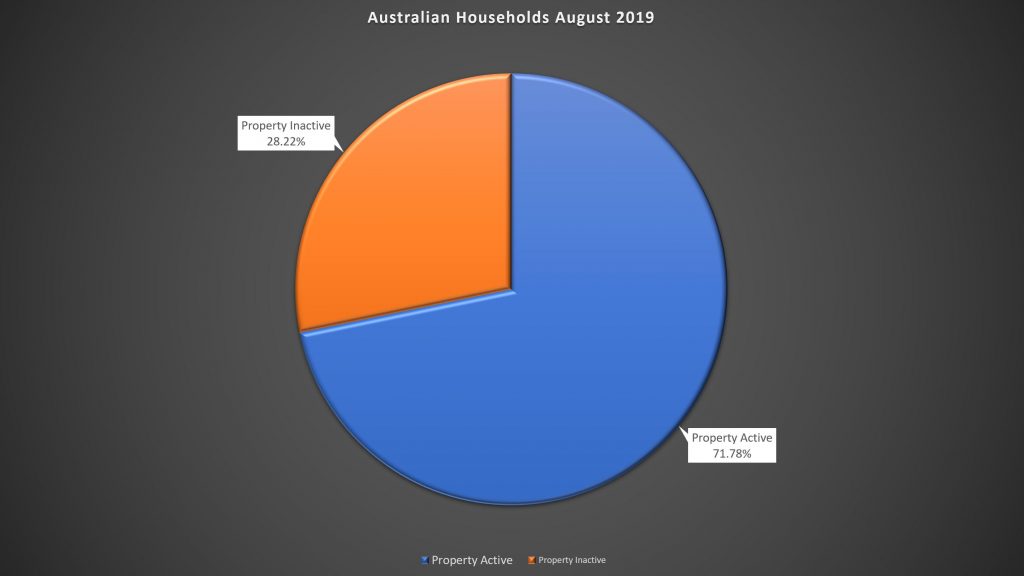
Around 72% of households are property active – meaning they want to buy, sell, or own property. More than 28% are property inactive, meaning they rent, live with parents or in other arrangements. Our surveys track all household cohorts. A greater proportion are falling into the inactive category.

Intention To Transact Is Rising (From A Low Base)

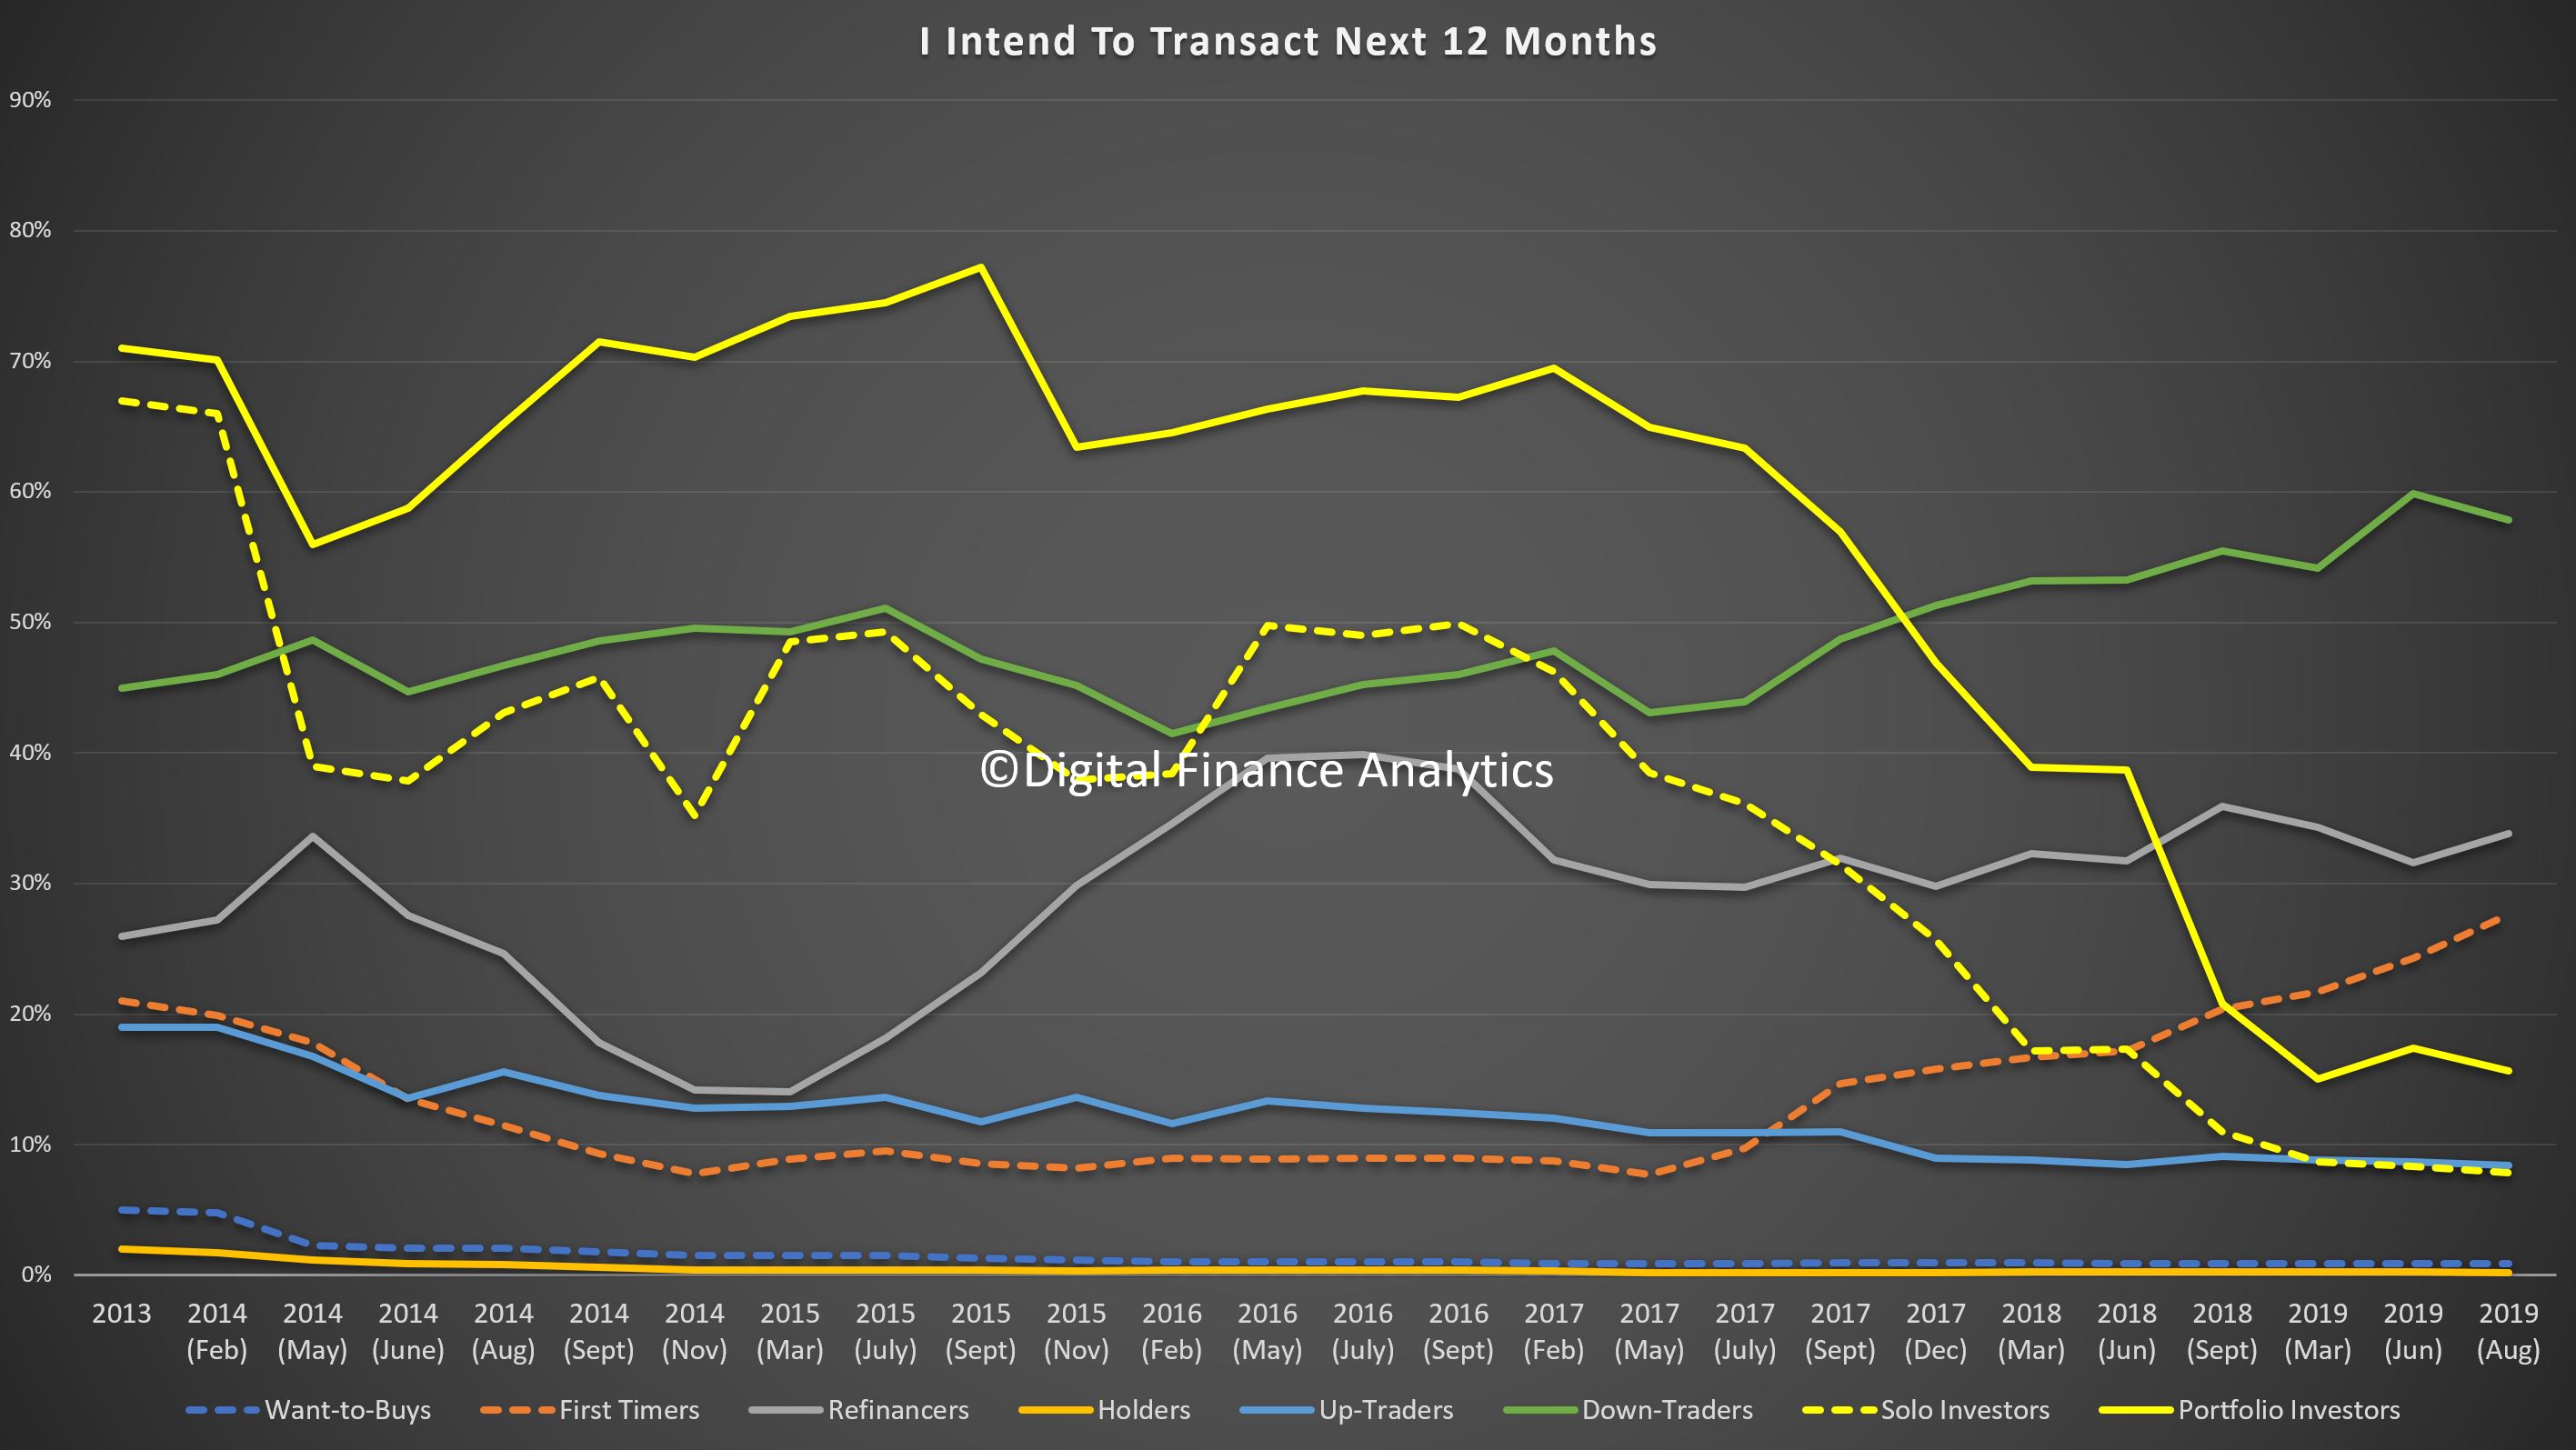
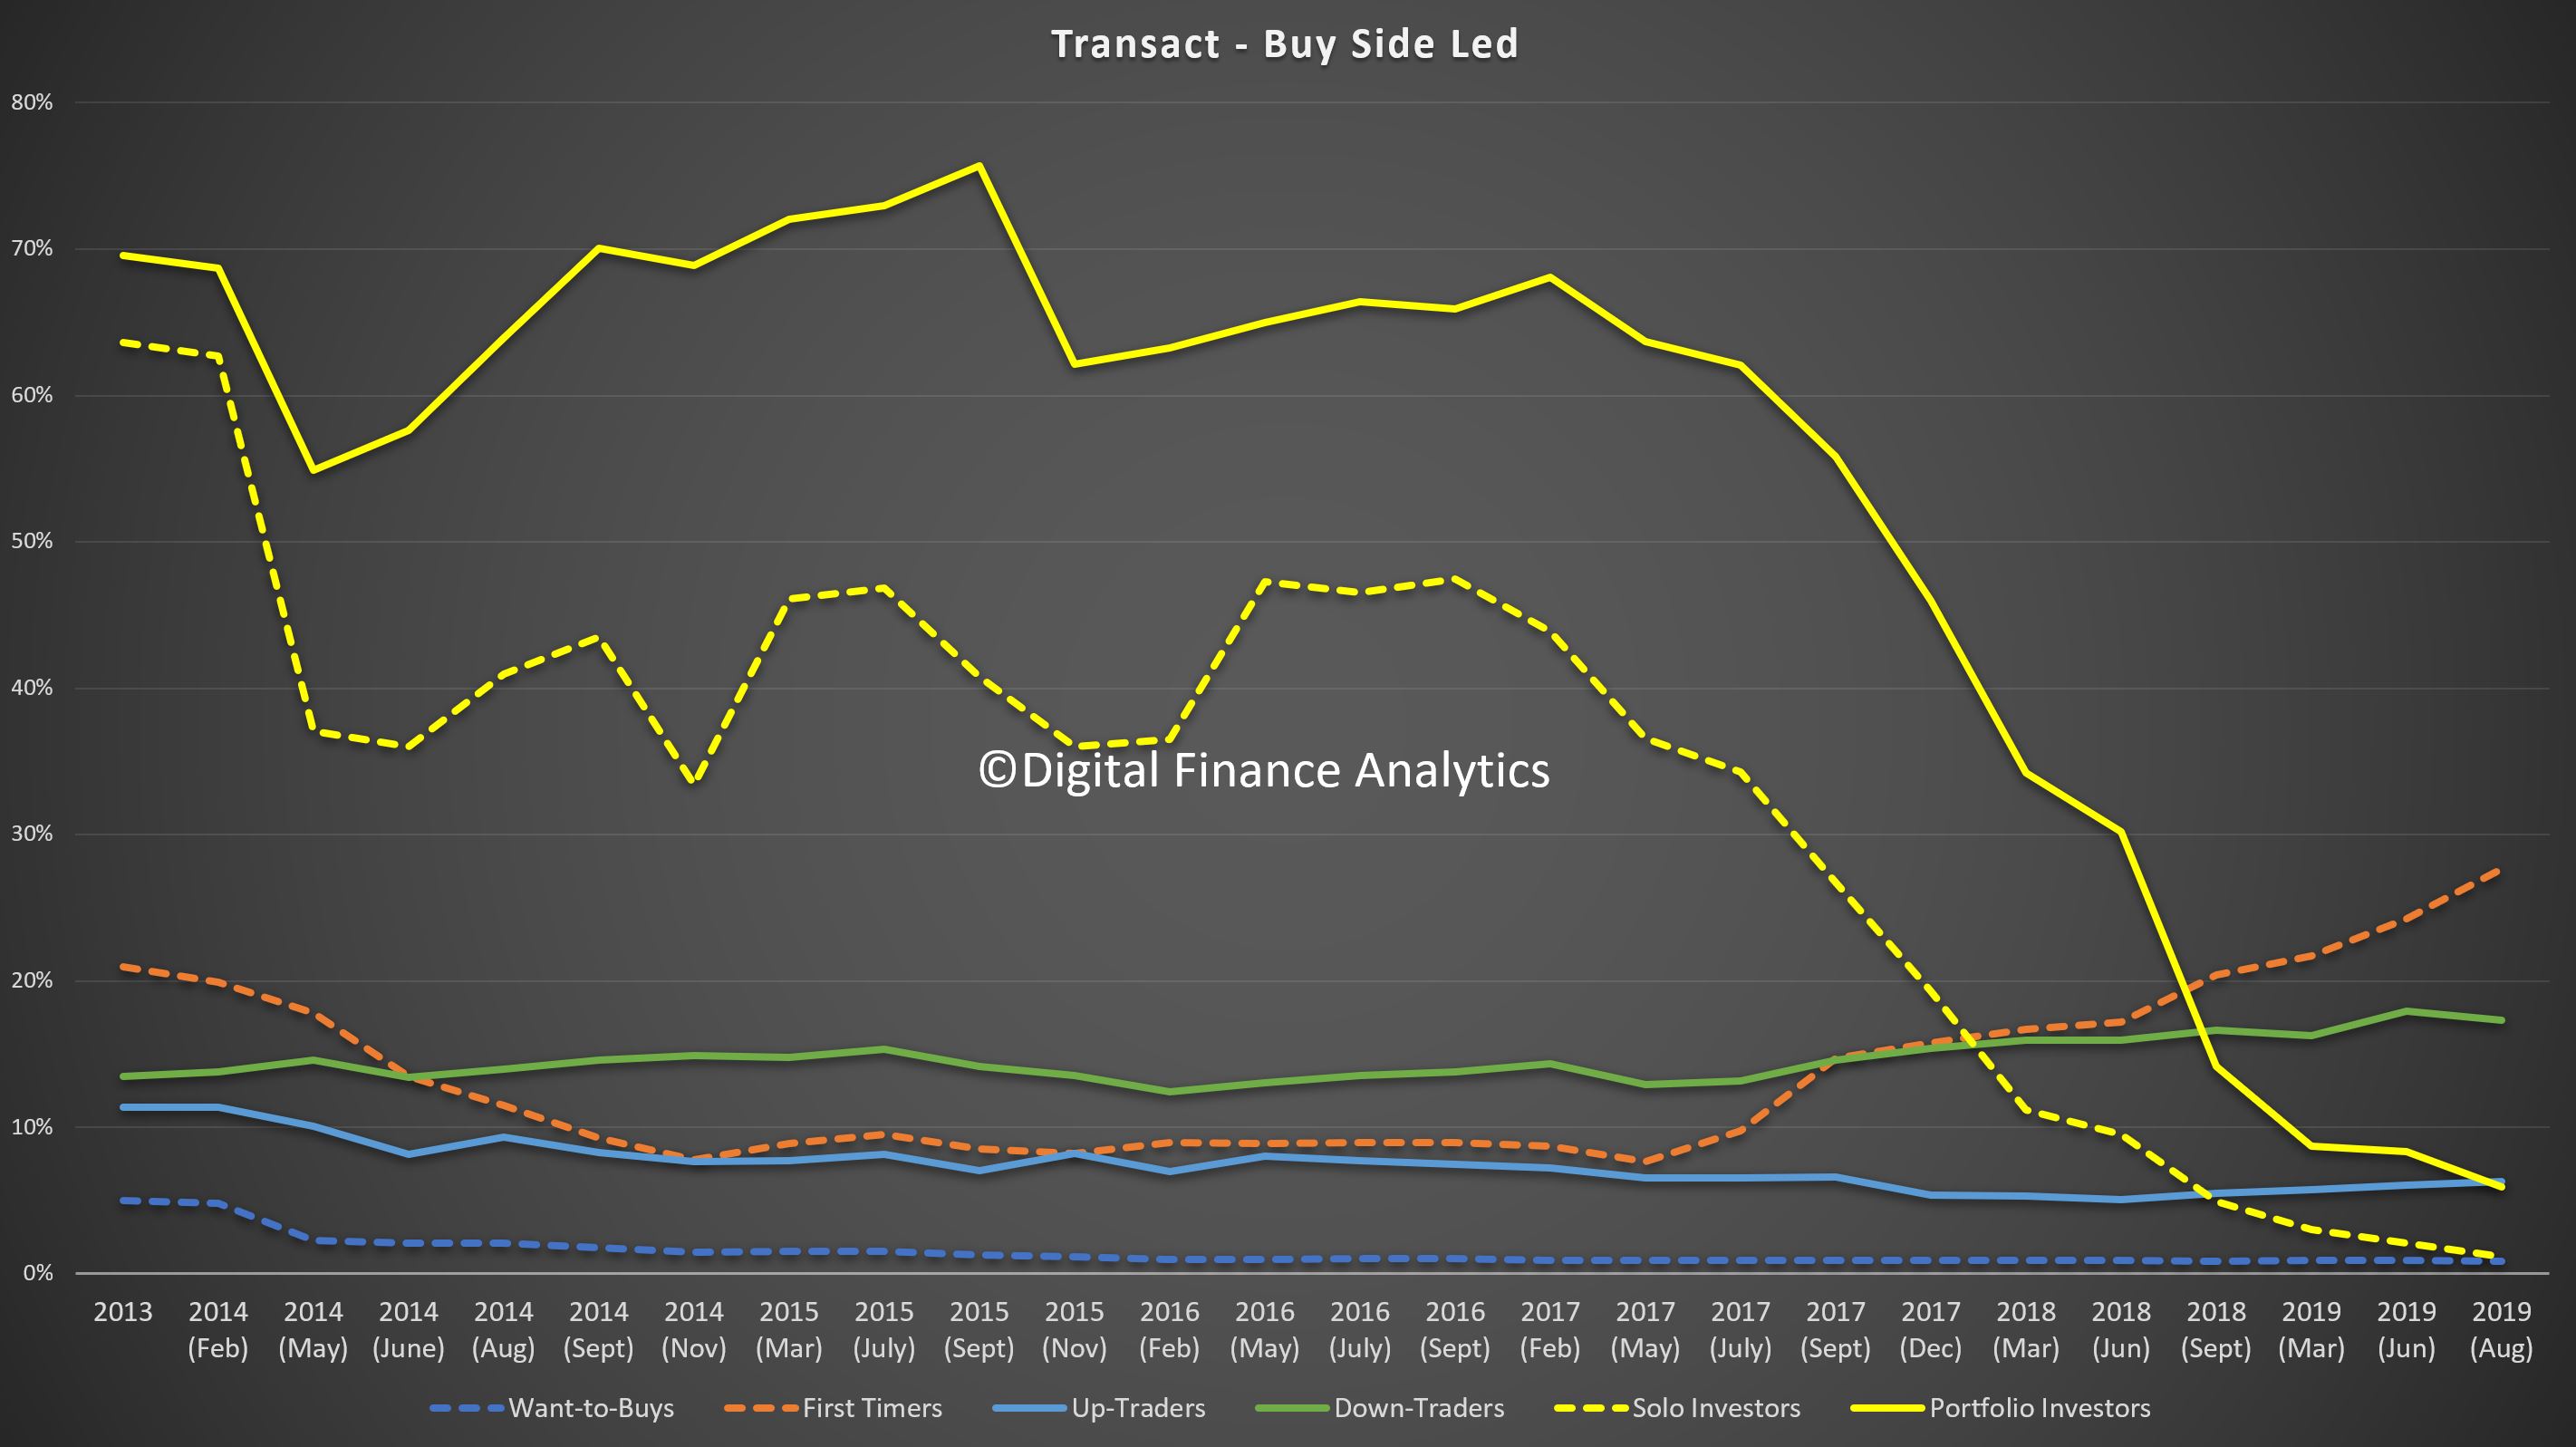
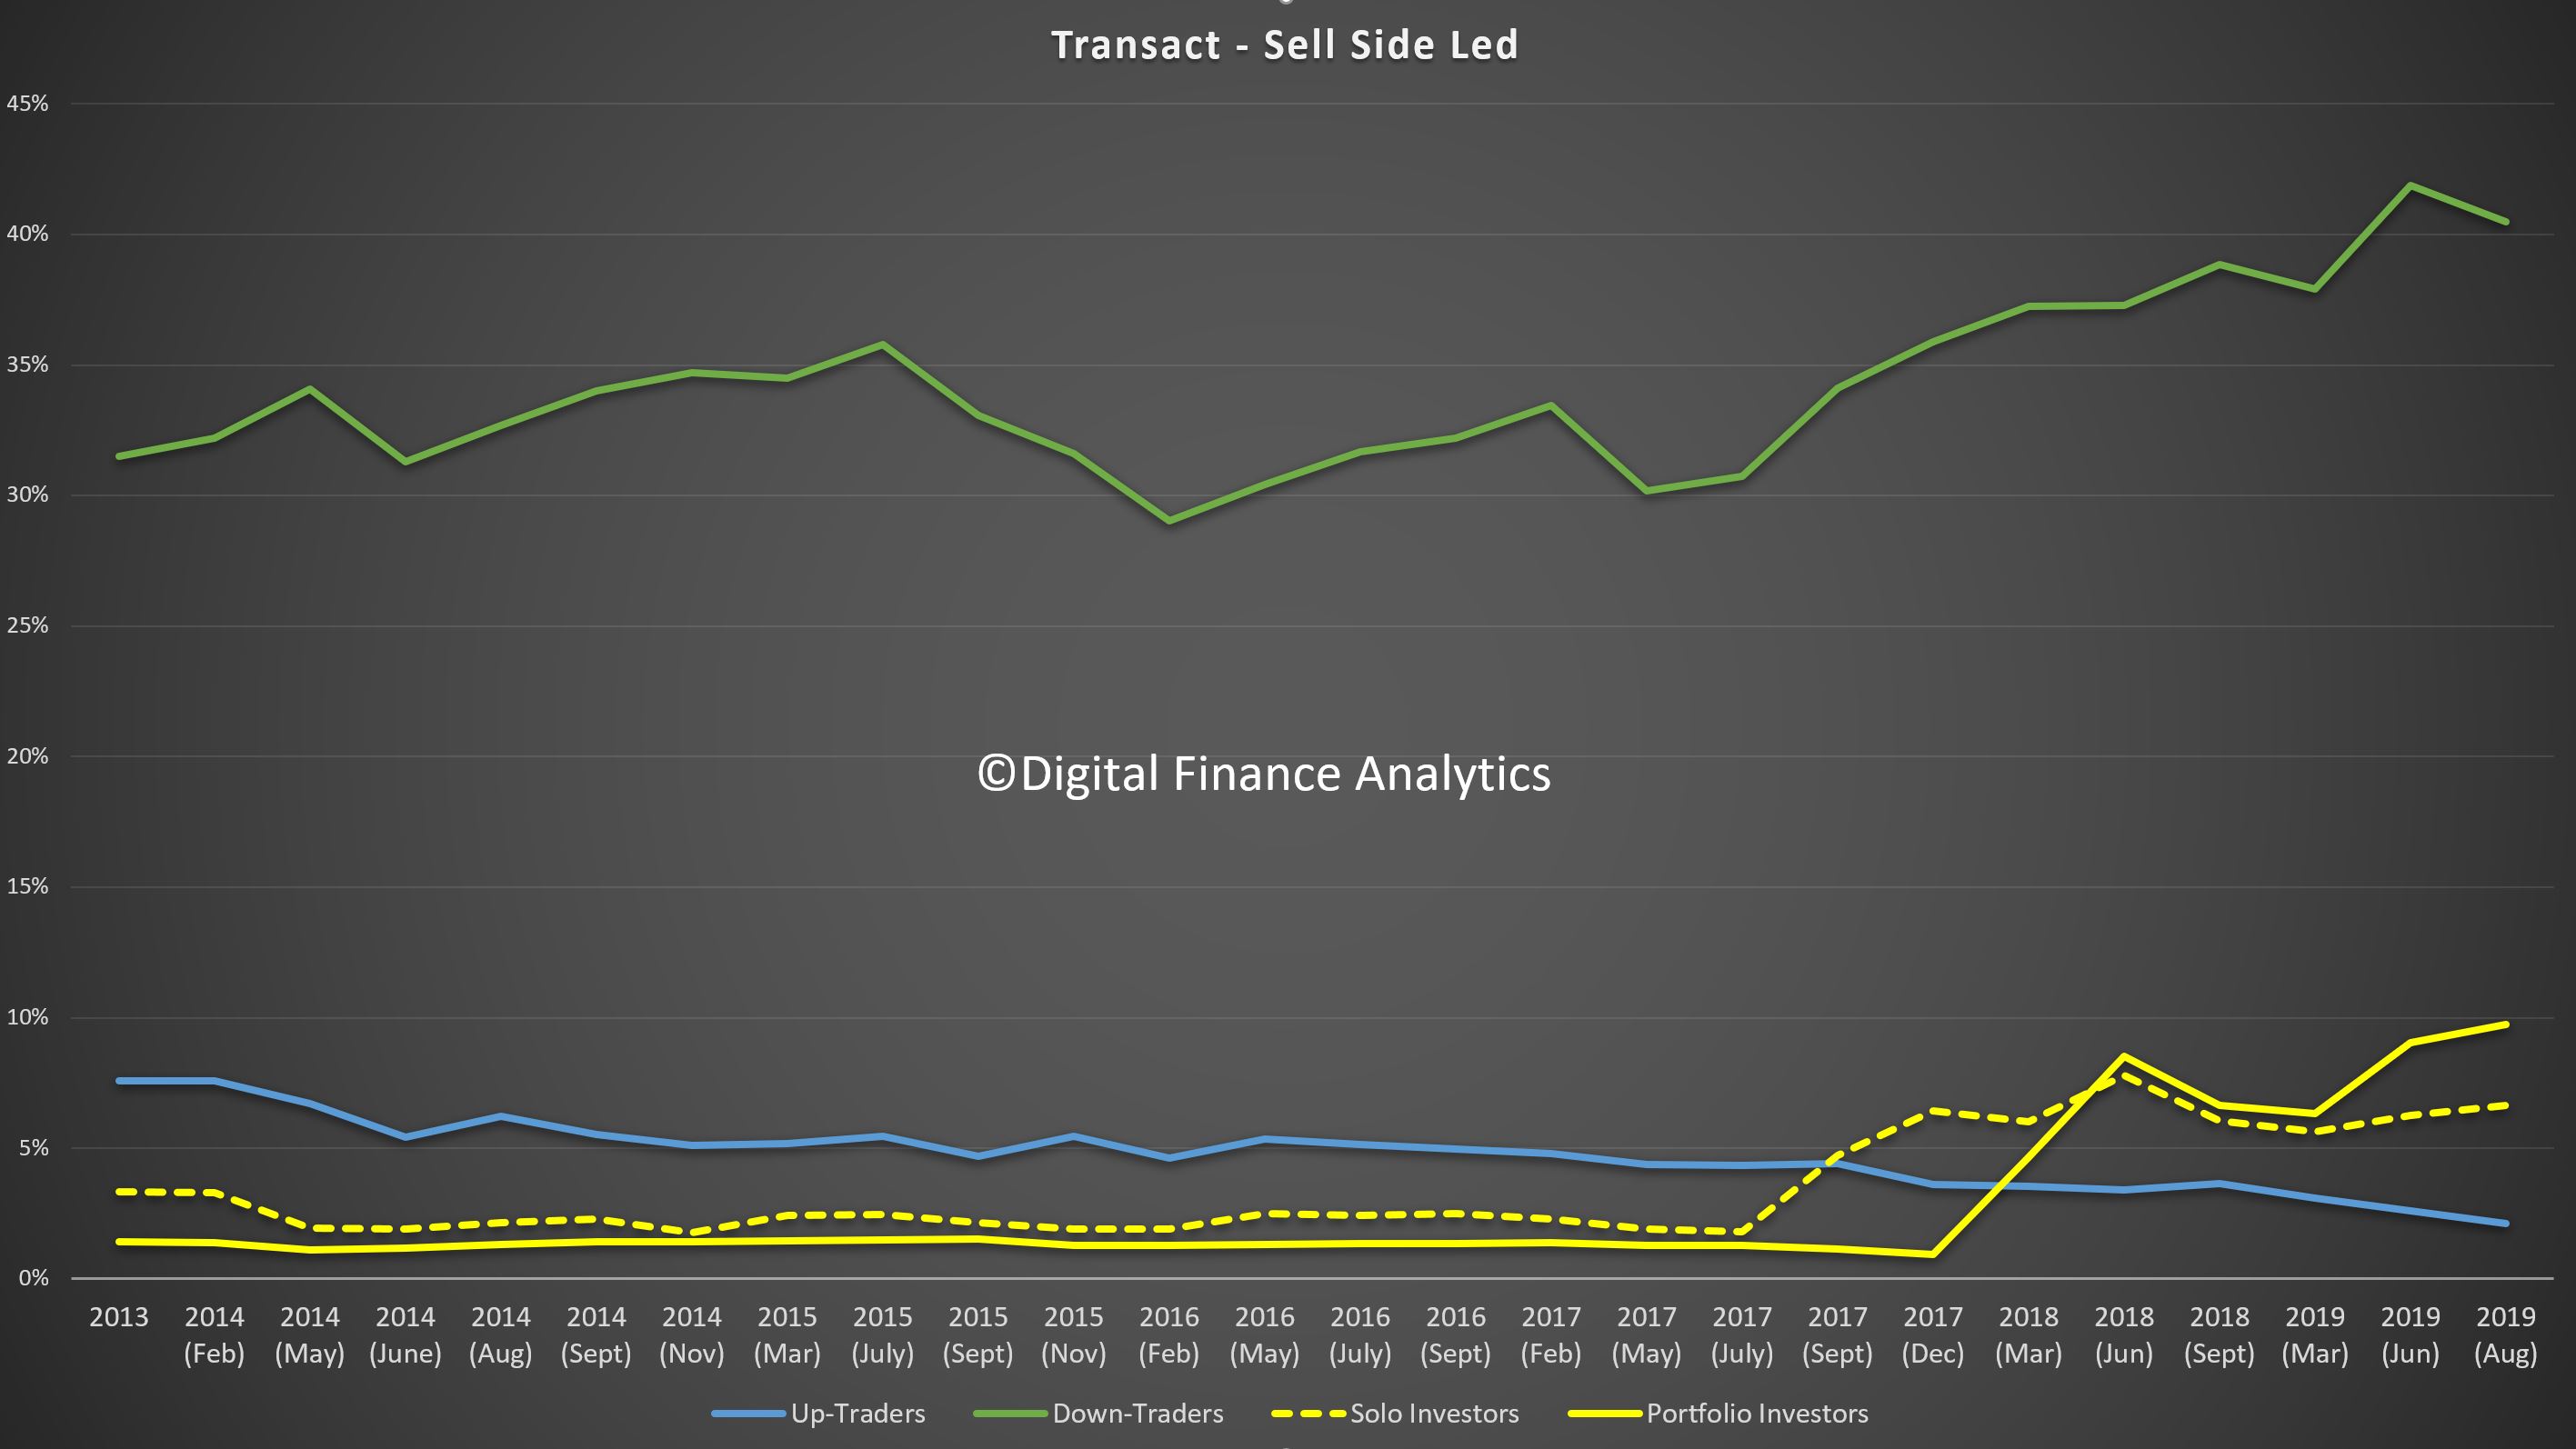
We ask about households intentions to transact in the next 12 months, and whether they will be buy-led (seeking to purchase a property first) or sell-led (seeking to sell a property first). (Click on Image To See Full Size).

Property investors are still coy (hardly surprising given the fall in capital values, the switch to P&I loans and receding rentals. But Down Traders, First Time Buyers and Refinancers are showing more intent.

We will look at the drivers by segment in a later post.

But the Buy Side and Sell Side Analysis is telling

Those seeking to buy are being led by First Time Buyers and Down Traders.

Those looking to sell are being led by the Down Traders, and Property Investors. In fact this suggests we will see a spike in listings as we move into spring.

Our equilibrium model suggests that currently supply is not meeting demand (adjusted for property types and locations) in a number of prime Sydney and Melbourne locations, within 30 minutes of the CBD. But beyond that demand is below current supply, and more is coming.

On this basis, we expect to see some local price uplifts, but not a return to the rises a couple of years back. What is clear, is that the property investment sector continues to slumber, and Down Traders are getting more desperate to sell.

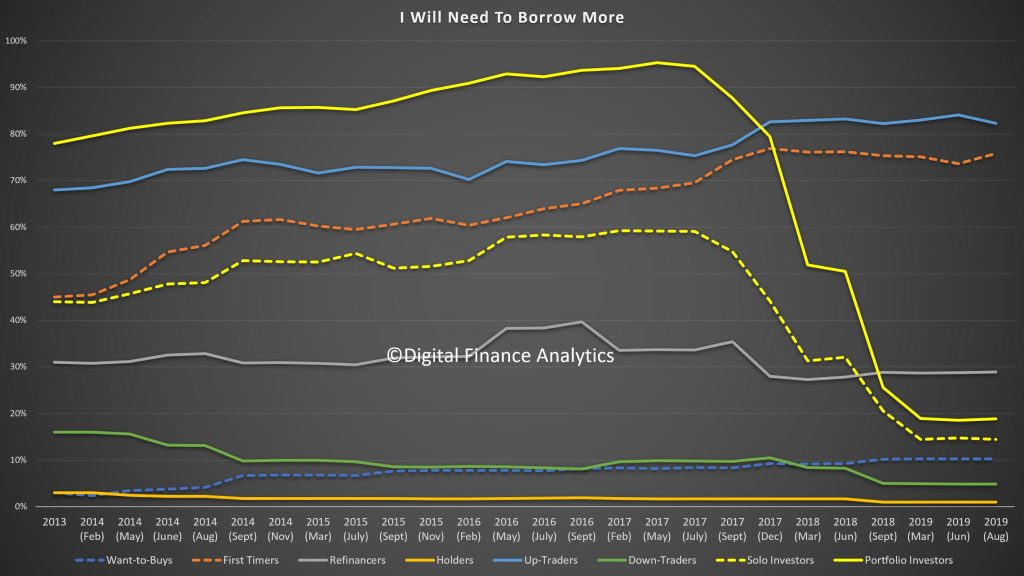
Finally, today demand for more credit is coming from Up-Traders, First Time Buyers and Refinancers. Not Investors.

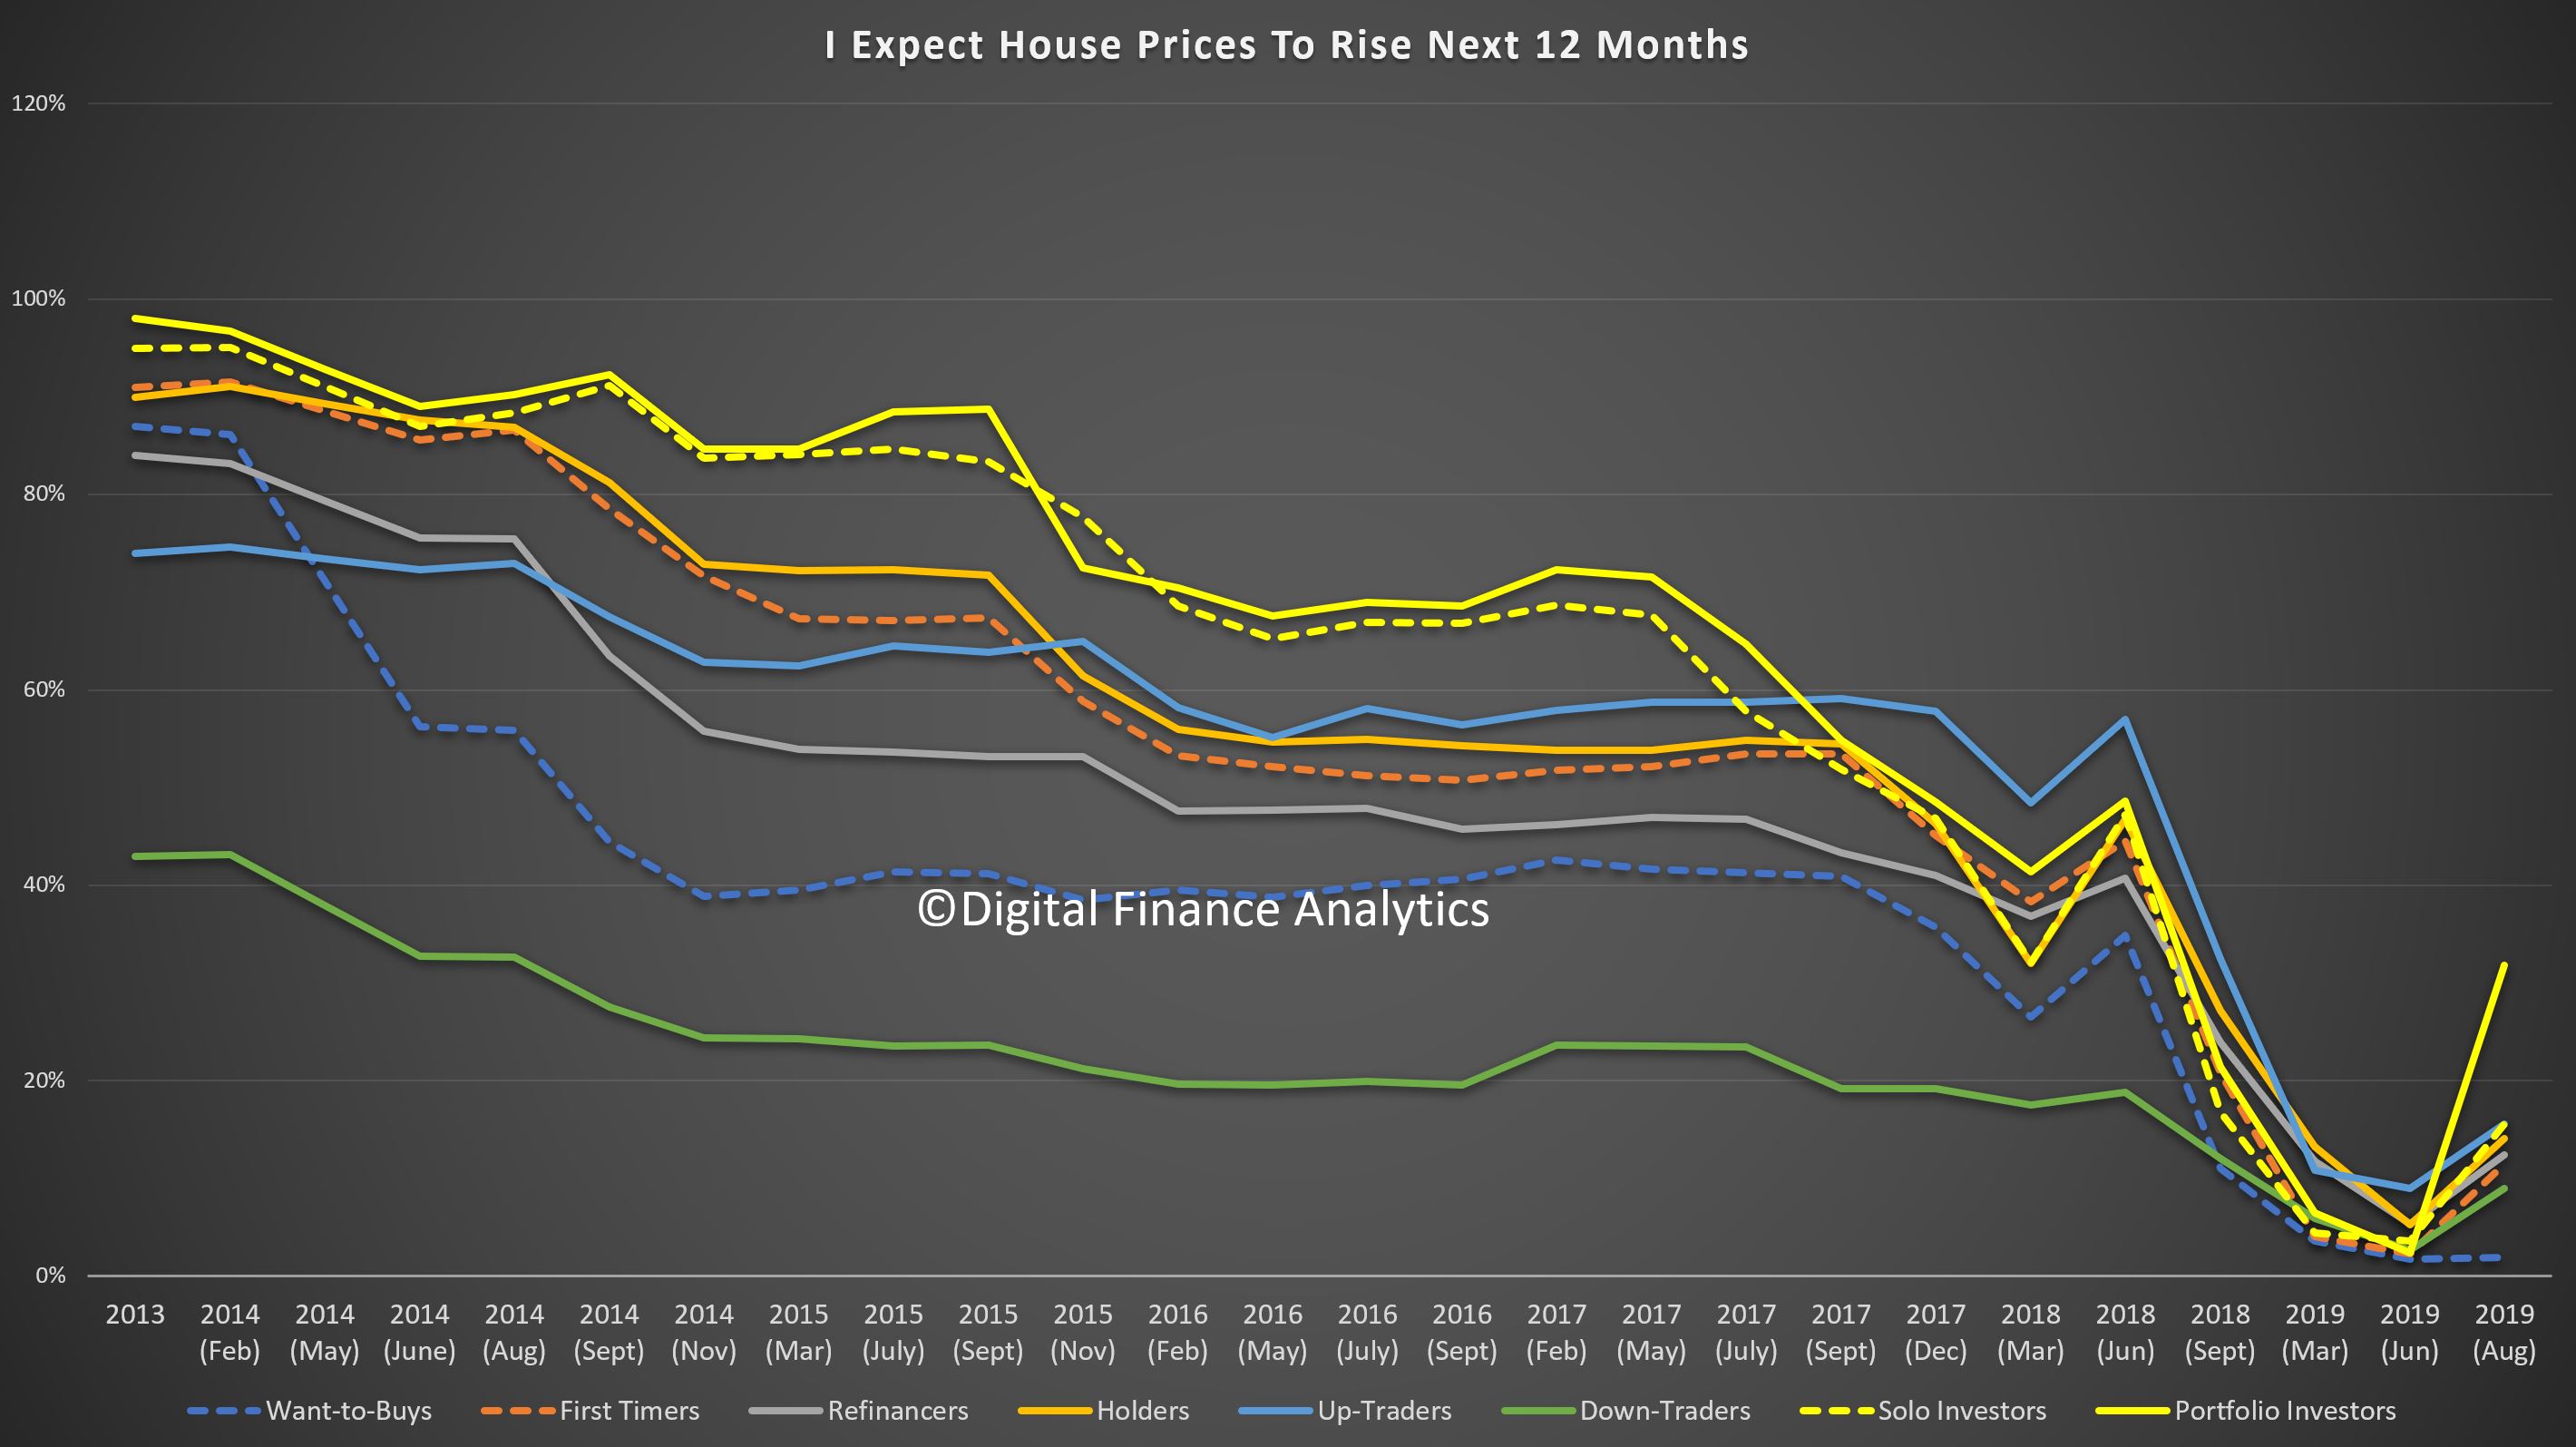
And price expectations seem to be on the improve, driven by investors. But it is still lower than a couple of years ago.

Next time we will dive into the segment specific drivers.

APRA On The Changing Landscape – And What We Don’t Know

Interesting speech from Wayne Byers “Reflections on a changing landscape“. He discussed the ” extraordinary intervention” to save our banks a decade ago (in a footnote), significant in my view, for what it said, and for what it missed out. There is no mention that both NAB and Westpac required bailing out by the FED’s TAF after the GFC. An important little fact?

APRA’s activities have expanded significantly over the past five years. This has not been a smooth transition: the regulatory pendulum has swung between periods of significant regulatory change, and times when there have been demands to pare back. But overall there is no doubt that expectations of APRA have grown, and they have pushed us into new fields of endeavour. There is no sign that tide is going to turn soon.

I’m not sure what the issues de jour will be in five years’ time but there’s a very good chance they will not be the issues we think are most important today. The past five years has shown that what might seem unusual or out of scope today, can quickly become a core task tomorrow. Some of the topics that I have talked about tonight were not seen, five years ago, to be at the heart of APRA’s role.

In contrast, later this week we will publish our 4 year Corporate Plan and a number of them will be called out as our core outcomes, ranking alongside maintaining financial safety and resilience. 

If there is one lesson from the past five years, it is that – be it regulators or risk managers – being ready and able to respond to the demands of a rapidly changing landscape is probably the most important attribute we all need to possess.

But the footnote was the most interesting in my view. For what it said, and for what it missed out.

It is sometimes said the Australian banking system ‘sailed through’ the financial crisis. While the system did prove relatively resilient, there was extraordinary intervention necessary to keep the system stable and the wheels of the economy turning.

That included (i) an unprecedented fiscal response – one of the largest stimulus packages in the world;

(ii) an unprecedented monetary response – the official cash rate was cut by 425 basis points in a little over six months;

(iii) the RBA substantially expanded its market operations and balance sheet;

(iv) ASIC imposed an 8-month ban on the short selling of financial stocks; and

(v) the Federal Government initiated a guarantee of retail deposits of up to $1 million, and a facility for authorised deposit-taking institutions (ADIs) to purchase guarantees for larger deposits and wholesale funding out to 5 years (indeed, at one point more than one-third of the banking system’s entire liabilities were subject to a Commonwealth Government guarantee).

As I have said previously, if all of the above was needed to keep the system stable and operational, then it is difficult to argue that the system sailed through or that some further strengthening of regulation was not justified.

He failed to mention the massive bail-out of our banking system from the FED and the fact that it was China’s response which supported our economy. The evidence suggests we were much closer to the abyss than was acknowledged at the time. Westpac and NAB both required support from the FED, as revealed in papers from the FED.

The US Dodd-Frank Act requires the US Federal Reserve to reveal which institutions it loaned money to under the various bail out programmes.

One of their programmes was the Term Auction Facility (TAF).

“Under the program, the Federal Reserve auctioned 28-day loans, and, beginning in August 2008, 84-day loans, to depository institutions in generally sound financial condition… Of those institutions, primary credit, and thus also the TAF, is available only to institutions that are financially sound.

Now of course the question is what does “financially sound” institutions mean. Well, look at the entire list – its long, but some of the names will be familiar. The FED data shows more than 4,200 separate transactions across more than 400 institutions globally between 2008 and 2010.

UK based Lloyds TSB plc received USD$10.5 billion – and was later partially nationalised by the UK government.

And another UK Bank, the Royal Bank of Scotland (RBS) got US$53.5 billion plus and additionally US$1.5 billion for its exposures via ABN Amro after RBS bought it. That was nationalised too.

In Ireland, Allied Irish Bank needed US$34.7 billion of loans from the Fed between February 2009 and February 2010 . This is the bank bailed out via the Irish taxpayer.

And Deutsche Bank needed a massive US$76.8 billion in loans in total (and that bank continues to struggle today).

The list goes on. Bayerische Landesbank required a US$13.4 billion bailout from the state of Bavaria, but also borrowed US$108.19 billion between December 2007 and October 2009.

Where these banks sound?

And our own “financially sound” institutions National Australia Bank and Westpac needed help from the Fed. NAB needed around $7 billion in total (allowing for the exchange rate).

In fact NAB raised $3 billion from shareholders in 2008 to add capital to its business in parallel.

And in January 2008 Westpac said everything was fine with its US exposures, just one month after they got their first bail-out from the FED, worth US$90 million.

In fact, there was a long queue then, as the Fed spreadsheet shows that alongside Westpac, was Citibank, Lloyds TSB Bank, Bayerische Landesbank and Societe Generale, all of whom where bailed out by Governments in their respective countries.

Now, the RBA wrote at the time:

The Australian financial system has coped better with the recent turmoil than many other financial systems. The banking system is soundly capitalised, it has only limited exposure to sub-prime related assets, and it continues to record strong profitability and has low levels or problem loans. The large Australian banks all have high credit ratings and they have been able to continue to tap both domestic and offshore capital markets on a regular basis.”

So the question is did APRA and the RBA know what was going on?

And my question more generally is how prepared are we for a similar crisis now – given the changed economic and geopolitical forces in play?

Older Australians Mortgage Debt Up 600 per cent; Impacting Mental Health

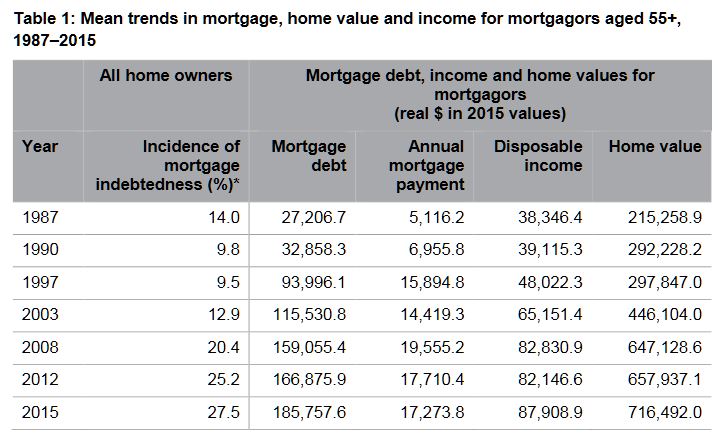
Between 1987 and 2015, average real mortgage debt among older Australians (aged 55+ years) blew out by 600 per cent (from $27,000 to over $185,000 in $2015), while their average mortgage debt to income ratios tripled from 71 to 211 per cent over the same period, according to new AHURI research.

The research, Mortgage stress and precarious home ownership: implications for older Australians, undertaken for AHURI by researchers from Curtin University and RMIT University, investigates the growing numbers of older Australians who are carrying high levels of mortgage debt into retirement, and considers the significant consequences for their wellbeing and for the retirement incomes system.

‘Our research finds that back in 1987 only 14 per cent of older Australian home owners were still paying off the mortgage on their home; that share doubled to 28 per cent in 2015’, says the report’s lead author, Professor Rachel ViforJ of Curtin University.

‘We’re also seeing these older Australians’ mortgage debt burden increase from 13 per cent of the value of the average home in the late 1980s to around 30 per cent in the late 1990’s when the property boom took off, and it has remained at that level ever since. Over that time period, average annual mortgage repayments have more than tripled from $5,000 to $17,000 in real terms.’

When older mortgagors experience difficulty in meeting mortgage payments, wellbeing declines and stress levels increase, according to the report. Psychological surveys measuring mental health on a scale of 0 to 100 reveal that mortgage difficulties reduce mental health scores for older men by around 2 points and an even greater 3.7 points for older women. Older female mortgagors’ mental health is more sensitive to personal circumstances than older male mortgagors. Marital breakdown, ill health and poor labour market engagement all adversely affect older female mortgagors’ mental health scores more than men’s.

‘These mental health effects are comparable to those resulting from long-term health conditions,’ says Professor ViforJ. ‘As growing numbers of older Australians carry mortgages into retirement the rising trend in mortgage indebtedness will have negative impacts on the wellbeing of an increasing percentage of the Australian population.’

High mortgage debts later in life also present significant challenges for housing assistance programs. The combination of tenure change and demographic change is expected to increase the number of seniors aged 55 years and over eligible for Commonwealth Rent Assistance from 414,000 in 2016 to 664,000 in 2031, a 60 per cent increase. As a consequence the real cost (at $2016) of CRA payments to the Federal budget is expected to soar from $972 million in 2016, to $1.55 billion in 2031. The unmet demand for public housing from private renters aged 55+ years is also expected to climb from roughly 200,000 households in 2016, to 440,000 households in 2031, a 78 per cent increase.

There are also challenges for Government retirement incomes policy. The burden of indebtedness in later life is growing; longer working lives and the use of superannuation benefits to pay down mortgages are increasingly likely outcomes.

Mortgage Broker Best Interest Draft Bill Released

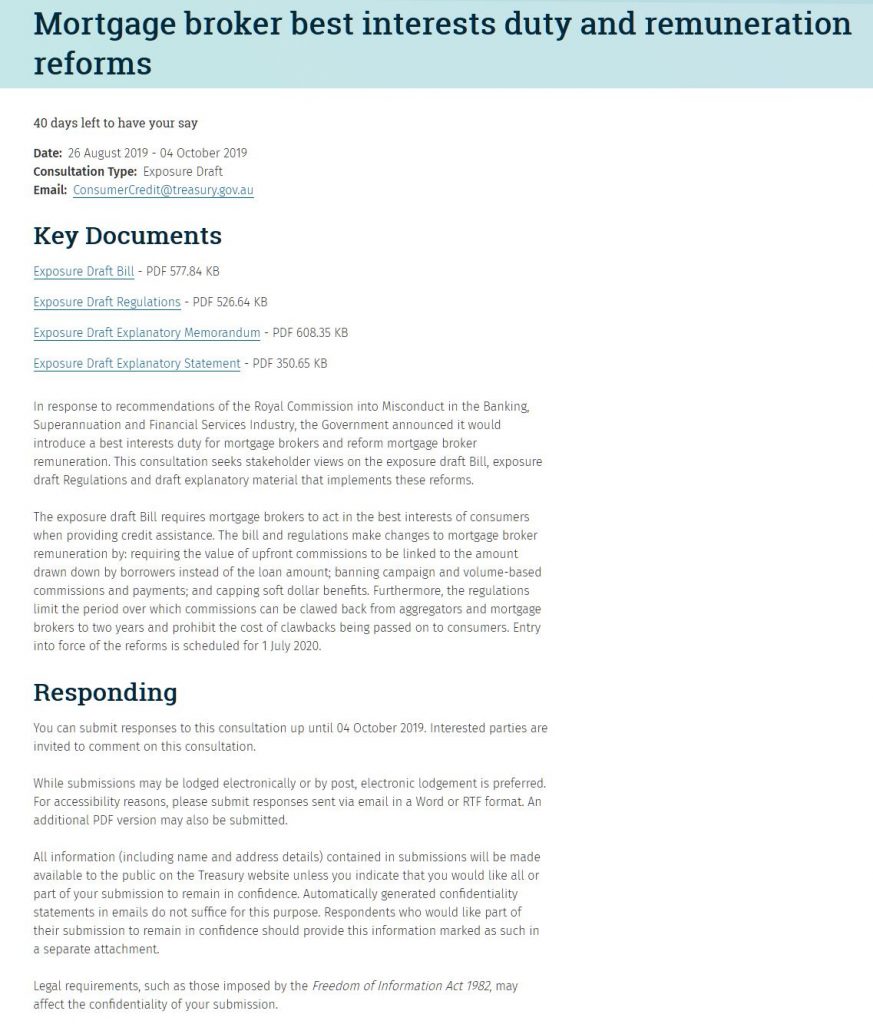
The Treasure has released an exposure draft of the proposed Mortgage broker best interests duty and remuneration reforms.

The National Consumer Credit Protection Amendment (Mortgage Brokers) Bill 2019 — containing a new bests interest duty obligation on mortgage brokers, as recommended by Commissioner Kenneth Hayne in the final report of the banking royal commission.   Via The Adviser.

The bill states that brokers “must act in the best interests of consumers when giving credit assistance in relation to credit contracts”, meaning:

  • where there is a conflict of interest, mortgage brokers must give priority to consumers in providing credit assistance in relation to credit contracts,
  • mortgage brokers and mortgage intermediaries must not accept conflicted remuneration — any benefit, whether monetary or non-monetary that could reasonably be expected to influence the credit assistance provided or could be reasonably expected to influence whether or how the licensee or representative acts as an intermediary.
  • employers, credit providers and mortgage intermediaries must not give conflicted remuneration to mortgage brokers or mortgage intermediaries.

The draft bill, which is open for consultation until 4 October, notes that the duty to act in the best interests of the consumer in relation to credit assistance is a “principle-based standard of conduct” and “does not prescribe conduct that will be taken to satisfy the duty in specific circumstances”.

“It is the responsibility of mortgage brokers to ensure that their conduct meets the standard of ‘acting in the best interests of consumers’ in the relevant circumstances,” the bill states.

According to the bill, the content of the duty “ultimately depends on the circumstances in which credit assistance is provided”.

Examples of such content cited in the draft bill include:

  • prior to the recommendation of a credit product, it could be expected that the mortgage broker consider a range of such products (including the features of those products) and inform the consumer of that range and the options it contain,
  • any recommendations made could be expected to be based on consumer benefits, rather than benefits that may be realised by the broker (such as commissions);
  • in cases where critical information is not obtained when inquiring about a consumer’s circumstances, the broker could be expected to refrain from making a recommendation about a loan where there is a consequent risk that the loan will not be in the consumer’s best interests;
  • a broker would not suggest a white-label home loan that has the same features as a branded product from the same lender, but with a higher interest rate, because it would not be in the best interests of the consumer to pay more for an otherwise similar product; and
  • during an annual review, a broker would not suggest that the consumer remain in a credit contract without considering whether this would be in the consumer’s best interests.

In addition to the new best interests obligation, the draft bill requires a mortgage broker to “resolve conflicts of interests in the consumer’s favour”.

The bill states that “if the mortgage broker knows, or reasonably ought to know”, that there is a conflict between the interests of the consumer and the interests of the broker or a related party, the mortgage broker “must give priority to the consumer’s interests”.

As an extension to the best interests duty, the bill builds on remuneration reforms proposed by the Combined Industry Forum, which includes:

  • requiring the value of upfront commissions to be linked to the amount drawn down by borrowers instead of the loan amount;
  • banning campaign and volume-based commissions and payments; and capping soft dollar benefits.

The proposed regulations also limit the period over which commissions can be clawed back from aggregators and mortgage brokers to two years and prohibit the cost of clawbacks being passed on to consumers.

The new provisions are scheduled for implementation by 1 July 2020.

ABC Joins The Cash Ban Dots

Hot on the heels of their previous post comes another article from ABC news which makes the link between the $10k cash ban, negative interest rates and the IMF. It’s titled “Banning cash so you pay the bank to hold your money is what the IMF wants“.

This is something which followers will know we have been highlighting for some time.

This theory … has not been plucked out of thin air.

It is based on repeated public papers and statements by the international body in charge of financial stability — the Washington-based International Monetary Fund (IMF).

A recent IMF blog entitled “Cashing In: How to Make Negative Interest Rates Work”, explains its motive in wanting negative interest rates — a situation where instead of receiving money on deposits, depositors must pay regularly to keep their money with the bank.

As the blog notes, during the global financial crisis central banks reduced interest rates.

Ten years later, interest rates remain low in most countries, and “while the global economy has been recovering, future downturns are inevitable”.

“Severe recessions have historically required 3 to 6 percentage points cut in policy rates,” the IMF blog observed.

“If another crisis happens, few countries would have that kind of room for monetary policy to respond.”

The article then goes on to explain that to “get around this problem”, a recent IMF staff study looked at how it could bring in a system that would make deeply negative interest rates “a feasible option”.

The answer, it said, is to phase out cash.

The Future Of Cash – A Questionnaire

We look at the future of cash in the light of the emergence of a global digital currency, and the paper released for discussion by the Reserve Bank of New Zealand.

https://www.rbnz.govt.nz/notes-and-coins/future-of-cash

New Zealand viewers have until 31st August to make a submission.