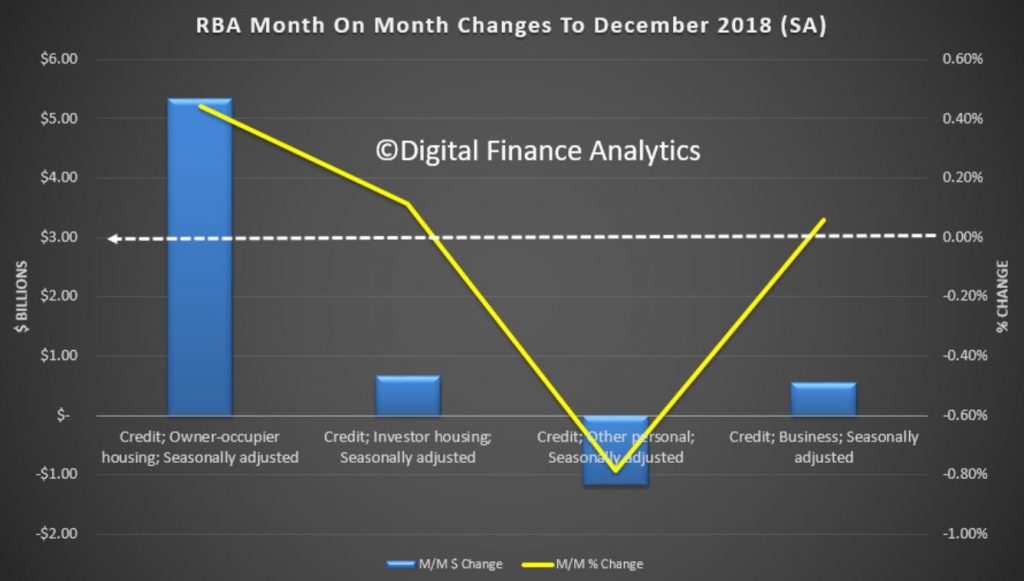
The December 2018 data from the RBA has been released today, and credit growth continues to slow, led down by both housing and business finance. That said total credit is still expanding, and housing credit reached a new record, $1.8 trillion dollars. Within that Owner occupied loans were reported at $ 1.21 trillion dollars and Investment loans $0.59 trillion, accounting for 32.9% of all housing lending. Credit to business was up a little to 32.8% of all lending stock. Personal credit shrank again.
The share of lending for housing investment fell again, while the business mix was up just a little.
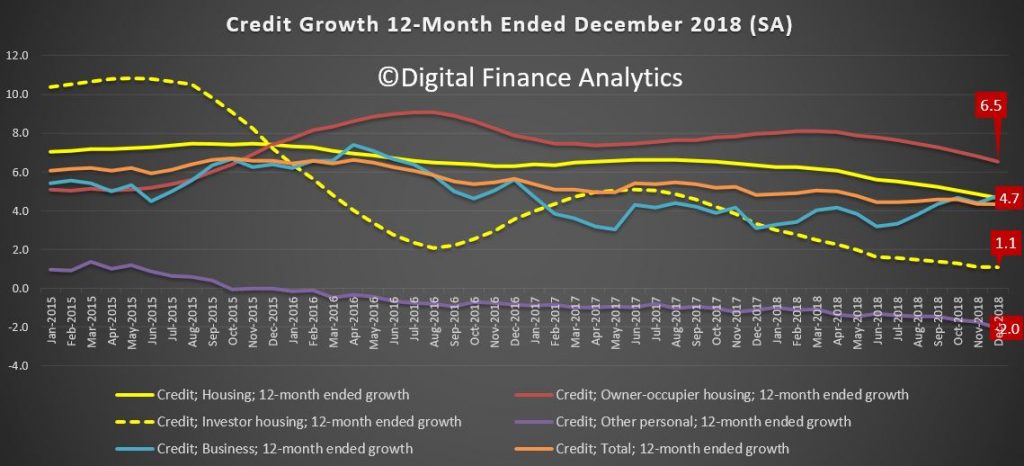
Total credit for housing was an annualised 4.7% compared with 6.3% a year ago. Personal credit was down again, to -2.0% over the past year, compared with -1.1% a year before, and business credit was at 4.8% compared with 3.1% a year back.
Within the housing sector, home lending for investment purposes was at 1.1% and for owner occupation a (still massive) 6.5%. Still way higher than inflation and wages, so household debt ratios will continue to deteriorate.
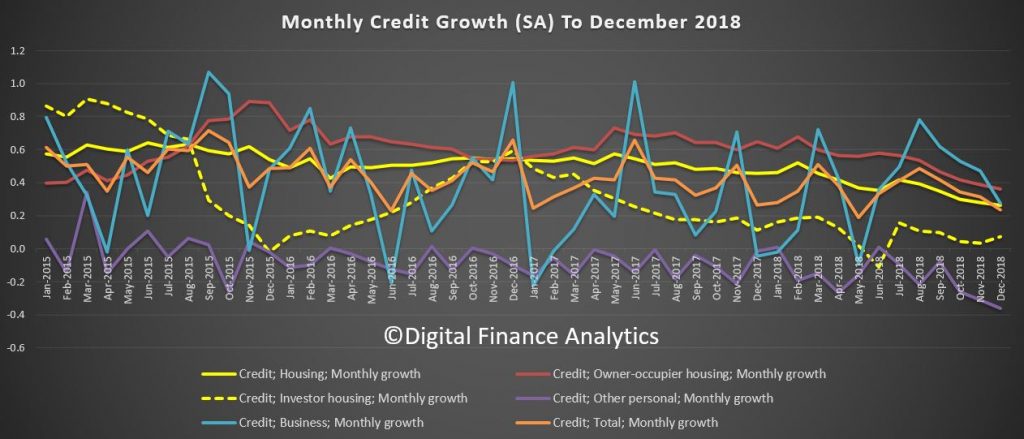
The monthly movements show a fall in business lending momentum and owner occupied lending, though a small uptick in investor loans, if from a low base.
The APRA data is also out today, so we will look at this later… But we can conclude the overall growth in housing lending is still building more risks in the market, despite all the hype. Credit loosening should be resisted.
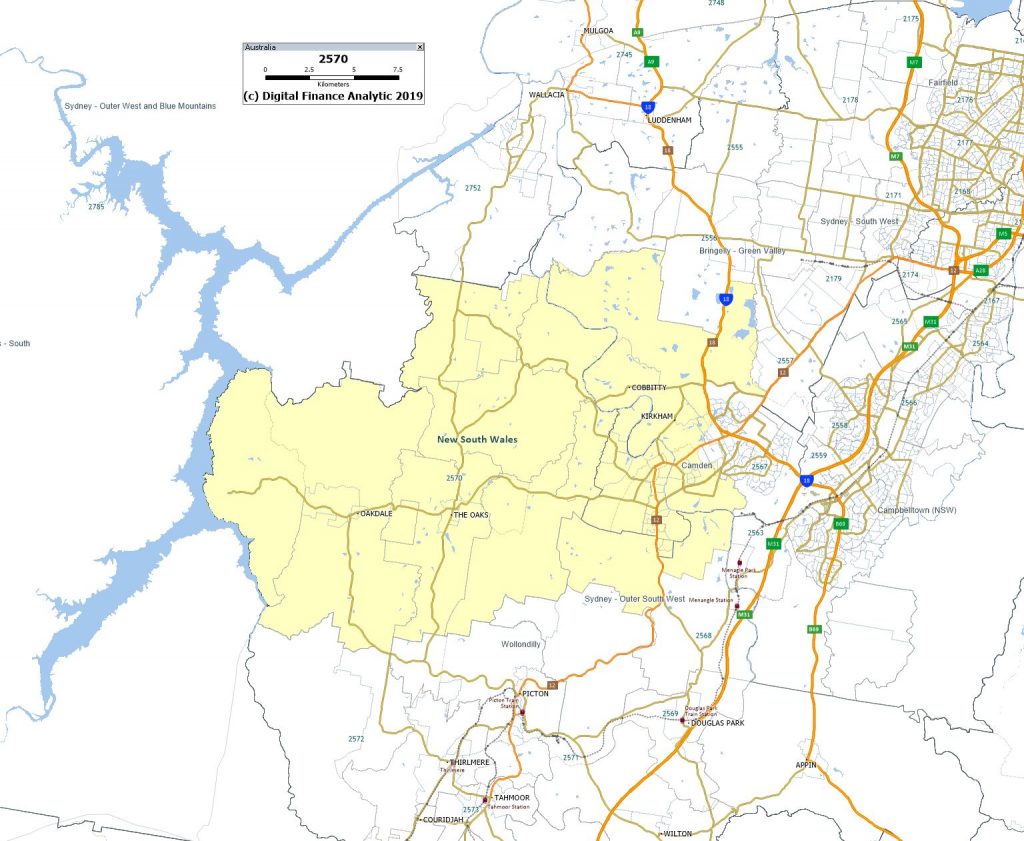
John and Martin discuss the economic and social horrors that are currently playing out in postcode 2570 which is in the Camden Area (South West Sydney).
The postcode includes the Camden area as well as Oran Park. This postcode got John Adams’ attention after a Sydney Morning Herald article reported earlier this week that the Camden area has seen a significant spike in domestic violence (DV) which the police has said is due to mortgage stress!
This story is intriguing given that John Adams’ was warning in 2018 of massive social consequences from poor economic crisis prior to and after the coming economic crisis.
Today we discuss how banks lend, and why the idea that bank deposits
limit bank lending is plain wrong and helps to explain why home prices
have exploded in recent years.
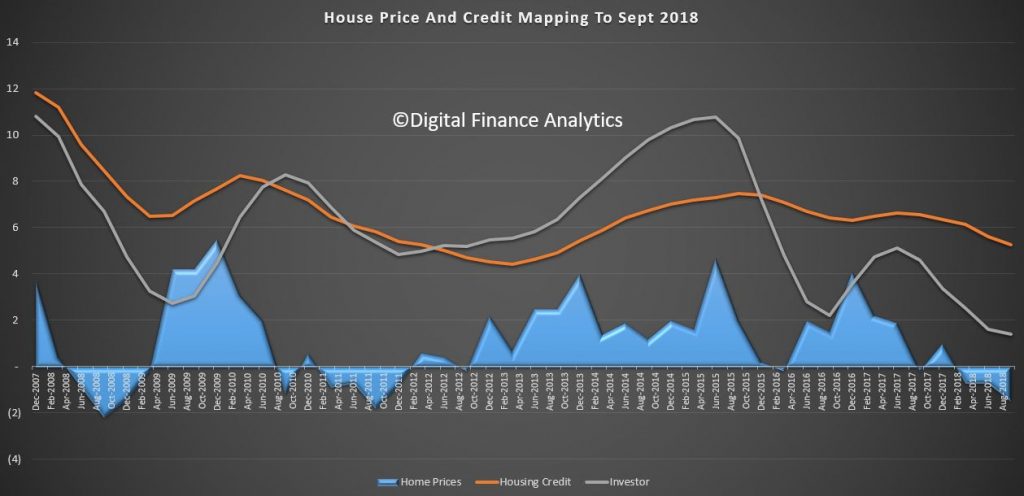
The correlation between home prices and credit availability
are clear to see. We have updated this chart to take account of 2018 data. As
credit rose from 2012 onward, home prices did too. It also suggests that if
credit availability is tightened, we should expect prices to fall – take note,
given the current tighter underwriting standards now in force. This is why I
predict ongoing falls in property prices.
And more specifically, credit for property investment is
even more strongly correlated. As we know investors are attracted by the
capital growth, and also the capital gains and negative gearing tax breaks
available.
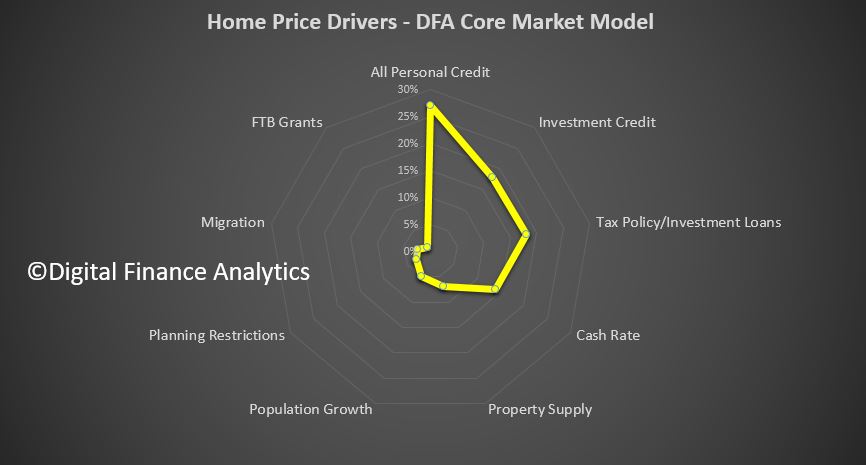
What’s most interesting is the relative weight of these
different factors in driving home prices. The four most powerful levers in
terms of home prices is first overall growth in personal credit, including
mortgages and other loans at 27% of total impact. Investment lending
contributed a further 18%, followed by tax policy for investment property
at 17% and the cash rate at 14%. The other factors, the ones which are spoken
about the most, property supply, population growth, planning restrictions and
migration, together make up just 22% of total impact. Or in other words,
without addressing the credit elephant in the room, tax policy and interest
rates, the chances of taming prices is low. First time buyer incentives were
less than 1%!
So the greatest of these is credit policy, which has for
years allowed banks to magic money from thin air, to lend to borrowers, to
drive up home prices, to inflate the banks balance sheet, to lend more to drive
prices higher – repeat ad nauseam! Totally unproductive, and in fact it
sucks the air out of the real economy and money directly out of punters wages,
but make bankers and their shareholders richer. Plus, the second order impacts
to the construction sector.
Two final observations. First the GDP calculation we use in
Australia is flattered by housing growth (triggered by credit growth) and
construction activity. The second driver of GDP growth is population
growth. But in real terms neither of these are really creating true
economic growth, as seen in the per capita data.
Second, the capital regulatory framework from the Bank For
International Settlements is still a hangover from the days when deposits were
thought to drive loans – so holding a ratio of assets to protect deposits made
sense. But given the multiplier effect available to banks via their ability to
issue bonds and the like increase their loan books, the BIS rules as currently
formulated are ineffective. In fact by applying low risk weights to mortgage
loans, they encourage to banks to leverage up more – in Australia our major
banks have only about 5%of shareholder capital at risk. This is way too low.
To, conclude, to solve the property
equation, and the economic future of the country, we have to address
credit. But then again, I refer to the fact that most economists still think
credit is unimportant in macroeconomic terms!
The alternative is to continue to let credit grow well above
wages, and lift the already heavy debt burden even higher. In fact, some are
calling for a reversal of recent credit tightening to resurrect home price
growth. But, that is, ultimately unsustainable, and why there will be an
economic correction in Australia, and quite soon.
Welcome to the Property Imperative weekly to the twenty sixth of January 2019, – Australia day – our digest of the latest finance and property news with a distinctively Australian flavour.
Watch the video or read the transcript.
This week, amid weaker global economic news, there were signs that more stimulus of the financial system is coming, in response to weak growth, stalling inflation, and still low interest rates. Looks like QE2 is just around the corner – meaning more debt, and higher asset prices will devalue the true value of money further. The debt can will indeed, as expected, be kicked down the road, to support the financial system, incumbent governments and the 1%, as real people get taken to the cleaners – again.
And by the way if you value the content we produce please do consider supporting our efforts. You can make a one off donation via PayPal, or consider joining our Patreon programme. We really appreciate those who are contributing to help us continue to make great content.
We start with the global scene, with Fitch ratings reporting that Global
government debt reached 66 trillion US dollars at end-2018, nearly double its
2007 level and equivalent to 80% of global GDP.
Developed market government debt has been fairly stable in US dollar
terms, at close to 50 trillion US dollars since 2012. In contrast, Emerging
market debt has jumped to 15 trillion US dollars from 10 trillion over the same period, with the
biggest increases in percentage terms being in the Middle East and North Africa
(104%) and Sub-Saharan Africa (75%), though these regions still have
comparatively low debt stocks, at less than 1 trillion US dollars each.
And Fitch also pointed out
that recent corporate defaults – including Snton, Reward and KDX in China, have
highlighted the risk of broader disclosure and governance problems among
Chinese corporates, as well as the variable quality of local auditing, despite
these companies having reported under agreed accounting standards. You can see our recent discussion with Robbie
Barwick on the problems created by the big four Auditing firms, and why the CEC
is calling for an audit of our big four banks – see “Auditing The Banks
– The Bankers’ Deadly Embrace”.
And among the Davos circus, The IMF’s latest
World Economic Outlook Update, January 2019, says that global growth in 2018 is
estimated to be 3.7 percent, as it was last fall, but signs of a slowdown in
the second half of 2018 have led to downward revisions for several economies.
Specifically, growth in advanced economies is projected to slow from an
estimated 2.3 percent in 2018 to 2.0 percent in 2019 and 1.7 percent in 2020. Weakness
in the second half of 2018 will carry over to coming quarters, with global
growth projected to decline to 3.5 percent in 2019 before picking up slightly
to 3.6 percent in 2020 (0.2 percentage point and 0.1 percentage point lower,
respectively, than in the previous WEO). This growth pattern reflects a
persistent decline in the growth rate of advanced economies from above-trend
levels—occurring more rapidly than previously anticipated—together with a
temporary decline in the growth rate for emerging market and developing
economies in 2019, reflecting contractions in Argentina and Turkey, as well as
the impact of trade actions on China and other Asian economies.
Specifically, growth in advanced economies is projected to slow from an
estimated 2.3 percent in 2018 to 2.0 percent in 2019 and 1.7 percent in 2020.
This estimated growth rate for 2018 and the projection for 2019 are 0.1
percentage point lower than in the October 2018 WEO, mostly due to downward
revisions for the euro area. We
discussed this in our show “It Is Time To
Prepare For The Next Downturn”. Problem is the quest for growth is getting harder
as we reach peak debt.
Some high-ranking World Economic Forum participants at Davos spoke out
sharply negatively against Bitcoin, predicting that its price would literally
drop to zero. A little over a year ago, such statements caused a flurry of
market emotions. Now these messages are honoured only by a slight smirk. The
summary is simple: over the year the market has matured. The main awareness of
investors is that no one knows for sure the future of cryptocurrency, and
long-term growth forecasts up to “hundreds of thousands of dollars for a coin”
or “zeroing rates” are worthless and have no effect on anything.
Elsewhere ECB President Mario Draghi said this week that the risks
surrounding the euro area growth outlook have moved to the downside on account
of the persistence of uncertainties related to geopolitical factors and the
threat of protectionism, vulnerabilities in emerging markets and financial
market volatility.
This triggered a Euro sell-off to its lowest level since early December
2018, and the German economy looks especially exposed now. The ZEW Economic Sentiment for Germany was
released this week, and the ZEW president said “It is remarkable that the ZEW
Economic Sentiment for Germany has not deteriorated further given the large
number of global economic risks”. The
German economy has been grinding along at 1.5% per annum, the lowest in five
years, and recent forecasts suggest a lower 1.1% ahead, thanks to basket of
risks including Brexit. But as Bloomberg said, one main factor behind the slump
in the German manufacturing sector was the failure of inflation, particularly
producer price inflation to drop in line with the tumbling price of oil in
recent months. That’s in part, because of what’s happening to the Rhine, which
has seen its water levels drop after a drought during the summer. The Rhine is
crucial for German industry because it provides not only an avenue for the
distribution of raw materials to German manufacturers but also a means of
transporting finished goods to Europe’s largest port, Rotterdam, which sits at
the river’s mouth. Low water levels in the Rhine, translates into a “supply
shock in German manufacturing,” by lowering the availability of key goods
needed for the sector, which come to factories situated on the river by barge.
These barges need a depth of water to traverse the river above current levels.
And the latest from the US, is suggesting that the FED may have finished with interest rate hikes in the near term, and even their quantitative tightening agenda may be in question, in the light of the market reactions at the end of last year and pressure from political quarters in the US.
And to emphasize the “loosening” bias, in the UK, still in the Brexit muddle, the UK Financial Conduct Authority said they plan to improve so-called mortgage prisoners’ access to refinancing by relaxing current mortgage affordability regulations that preclude them refinancing into cheaper mortgage deals because they fail to meet affordability standards that were tightened in 2016. The FCA has suggested that authorised UK lenders would be willing to refinance such mortgage prisoners if the borrower qualified for refinancing under the new rules, which would require the new mortgage installments to be lower than previous installments and for the borrower to be up to date with their payments. The new rules would replace current affordability tests for these borrowers, which make sure a borrower has enough money left to pay their mortgage installments in a stressed interest rate environment after covering all other basic needs (e.g. bills, food, childcare).
This despite the continued unaffordable housing across many countries,
including the UK, as reported in the newly released 15th edition of
the Demographia survey. Once again it
shows that Australia and New Zealand property is unaffordable. Globally there
were 26 severely unaffordable major housing markets in 2018. As normal they
argue for planning reforms to release land, but do not consider credit
availability, the strongest lever to affordability! You can watch our show on this
“Housing Affordability – Still In The Doldrums”. The severely unaffordable major markets
include all in Australia (5), New Zealand (1) and China (1). Two of Canada’s
six markets are severely unaffordable. Seven of the 21 major markets in the
United Kingdom, and 13 of the 55 major markets in the United States are
severely unaffordable.
This is simply the fruits of unrelenting quantitative easing, money printing and easy credit. Yet we seem destined for more of the same.
Locally there was one bright spot this week, unemployment fell to a
record 5% low, according to the ABS data to
December 2018. The participation rate remaining steady at 65.6%; and the employment
to population ratio remaining steady at 62.3%. In fact, they revised down last
month’s data to get to the 5%, where it remained in December. This will temper
any RBA response to the falling housing market in our view. But of course the
hurdle to be “employed” is ultra-low, and many of the jobs are in sectors
paying low wages, plus we expect to see a rise in unemployed construction
workers ahead, so this may be a hollow victory.
But beyond that, you had to look hard to find any other good news on the
economy here this week. For example, following the heavy 15% decline in new car
sales in 2018, plus the 9% decline in motorcycle sales, Moody’s said
delinquencies for Australian auto loan asset-backed securities (ABS) has
surpassed Global Financial Crisis levels. These auto loans are non-revolving
with a fixed interest rate so they are an excellent benchmark to true credit
stress and this again shows the impact of high debt despite low interest rates.
As our mortgage stress analysis highlights, many households are up to their
eyeballs in debt.
And there was more evidence of the weakness in the Australian economy. The Economist took a bearish view, saying our housing market is now one of the most overvalued… Household debt has reached 200% of disposable income. The saving rate is skimpy… House prices have been falling for a year. Australia’s banks may not have been quite as conservative as previously advertised. The share of interest-only loans, favoured by speculators, was as high as 40%. The number of permits issued for apartment buildings has fallen. The momentum that drove the market up, as higher prices fuelled expectations of further gains, works in reverse too. The lucky country has avoided so many potential slip-ups that even long-standing bears are wary of predicting a fall. The more banana skins you dodge, the bigger the manhole waiting for you.
And we made a series of posts this week, which underscores the
pressures, mainly centred on housing and finance. For example, AFG, the mortgage
aggregator showed a significant slowing in loan applications in their latest
quarterly index. NAB lifted their mortgage
rates for existing variable rate borrowers, by up to 16 basis points, as NABs
chief customer officer Mike Baird said that the bank could no longer afford to
absorb higher funding costs. And AMP’s Shane Oliver upped his
expectation of home price falls in Sydney and Melbourne to 25%, see our post The “Good News” on Property Prices, where we discussed his reasoning, and also highlighted
that another half a percent of mortgage rate rises are on the cards thanks to
higher funding costs.
Following Domains property price trend falls, released this week, see our post “More Evidence of Home Price Falls”, CoreLogic’s home price index slide again. As a
result, the quarterly decline has steepened to 3.31%, across the five capital
cities, with Sydney, Melbourne and Perth worst hit. In the last year home
values have fallen by 7.1%, thanks mainly to falls in Sydney, Melbourne and
Perth. And from past peaks, dwelling values have fallen by 8.1%, led by Sydney
(-12.1%), Melbourne (-8.5%) and Perth (-16.3%). And remember these are
averages, some areas have done much worse.
CoreLogic says Weekly rents across the nation fell by -0.1% in December
2018 to be -0.3% lower over the fourth quarter of 2018 however, rents increased
by 0.5% over the 12 months to December 2018. Capital city rents were -0.4%
lower over the quarter and unchanged year-on-year while regional market rents
were 0.3% higher over the quarter to be 1.8% higher over the past 12 months. The
annual change in both combined capital city and national rents is the lowest on
record based on data which is available back to 2005. Over the past 12 months,
rents have increased in all capital cities except for Sydney and Darwin. Brisbane
and Perth are the only two capital cities in which the annual change throughout
2018 has accelerated relative to the change in 2017.
NAB’s latest property survey to December 2018, showed that confidence,
prices and transaction expectations are all falling, no surprise there. Average survey expectations for national
house prices for the next 12 months were cut back further in Q4, and are now
tipped to fall -2.4% (-1.0% in Q3). This
largely reflected a big downward revision by property professionals in VIC, who
now expect prices to fall by a much bigger -4.0% (-2.4% forecast in Q3). In
NSW, expectations were also scaled back heavily to -3.9% (-2.4% forecast in Q3).
As a result, VIC has also replaced NSW as the weakest state for house price
growth in the next 12 months. Falling
house prices are expected to extend beyond VIC and NSW. In SA/NT, average
prices are also expected to fall 0.4% (-0.3% in Q3). In QLD, property
professionals now believe prices will fall -0.5% in the next 12 months, after
forecasting growth of 0.8% in the previous survey. WA is the only state in
which property professionals don’t expect prices to fall in the next 12 months
(0.0%), albeit expectations have been scaled back from 0.5% forecast in Q3.
Consequently, WA has replaced QLD for having the best prospects for house
prices in the country in the next 12 months.
In early-December, NAB Economics revised down their house price forecasts,
seeing a larger peak to trough fall of around 10-15% in capital city dwelling
prices. House prices continued to fall Q4 alongside the cooling in the housing
market more generally. Capital city house prices declined by 6.1% in 2018, and
are now 6.7% lower than their peak in mid-2017… Overall, they expect some
further price declines in 2019, before levelling out in 2020. We expect the
weakness to be driven by ongoing declines in Sydney and Melbourne…
But the killer was the data on foreign buyer transactions, which shows a significant fall in both new and established home purchases. And linked to that, and the fall in new building approvals, the Australian reported that more building firms are under pressure. “Dozens of development sites in Sydney, Brisbane and Melbourne, some large enough for 600-unit apartment towers, are hitting the market as Chinese developers plagued by poor buyer appetite and lack of finance are forced to sell. “The apartment market is in serious trouble and development sites are falling in price. A lot of Chinese paid pretty big prices in 2016 and a lot of development sites doubled or trebled in value between 2014 and 2018 and they will halve or worse,” Property Developer David Kingston told The Australian. “I am certain the Chinese will be selling development sites for multiple reasons including the fact that development margins have disappeared and values have plummeted. The ability to obtain development finance has been substantially reduced, and the ability to pre-sell apartments has collapsed.”
We appeared in a number of television shows this week, I took part in a
discussion on Peter Switzer’s
Money Talks, along with Michael Blythe from CBA and Nicki Hutley from Deloitte, making
my case for more sustained falls in home prices, compared with the mainstream –
we will see who is right in a year or two!
I discussed the latest trends in home prices on ABC News 24, and also discussed the latest on the high-rise
building fiasco, after the Opal Tower. Talking, of which the Australian has reported that
The NSW government could be liable for any major defects in at least four major
apartment projects in Sydney Olympic Park as well as a flagship tower in the
city’s $8 billion Green Square project under its own laws that define the
“developer” as the legal owner of the land… Under NSW statutory warranties, the
owners corporation of an apartment block can sue the developer and builder
within two years for minor defects and six years for major defects. Sydney Olympic Park Authority, a NSW
government entity, was the legal landowner in the case of Opal Tower and Ecove,
the developer, never owned the land. Sydney Olympic Park Authority has
confirmed it had a similar Project Delivery Agreement with four other of its
projects: Australia Towers, Jewel, The Pavilions and Bennelong… The NSW
government’s property developer, Landcom, likewise said it retained ownership
of the land at Green Square… Remember
that under the six-year warranty period introduced via the recent Home Building
Act, those people living in high-rise constructed prior to 2012 don’t even have
the option of taking a builder to court – they must fund any remediation works
themselves.
And finally, I spent more than 3 hours with Nine’s Sixty Minutes team,
making a contribution to their next programme on home prices, in which we
touched on our home price scenarios (now more mainstream that during the
previous show back last August), household finances and negative equity. It is
likely to go to air within the next month, so keep an eye out for it.
So to the markets. The Australian markets, did pretty well, with the ASX
up 0.61% on Friday to 4,869, which is down just 2.6% compared with a year ago.
The low employment number helped to lift prices higher. The volatility index in Australia was 4.21%
lower on Friday to end at 11.98, but is still 11.2% higher than a year ago. The
ASX financials index ended the week at 5,747 on Friday, and up 0.37% on the
day, but still 11.71% lower than a year ago, which really underscores the
pressures on the sector – the Royal Commission final report is due next week,
but it may be delayed for political reasons. We will see.
Among the individual banks, ANZ was up 1.04% on Friday to 26.19 but is
still 10% lower than a year ago, while CBA was up just 0.04% on Friday to
72.54, and is 7.91% lower than a year ago. NAB rose 0.65% to 24.74 after the
mortgage repricing announcement, but remains 15.58% lower than a year ago,
while Westpac was up 0.62% to 25.88, and is 16.69% lower than a year ago. So
the Hain effect is fully visible.
Among the regionals, Bank of Queensland was up 1.28% to end at 10.28,
but is 17% lower than a year ago, Suncorp was up 0.69% to 13.05, but down 5%
over the past year, Bendigo and Adelaide Bank was up 0.63% to 11.22, just 2%
lower than a year back, while AMP fell 7.87% on more bad news, as they
published a further profit
warning, to end a 2.34, an amazing 54% lower than a year ago. AMP expects to
report an underlying profit of “around $680m” and profit attributable to
shareholders of “approximately $30m. Macquarie Group was down slightly to 117.81
but up 12.53% compared with a year ago. In contrast Lenders Mortgage Insurer
Genworth was up 0.89% on Friday to 2.26, but down 23% over the year, and
Mortgage Aggregator Mortgage Choice was up 0.5% to 1.00, but down 59% from this
time last year.
The Aussie was up 0.10% to 71.90, down 12% compared with last week, and
more analysts have marketed to lower ahead, towards 60 cents. The Gold Aussie
cross was up 0.47% to 1,815, and up 7% on the year. The Aussie Bitcoin Cross
was up 4.65% to 4,702 on Friday but down 67.58% compared with a year ago.
Wall Street gained ground on Friday in a broad-based rally as investors
were heartened by news that Washington would move to temporarily end the
longest U.S. government shutdown in history. All three major U.S. stock indexes
advanced, with the Dow up 0.75% to end at 24,737, though still down 6% across
the year, and the Nasdaq eking out their fifth straight weekly gains, up 1.29%
to 7,165 and down 3% from a year ago. But the S&P 500 posted its first
weekly loss of the year, despite being up 0.85% on Friday to 2,665 snapping a
four-week run and down 6% from a year ago, and the S&P 100 ended up 0.74%
to 1,176 and down 7% from a year back.
The indexes backed off their highs after President Donald Trump
confirmed he and lawmakers agreed to advance a three-week stop-gap spending
plan to reopen the government. In fact, Investor sentiment had faltered in
recent days in the face of revived jitters related to the shutdown and the
prolonged U.S.-China tariff spat.
Among these uncertainties, the ongoing trade dispute between the United
States and China continues to worry investors. With the World Economic Forum in
Davos, Switzerland, nearing its conclusion, business leaders have expressed
worries over the tariff battles, saying they are “fed up” with
Trump’s policies. An escalation of the U.S.-China trade war would sharpen the
global economic slowdown already under way, according to a Reuters poll of
hundreds of economists worldwide.
In an interview with CNBC, Commerce Secretary Wilbur Ross shook investor
sentiment on trade on Thursday, saying that the U.S. was still “miles and
miles” from a trade deal with China. That came a day after Top White House
economic adviser Larry Kudlow denied that the U.S. had cancelled a trade
meeting with Chinese officials that was slated for this week. China’s Vice
Premier Liu He will return to the U.S. next week to resume the next round of
trade talks.
The rally on Wall Street was also propped up by expectations for a more
dovish tone from the Federal Reserve, when it meets next week, following a
report from The Wall Street Journal that the Fed is closer than expected to
ending its balance sheet unwind.
The VIX, or fear index was lower, down 7.78% on Friday to 17.42, but
still 65% higher than this time last year, suggesting elevated risk. The
S&P Financials index was up 1.73% on Friday to 431.73, but 13% lower than a
year ago, suggesting pressure on the sector.
Goldman Sachs was higher, up 1.49% to 200.74, but 26% lower than a year
ago.
In the tech sector, Apple was up 3.31% to 135.76, 12% lower than a year
ago, Alphabet Google was up 1.62% to 1,102, but 7% down from a year back, while
Amazon was 21% higher than a year ago, up 0.95% on the day, and ended at
1,670.57. Facebook was up 2.18% to 149.01, but is 22% down on this time last
year, while Intel fell 5.47% to end at 47.04, still up 9% from last year. The
10-year Treasury bond was up 1.71% to 2.76, while the 3-month bond was up 0.61%
to 2.38, suggesting fund costs will remain elevated.
The US dollar index fell 0.82% to end at 95.81, and is up 8.5% over the
year. The British pound grew steadily during this week, adding 2% against the
dollar and ended at 1.32. An unexpectedly strong wages report was supported in
the following days with positive buzz around Brexit. First, we received reports
of a possible postponement of the Brexit date in order to avoid “exit without
deal”. On Friday, there was news of support for Theresa May’s plan by the
Northern Irish political party.
The Footsie – or FTSE 100 fell 0.14% on Friday to end at 6,809 and 11%
lower than a year ago. The Financial Services Index fell slightly to end at
644.27, down 7% across the last year.
The British currency growth is particularly noticeable against the euro,
as the eurozone economy, on the contrary, saw weak economic data this week: at
the beginning of the week the IMF sharply reduced its growth forecasts for the
eurozone countries in 2019, and on Thursday EUR was under pressure due to
disappointing PMI estimates. On Friday, Ifo data also highlighted slowing.
Their Business Climate indicator fell to almost 3 years’ lows.
The ECB added fuel to the fire, stressing that external risks from China
to Brexit could undermine the region’s economic growth even more. ECB officials
say in their speeches that in 2019 the rate hike may not happen, and that the
recent decline of oil will put pressure on inflation in the coming months.
The Euro US Dollar rose a little to end at 1.1415, down 9% from a year
ago. The German DAX added 2.6% from Wednesday lows. Deutsche Bank rose 4.24% to
8.036, but is still down 51% from a year ago as the business restricting
continues. At least it went back above the 8 level, seen by many as a critical
break point.
Next week’s news from the US will be in the spotlight of the markets. On
Wednesday, the Fed will announce its decision on the rate and hold a press
conference; labour market indicators will be published on Friday. Many releases
on the US economy are postponed because of the shutdown, so the remaining publications
can cause a stronger than usual market response.
The Chinese Yuan US Dollar rose 0.61% on Friday to 0.1482, and is down
6% from a year ago. Oil was higher, up 0.75% to 53.53, still 19% down from this
time last year, Gold was up 1.77% to 1.302, but 6% lower than last year, Silver
was up 2.97% to 15,76, down 12% over the year, while copper was up 3.35% to
2.73, down 17% over the year.
Finally, bitcoin was down 0.21% to 3,633, following a flash crash
earlier in the week. It remains 68% lower than this time last year and trading
volumes are way down, as speculators take to the side lines. Analysts at
JPMorgan Chase & Co said that the hype surrounding cryptocurrencies and
blockchain — the distributed ledger technology that underpins all cryptocurrencies
— is a little overblown, with inroads to mainstream finance patchy at best.
They said that while advocates tout that most assets can be shifted to a
blockchain-type ledger and the technology will improve everything from
transparency to supply chain efficiency, results are yet to match the industry
buzz.
One sector ripe for a blockchain shake-up, according to crypto
evangelists, is the banking system. Cross-border payments with faster
transaction times and lower costs will propel digital currencies and blockchain
technology into the established banking industry, but the analysts said a
meaningful difference is years away.
Furthermore, a number of prominent companies that began accepting
bitcoin have since thrown in the towel, which includes Dell, Expedia, OKCupid
and Steam, JPMorgan noted. Whilst there may be niche uses in for example trade
finance, they conclude that “most other use cases, such as payments, are
already largely digitalized, so we expect the adoption of blockchain may be
viewed as providing incremental benefits.”
So, it seems to me that the market volatility at the end of last year
have spooked central bankers, and it is likely we will see more QE ahead.
Locally, there is talk of APRA dropping the current 7% serviceability cap to
ease mortgage lending restrictions, the RBA may cut rates, and even sacrifice
the Aussie to stimulate the local economy. However, the downforces on housing,
reinforced by poor affordability and high debt suggests to me that QE may not
be so effective, as we face into lower growth. With rates in many counties
already low, we are entering the “Zero Bounds” twilight zone. Whilst this may
support the overinflated banking system, the impact of real households could
well be disastrous. As I continue to say, prepare yourselves.
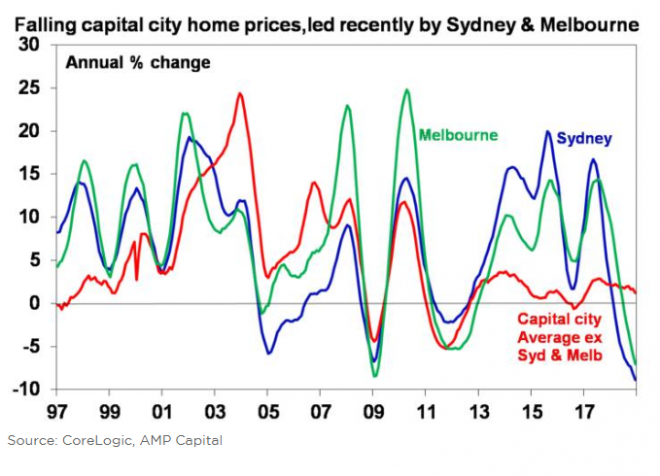
AMP Capital chief economist Shane Oliver believes house price falls could be greater than he anticipated following weak auction clearance figures, via InvestorDaily.
CoreLogic data shows that capital city dwelling prices are down 7 per cent from their September 2017 high.
Sydney prices are down 11 per cent from their July 2017 high, while Melbourne is down 7 per cent from its November peak.
For Sydney and Melbourne, AMP’s base case has been that prices would
have a top to bottom fall of around 20 per cent out to 2020. However,
looking at the data, AMP Capital’s top forecaster has reconsidered his
outlook.
“The further plunge in auction clearance rates and acceleration in
price falls late last year suggest a deeper fall – possibly of around 25
per cent (although it’s impossible to be precise),” Mr Oliver said.
This suggests around another 15 per cent fall in Sydney and more in
Melbourne, he said, adding that a 25 per cent top to bottom drop would
take prices back to where they were in late 2014/early 2015.
While a 25 per cent drop in property prices may seem like a ‘crash’ to some, it comes after a significant period of growth; over the five years to 2017, Sydney prices rise soared 72 per cent and Melbourne prices increased 56 per cent.
“A 25 per cent plunge in Sydney and Melbourne may seem like a crash
but given the extent of the prior gains, it’s arguably not. But a 25 per
cent national average fall would probably be interpreted as a crash,”
he said.
“Our assessment is that this is unlikely unless we see much higher
interest rates or unemployment (neither of which are expected) driving a
sharp rise in defaults and forced property sales or a collapse in
immigration (which would collapse demand).
“Strong population growth is still driving strong underlying demand
for housing. While mortgage stress is a risk, it tends to be overstated,
and is unlikely to be a generalised issue unless interest rates or
unemployment shoot higher. And, while Sydney and Melbourne are at risk,
other cities have not seen the same boom and so are unlikely to crash.”
The latest Domain Q4 House Price Report, released on
Wednesday (23 January), revealed that Sydney house prices fell 3.2 per
cent over the quarter and 9.9 per cent over the year to $1,062,619. Unit
prices fell 3.3 per cent over the quarter and 5.8 per cent over the
year to $702,012.
“The depth of Sydney’s current house price downturn is the sharpest
in more than two decades, although the duration is yet to surpass the
2004-06 slump,” Domain Senior Research Analyst Dr Nicola Powell said.
“House prices have fallen 11.4 per cent from the mid-2017 peak,
pushing them back to mid-2016 levels. For the second time since Domain
records began in 1993 house prices have fallen for four consecutive
quarters, the only other period this occurred was in 2008.
“Despite the consistent quarterly moderations, the depth of the falls
have not gained significant momentum. The pullback in price was
anticipated given the stellar run of growth that lasted almost six
years. Home owners reaped an unprecedented gain of 89 per cent over this
period.”
New research released this week from NAB revealed how consumers are
weighing up the new opportunities or threats that the current housing
downturn presents. It found that half of Aussies think it is not a good
time to sell their home or investment property.
This view was broadly consistent across states, although a much
higher number in Western Australia said it wasn’t a good time to sell
their home.
“We suspect this is influenced by the fact that some home owners in
WA may also be sitting on capital losses,” NAB chief economist Alan
Oster said.
Over the next 12 months Australians are still most positive about
renovating their home and buying a property to live in. But it’s also
clear consumers are far more uncertain about the future – around 4 in 10
said they simply didn’t know if it would be a good time to buy, sell,
renovate or take out a mortgage.
On average, consumers expect price falls of -2.1 per cent over the
next 12 months (against -2.4 per cent forecast by property professionals
in NAB’s latest Residential Property Survey).
NSW (-3.1 per cent) and Victoria (-2.9 per cent) are expected to lead
the way down, but consumers again are a little less pessimistic than
property professionals.
NAB today lifted its back book mortgage rates by up to 16 basis points, which marks the end of its initiative to hold rates lower.
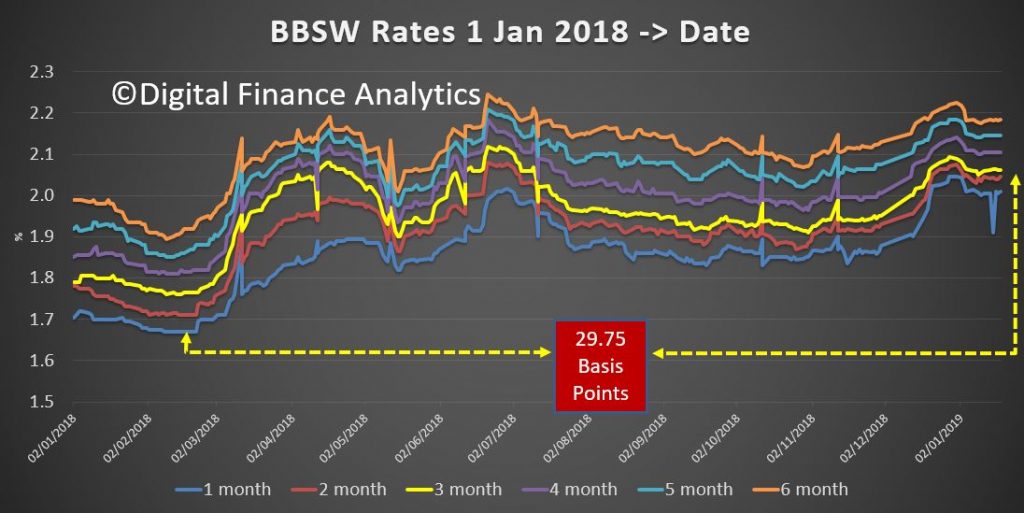
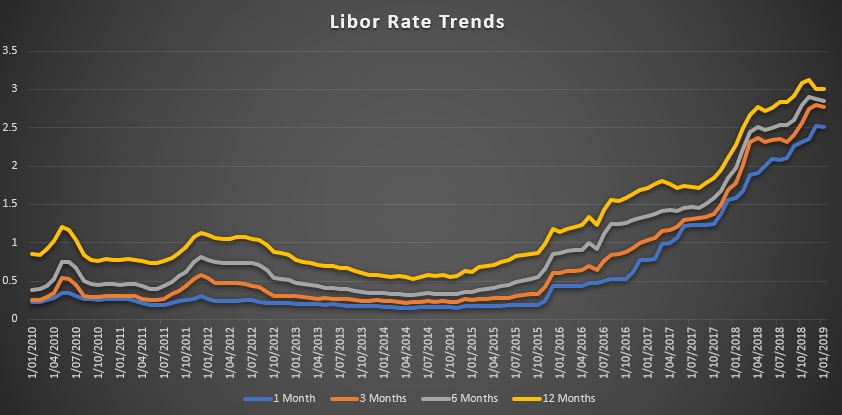
As we have been saying for some time margin pressure is building, as illustrated by the BBSW
… and LIBOR rates
We expect more rises across the lending community, which will put more pressure on mortgage stress, which today stands at above one million households according to our surveys.
NABs chief customer officer Mike Baird said that the bank could no longer afford to absorb higher funding costs.
NAB lifted rates on existing principal and interest loans for owner occupiers by 12 bps to 5.36 per cent and interest-only loans for owner occupiers by 16 bps to 5.93 per cent.
The bank raised rates for
principal and interest loans for investors by 16 bps to 5.96 per cent
and for interest-only investors by 16 bps to 6.41 per cent.
NAB said its decision to keep variable rates on hold had saved 930,000 households around $70 million. The bank said it had raised rates for principal and interest loans by a smaller amount in order to encourage home owners to pay down their home loans sooner. Nice, but meaningless touch!
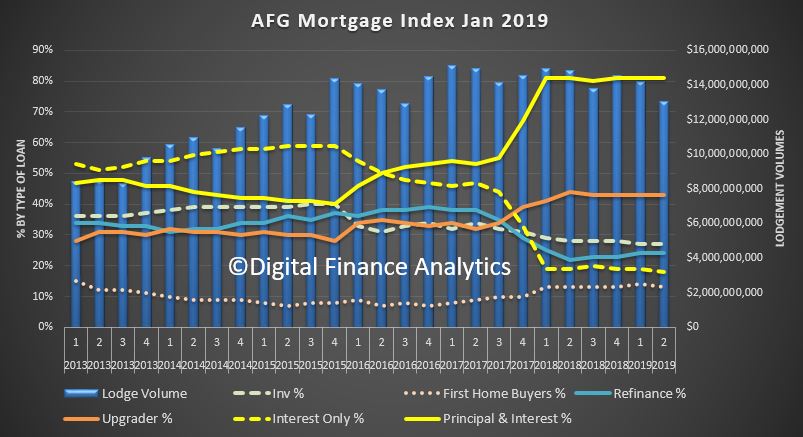
AFG reported an 8% fall in loan applications compared with the prior quarter, according to their quarterly index, released today. Whilst it only represents the activity though AFG, it is a useful bellwether.
The trajectory of the market is clear, as the volume of investor loans and interest only loans remain significantly lower than before the regulatory intervention. More households are choosing to fix their loan interest rate. NAB lifted their rates today!
AFG used the release as an opportunity to reinforce the role of mortgage brokers (remembering the Royal Commission, out soon, will likely opine on broker commissions).
They said:
Australia’s home loan market is enjoying record levels of competition driven by mortgage brokers, with new lending data released today revealing the market share of non-bank lenders is higher than ever.
And latest industry figures reveal consumers are increasingly relying on mortgage brokers for help, with three out of every five mortgages in Australia now generated through mortgage brokers.
As the financial services sector prepares for next month’s release of the Financial Services Royal Commission’s final report, the AFG quarterly Mortgage Index confirmed the crucial role played by mortgage brokers in creating a competitive home loan market.
It also provides a timely warning to policymakers of the importance of ensuring the availability of credit and consumer choice do not become sacrificial lambs in the regulatory response to the Royal Commission recommendations.
AFG lodged $13 billion in home lending applications for the final quarter of 2018, down 8% on the prior quarter.
Credit tightening is having an impact on volumes in every state – however, the Sydney and Melbourne property markets have been the most significantly impacted.
“Customers must be kept first and foremost in any discussion of changes to the financial sector,” said AFG Chief
Executive Officer David Bailey. “Although overall volumes are down our brokers still lodged over 25,000 applications for borrowers during the quarter. This is a fraction of the number of consumers they help with post-settlement and ongoing reviews and support.
“AFG now has more than 50 lenders on our panel and in clear evidence of the vital role mortgage brokers play in delivering a competitive home loan market, non-major lenders’ market share is at a record high of 42.1%.
“The non-majors are becoming an increasingly important part of the assistance brokers provide to customers. Penetration has increased across all categories of borrowers, with non-major market share gains recorded for Refinancers (now 46.8%), Upgraders (42%), First home buyers (32.1%) and Investors (43.4%).”
New Mortgage & Finance Association of Australia (MFAA) data shows mortgage broker market share has grown to 59.1%, reinforcing that consumers are increasingly turning to brokers for their expertise as the market becomes increasingly complex.
The record market share for mortgage brokers was the strongest evidence that consumers were more than satisfied with the customer service provided by brokers, Mr Bailey said.
“A spike in those choosing to fix their interest rates indicates borrowers are bracing for more bank-led rate rises, with quarterly volumes increasing from 19% to 23.1%.
“Notably, the major lenders’ market share of Interest Only and Investment lending has stabilised after APRA’s easing of caps.” January 24th 2019
The final report from the
financial services royal commission could be released later than
expected, after Treasurer Josh Frydenberg said government will “take
into account” its potential market impacts when determining when to
release it.
While Commissioner Hayne is
said to be “on track” to deliver the final report of the Royal
Commission into Misconduct in the Banking, Superannuation and Financial
Services Industry to the Governor-General by the agreed deadline of 1
February, there is still uncertainty as to whether the government will
release the final report next Friday.
Writing to the Treasurer, Chris Bowen MP said: “It
is in the national interest for the Australian people and victims of
banking scandals to be able to access the Hayne banking royal
commission’s final report and form their own views, at the earliest
opportunity, and that means on Friday, 1 February.
“I have written to the Treasurer
requesting the release of the final report and related documents of the
banking royal commission as soon as practicable after it is received by
the government.”
He continued: “The Liberal Party has
no excuses not to release the final report of the Hayne royal commission
when they receive it on 1 February.
“Josh Frydenberg released the royal commission’s interim report on the day they received it – and that was appropriate,” he noted.
“Refusing
to release the royal commission’s final report immediately would
unnecessarily politicise the handling of the report and give rise to
potential material market risks around leaks of all or part of the
report,” the Shadow Treasurer added.
The
Adviser asked the federal Treasurer when the final report from the
financial services royal commission would be publicly released.
In a statement, Mr Frydenberg said
that any public release of the report and its recommendations would
“take into account” its potential market ramifications.
Treasurer Josh Frydenberg said: “The
government looks forward to receiving Commissioner Hayne’s final report
by 1 February and considering its recommendations as we continue to
reform the financial sector.
“The government recognises the
potential market sensitivity of the final report and will take this into
account in considering the timing of its release.”
This could suggest that the
report may be released when the Australian Securities Exchange is
closed, for example, in order to protect the stock market.
If the report is released after
ASX trading hours, this would make the earliest release of the final
report approximately 4pm Sydney time on 1 February, if not later.
However, no particulars have been disclosed by government.
The federal Treasurer added: “One
wonders why Chris Bowen is so focused on the timing of the release of
the report given last time we released a major report, with the
Productivity Commission’s thousand page study into superannuation, he
effectively ruled out one of their key recommendations to reform the
default system 15 minutes after it was tabled and clearly before he had
even read it.”
Further, the Treasurer told an audience at The Sydney Institute on Tuesday (22 January) that the central tenet of the government’s eventual response to the final report would be “restoring trust in the financial system by delivering better consumer outcomes”.
He continued: “This
requires a culture of compliance and accountability, regulators that
are fit for purpose and an acknowledgement by the sector that people
must be put before profits. All of this must be achieved without
inadvertently strengthening the position of incumbents or unduly
restricting the flow of credit or other vital financial services that
Australians need and the economy relies on.
“In his interim report, Commissioner Hayne makes the telling
observation that “much more often than not, the conduct now condemned
was contrary to the law”. He makes clear that while behaviour was poor,
misconduct when revealed was insufficiently punished or not punished at
all.
“This raises the issue as to whether new laws are required or whether
existing laws simply need to be better enforced. Simplification may be,
according to the commissioner, a better route rather than adding ‘an
extra layer of legal complexity to an already complex regulatory
regime’,” Mr Frydenberg concluded.
Australia’s customer owned banking institutions are being pressured to agree to an unfair pricing policy by Australia Post as it targets smaller institutions to pay excessive charges for access to Bank@Post, according to a COBA press release.
Despite Australia Post CEO Christine Holgate publicly ruling out applying a Community Representation Fee (CRF) to smaller banking institutions in front of a Senate Estimates Committee in October last year, customer owned banking institutions are being pressured to agree to colossal new fees.
Under Australia Post’s scheme, mutual banks and credit
unions will be forced to either pay a tremendously exorbitant CRF or their
customers will no longer be able to do their banking via Bank@Post.
The fees are so significant and disproportionate that in some cases they equate
to almost 80 per cent of annual profit. This is compared to approximately 0.2
per cent for the ‘Big Four’ banks.
Customer owned banking institutions were initially given a handful of weeks to
make a decision, however Australia Post has committed to a two-month extension.
The extension is a welcome concession after the ‘Big Four’ banks received nine
months to review and consider three different proposals.
Australia Post’s tactics are expected to primarily impact older Australians,
particularly in rural and regional areas. For one member, 70 per cent of its
customers that transacted via Bank@Post for the 2018 calendar year were 50
years of age or over. Of that group 66% were over 60 years of age.
CEO of the Customer Owned Banking Association Mike Lawrence said members were
willing to pay their fair share but shouldn’t be picking up the tab for the
‘Big Four’s’ branch closures.
“The way Australia Post has engaged with customer owned banking institutions is
certainly surprising from an organisation that the CEO claims is Australia’s
most trusted brand.
“Customer owned banking institutions are happy to pay their fair share for a
service, but should not be forced to cover costs created by the ‘Big Four’
banks.
“The major banks are responsible for the vast majority of branch closures, 85
per cent of Bank@Post transaction volumes and bank most of the small business
clients that rely on large cash floats.
“It should fall to them, not smaller banking institutions that primarily use
Bank@Post for retail consumers, to make up the cost short-fall.
“After failing to get all of the ‘Big Four’ to sign onto the new pricing model
Australia Post has put the pressure on smaller customer owned banking
institutions to cover fees that are being generated by the ‘Big Four’.”
Mr Lawrence said COBA members were urging the Government to intervene to
protect consumers in regional areas and maintain competition in the banking
sector.
“This behaviour will have an enormous impact on Australians in regional and
rural areas. If smaller institutions are forced to withdraw, customers will be
forced to travel long distances to do their banking, or where that isn’t an
option, have to switch banks.
“If the Financial Services Royal Commission taught us anything, its that
customers need and deserve access to trusted banking alternatives.
“We’re hoping the Government can use its shareholding in Australia Post to stop
the postal service from eroding competition in the banking sector.
“It’s clear that Australia Post has forgotten its role is to meet the needs of
Australian communities. Hopefully the Government can remind it of its purpose.”
Customers of customer owned banking institutions
have been urged to write to Australia Post CEO Christine Holgate and
Communications Minister Mitch Fifield to demand a fairer pricing system by
visiting: fairbankingaustralia.com.au