The latest minutes from the RBA continues the steady-as-we-go story, once again and so the cash rate remains on hold.
At its meeting today, the Board decided to leave the cash rate unchanged at 1.50 per cent.
The global economic expansion is continuing. A number of advanced economies are growing at an above-trend rate and unemployment rates are low. Growth in China has slowed a little, with the authorities easing policy while continuing to pay close attention to the risks in the financial sector. Globally, inflation remains low, although it has increased due to both higher oil prices and some lift in wages growth. A further pick-up in inflation is expected given the tight labour markets and, in the United States, the sizeable fiscal stimulus. One ongoing uncertainty regarding the global outlook stems from the direction of international trade policy in the United States.
Financial conditions in the advanced economies remain expansionary but have tightened somewhat recently. Equity prices have declined and yields on government bonds in some economies have increased, although they remain low. There has also been a broad-based appreciation of the US dollar this year. In Australia, money-market interest rates have declined recently, after increasing earlier in the year. Standard variable mortgage rates are a little higher than a few months ago and the rates charged to new borrowers for housing are generally lower than for outstanding loans.
The Australian economy is performing well. Over the past year, GDP increased by 3.4 per cent and the unemployment rate declined to 5 per cent, the lowest in six years. The forecasts for economic growth in 2018 and 2019 have been revised up a little. The central scenario is for GDP growth to average around 3½ per cent over these two years, before slowing in 2020 due to slower growth in exports of resources. Business conditions are positive and non-mining business investment is expected to increase. Higher levels of public infrastructure investment are also supporting the economy, as is growth in resource exports. One continuing source of uncertainty is the outlook for household consumption. Growth in household income remains low, debt levels are high and some asset prices have declined. The drought has led to difficult conditions in parts of the farm sector.
Australia’s terms of trade have increased over the past couple of years and have been stronger than earlier expected. This has helped boost national income. While the terms of trade are expected to decline over time, they are likely to stay at a relatively high level. The Australian dollar remains within the range that it has been in over the past two years on a trade-weighted basis, although it is currently in the lower part of that range.
The outlook for the labour market remains positive. With the economy growing above trend, a further reduction in the unemployment rate is expected to around 4¾ per cent in 2020. The vacancy rate is high and there are reports of skills shortages in some areas. Wages growth remains low, although it has picked up a little. The improvement in the economy should see some further lift in wages growth over time, although this is still expected to be a gradual process.
Inflation remains low and stable. Over the past year, CPI inflation was 1.9 per cent and, in underlying terms, inflation was 1¾ per cent. These outcomes were in line with the Bank’s expectations and were influenced by declines in some administered prices due to changes in government policies. Inflation is expected to pick up over the next couple of years, with the pick-up likely to be gradual. The central scenario is for inflation to be 2¼ per cent in 2019 and a bit higher in the following year.
Conditions in the Sydney and Melbourne housing markets have continued to ease and nationwide measures of rent inflation remain low. Growth in credit extended to owner-occupiers has eased but remains robust, while demand by investors has slowed noticeably as the dynamics of the housing market have changed. Credit conditions are tighter than they have been for some time, although mortgage rates remain low and there is strong competition for borrowers of high credit quality.
The low level of interest rates is continuing to support the Australian economy. Further progress in reducing unemployment and having inflation return to target is expected, although this progress is likely to be gradual. Taking account of the available information, the Board judged that holding the stance of monetary policy unchanged at this meeting would be consistent with sustainable growth in the economy and achieving the inflation target over time.
PEXA, Australia’s online property exchange, which assists members such as lawyer, conveyancers and financial institutions to lodge documents with Land Registries and complete financial settlements electronically, has been acquired by via a joint bid from Link Administration Holdings Limited, Morgan Stanley Infrastructure Partners and Commonwealth Bank (who is already a key stakeholder in the venture).
States across Australia have been moving across to the platform as the country aims for loans to become 100% digital.
CBA chief executive officer Matt Comyn said, “Having been a key stakeholder in PEXA since its inception in 2011, today’s announcement represents our continued commitment to support the property industry as it transitions towards an innovative, fully digital, settlements process that aims to provide improved experiences for customers.”
CBA also said the transaction aligns with its strategy to focus on its core banking businesses and to create a simpler, better bank for our customers. As part of the transaction, which is subject to a number of conditions precedent, CBA will invest a further $50 million, totalling approximately $100 million invested in PEXA to date. This will result in an increase in our ownership stake from 13.1% to approximately 16%.
No one seems to have noticed that one of the largest mortgage lenders is now also has a significant interest in the property settlement and transfer system – what could possibly go wrong?
Moody’s says that relaxed regulatory oversight for the largest US regional banks would be credit negative.
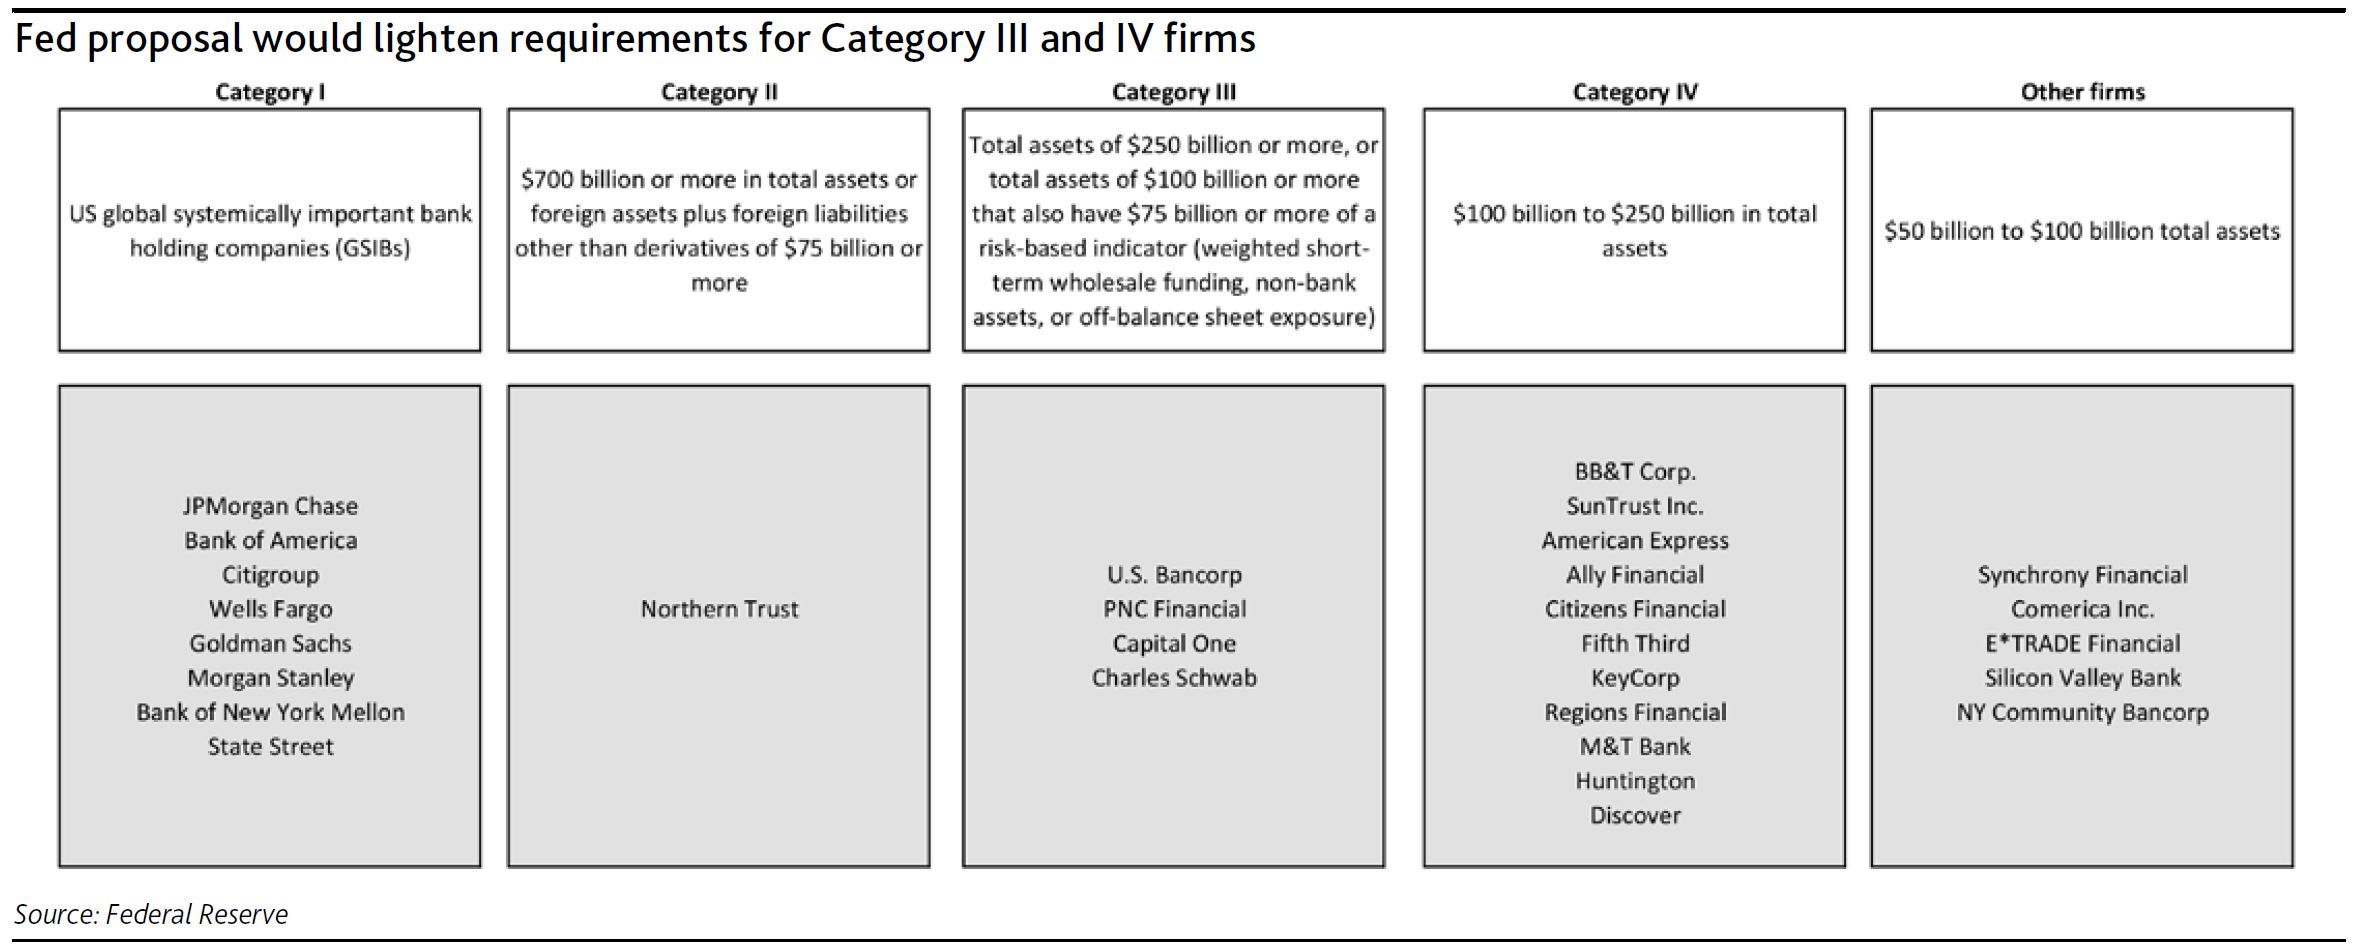
On 31 October, the US Federal Reserve (Fed) proposed revisions to the prudential standards for the supervision of large US bank holding companies to implement the Economic Growth, Regulatory Relief, and Consumer Protection Act (the Act) that became law in May of this year. The proposal would apply less rigorous capital and liquidity standards to most large regional bank holding companies with less than $700 billion of consolidated assets or less than $75 billion of cross-jurisdictional activity, a credit-negative.
In particular, the Fed proposals would relax current supervisory requirements for banks with assets of more than $250 billion, which goes beyond the Act’s primary focus on banks below that threshold. However, the proposal is still consistent with the Act’s emphasis on regulation that increases in stringency with a firm’s risk profile, defining four categories of banks as described and named in Exhibit 1 (other firms are no longer subject to the Fed’s enhanced prudential standards under the Act).
The 11 firms in Category IV would be subject to significantly reduced regulatory requirements under the proposal, including public supervisory stress testing every two years instead of annually. These firms would also be permitted to exclude accumulated other comprehensive income (AOCI) from capital and would no longer be subject to the liquidity coverage ratio (LCR) or proposed net stable funding ratio (NFSR) rules. Internal liquidity stress-testing would be required quarterly rather than monthly.
The four firms in Category III would be subject to modestly reduced regulatory requirements under the proposal. They would no longer have to apply the advanced approaches (internal models-based) risk-based capital requirements but would remain subject to the standardized approach requirements. Like Category IV firms, they could elect to exclude AOCI from capital. However, they would still be subject to the annual public supervisory stress tests. Their LCR and NFSR requirements would be reduced to between 70% and 85% of full requirements.
The changes in capital and liquidity requirements for Category III and IV firms are likely to reduce their capital and liquidity buffers, a credit negative. Moreover, the reduced frequency of capital and liquidity stress testing could lead to more relaxed oversight and afford banks greater leeway in managing their capital and liquidity, as well as reduce transparency and comparability, since fewer firms will participate in the public supervisory stress test.
Category I and II firms would not see any changes to their capital or liquidity requirements. The proposals do not address the US operations of foreign banking organizations, but a proposal on their supervision will likely be forthcoming.
Westpac has released their 2018 full year results. They had already signalled customer remediation costs, and its impact on profitability, but their net interest margin was significantly lower in the second half, and 90+ mortgage delinquency continued to rise in Australia. Total provisions were lower. Capital ratio though are in good shape. The proportion of IO loans is falling, and they expect more home price easing.
CEO Harzter said ““We expect house prices to cool further, and investor demand to remain weak. On the other hand, demand from first home buyers is holding up. These dynamics are likely to lead to housing credit growth easing to 4% next year, with total credit growth of 3.5%. With around 70% of Australian customers ahead on their repayments and delinquencies low, credit risks in the housing market currently remain low”.
However, their disclosed stress tests suggest in a severe downturn cumulative total losses could be $3.9bn over three years.
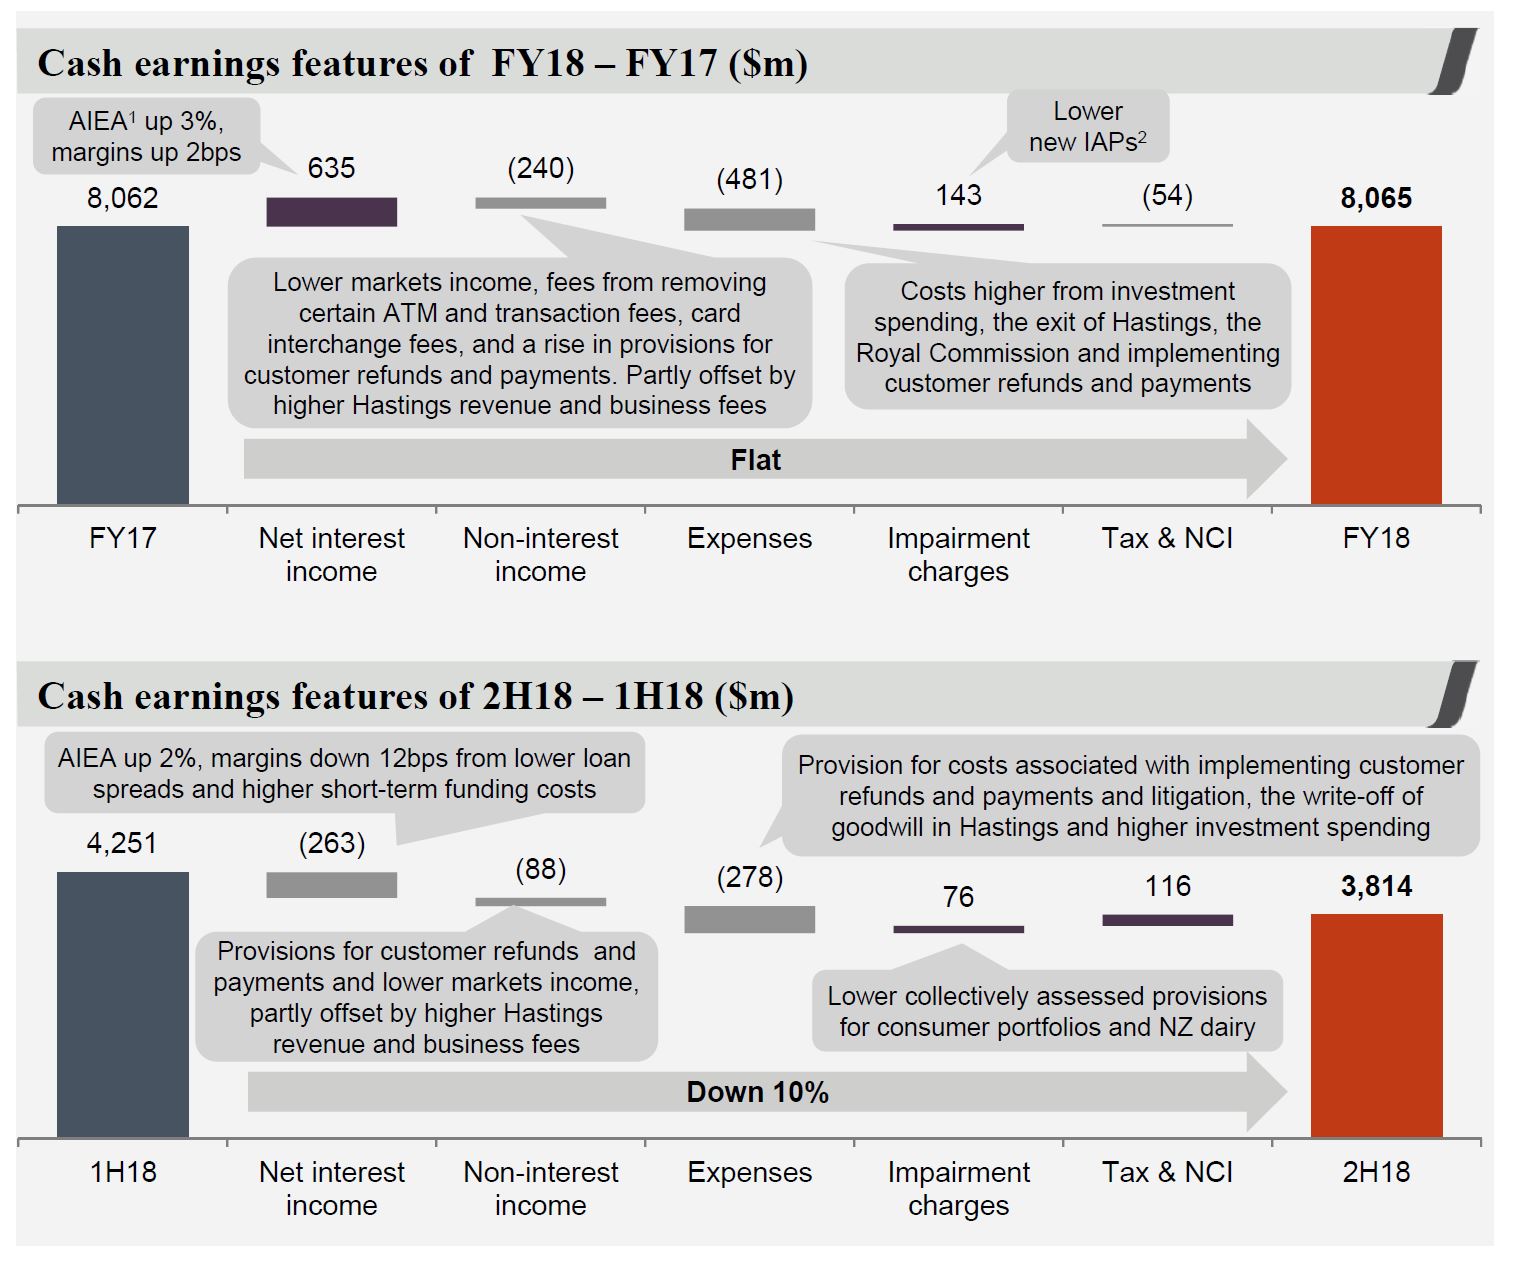
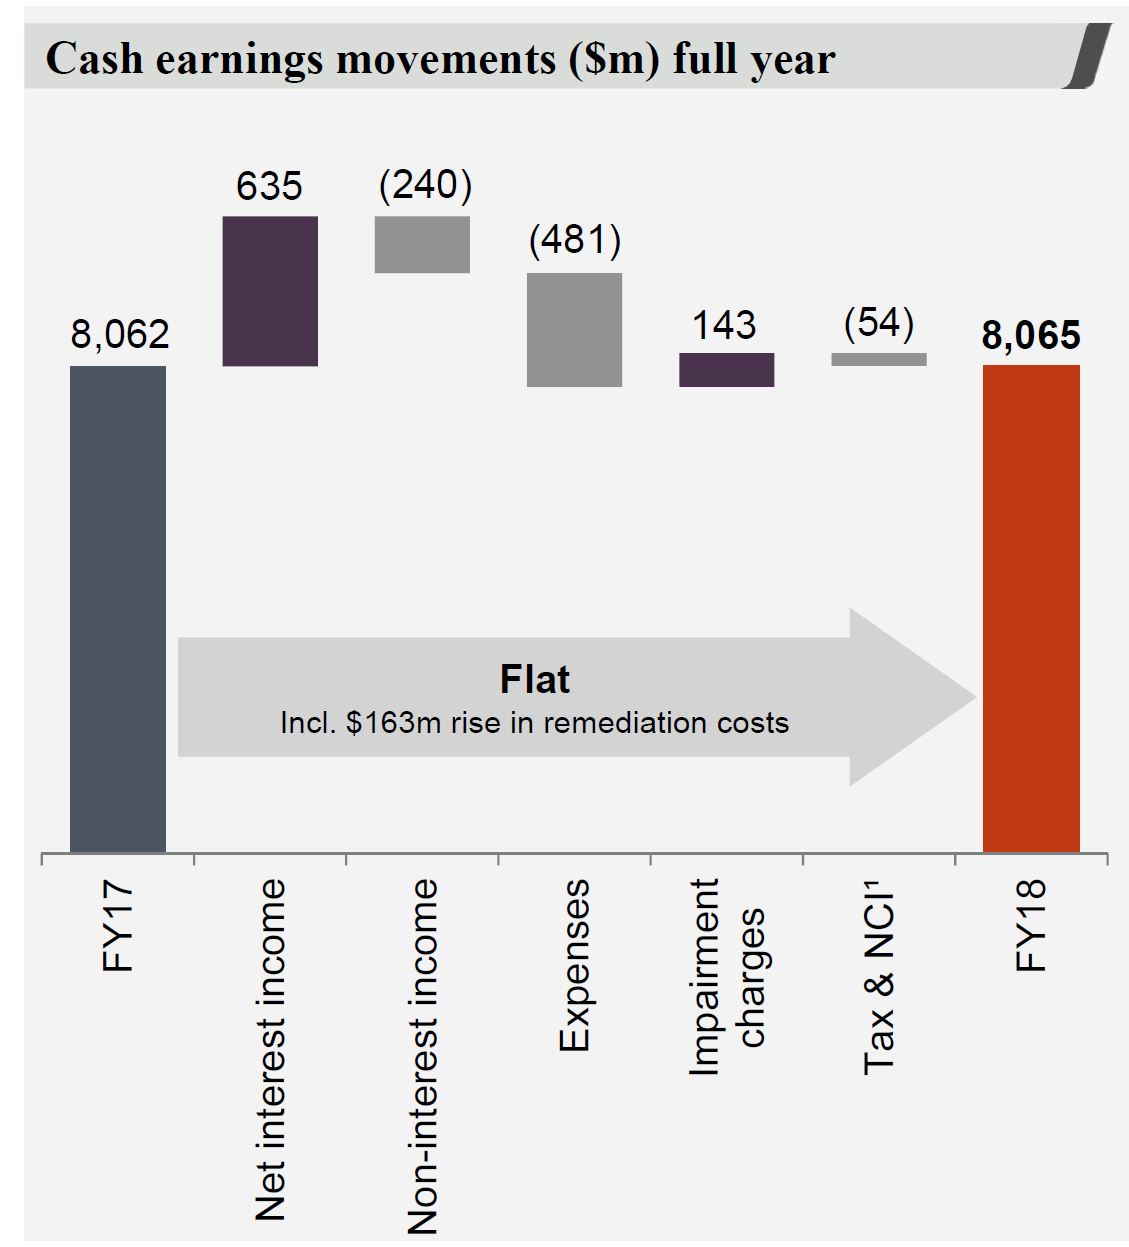
Cash earnings were $8,065 million, little changed on last year. Cash earnings per share, 236.2 cents, down 1% and the cash return on equity (ROE) was 13.0%, at the lower end of the range Westpac is seeking to achieve. The final, fully franked dividend was unchanged, of 94 cents per share (cps), so the full year, fully franked dividend of 188 cps. Statutory net profit was $8,095 million, up 1%.
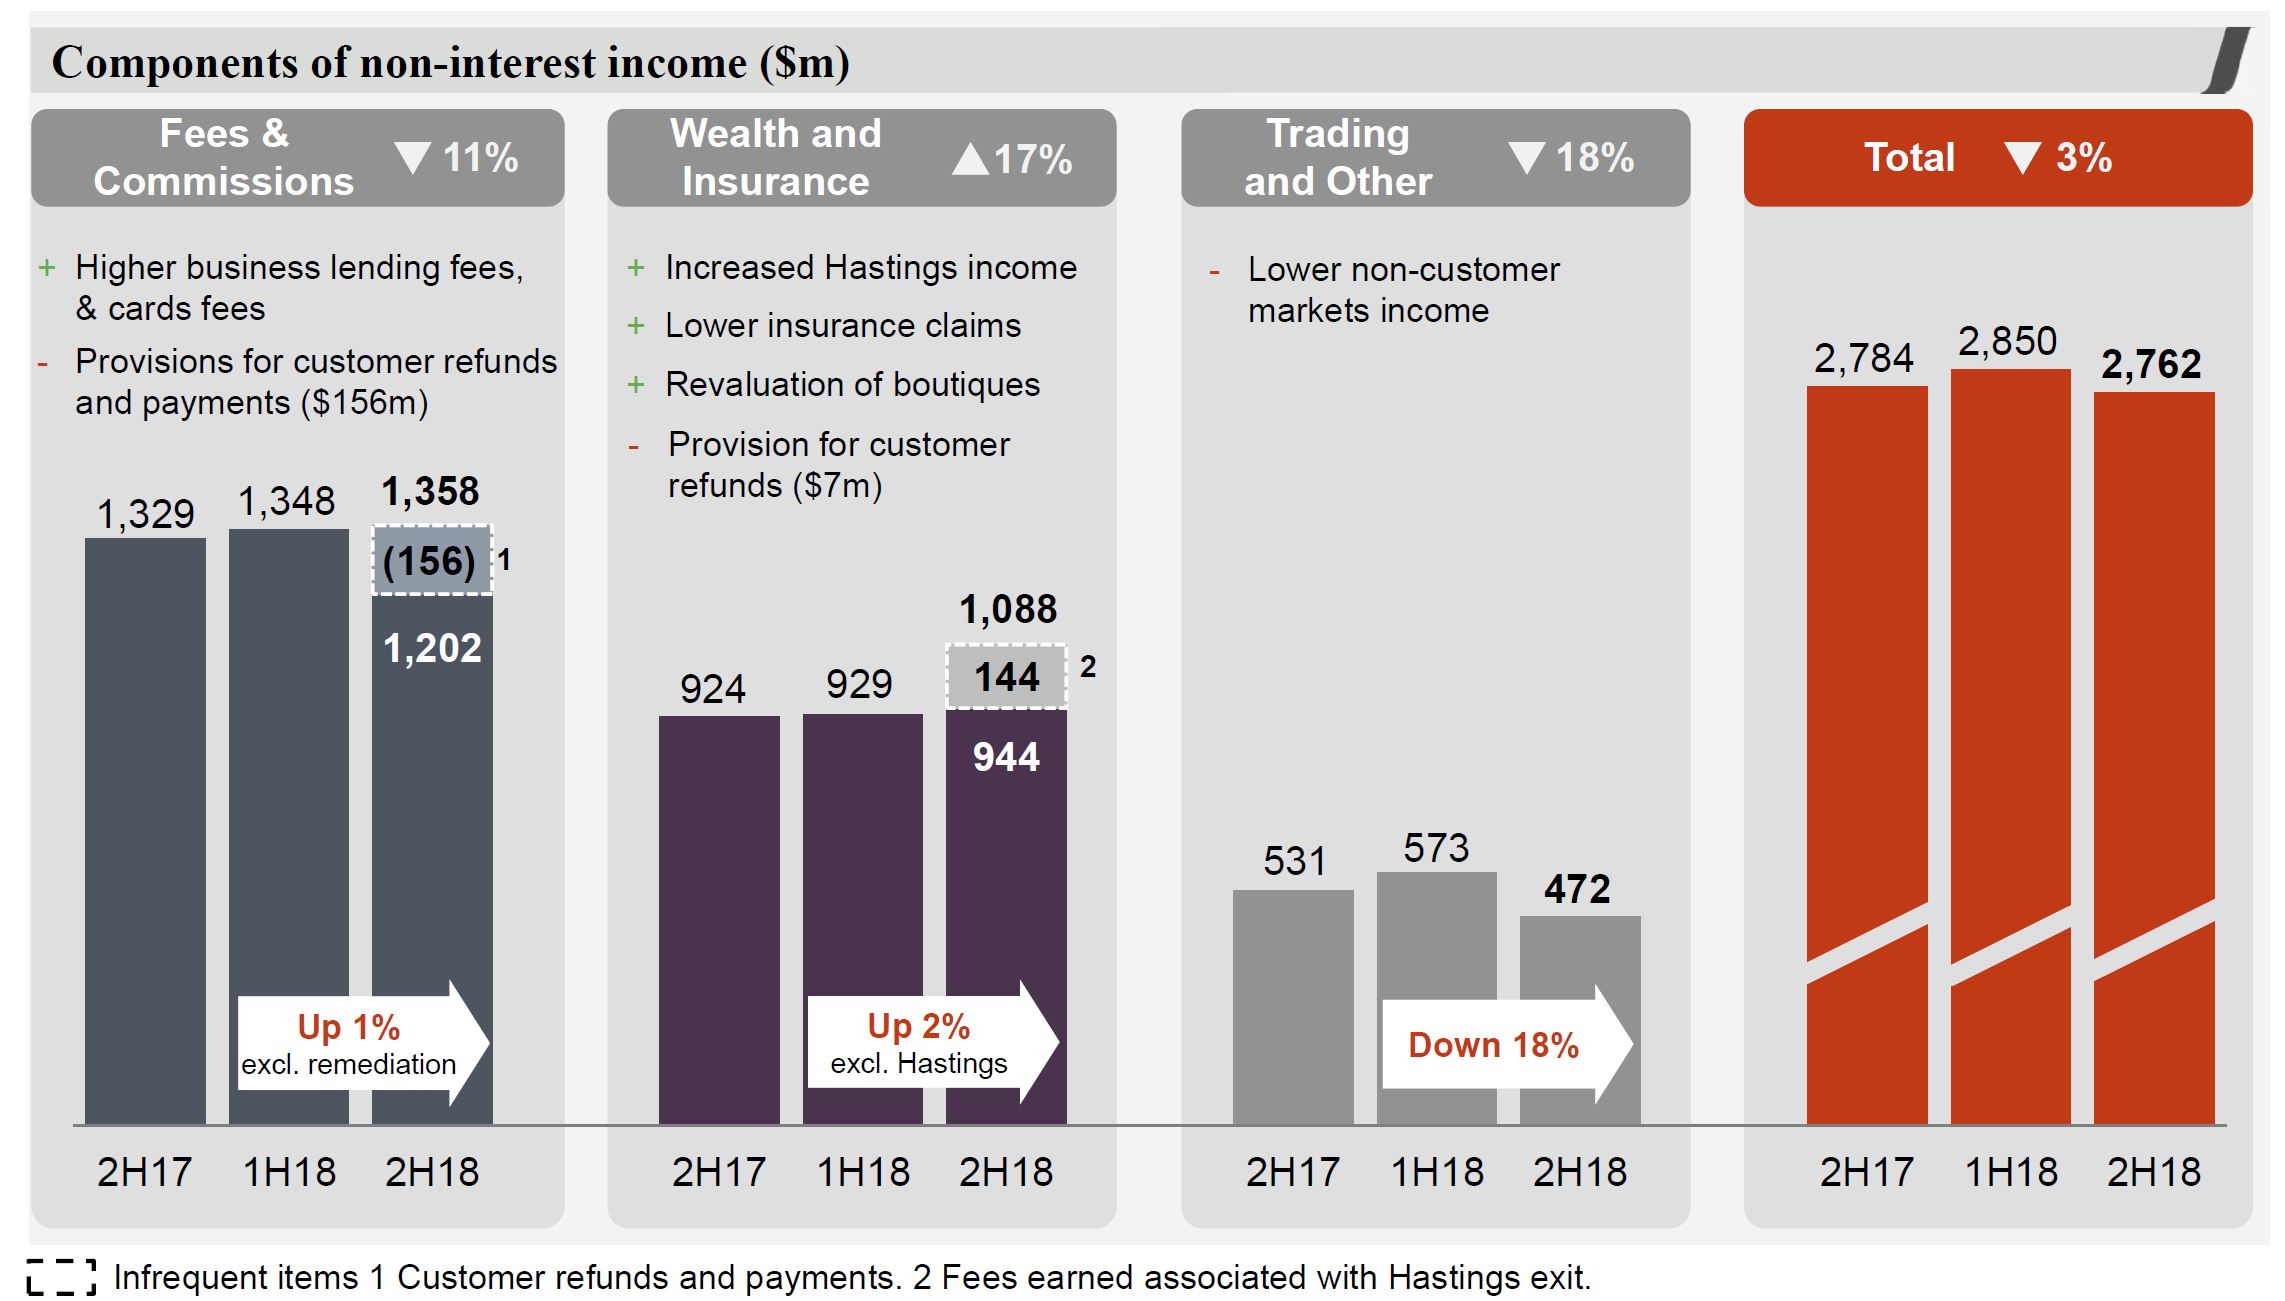
The cash earnings included $163 million in remediation charges, and a fall of $240 million in non-interest income, a a reduction in impairment charges.
There was a fall of $263 million in the second half in net interest income. and a 10% reduction in earnings, with remediation costs of $430 million.
Income was down 3% over the half, thanks to margin decline and customer remediation.
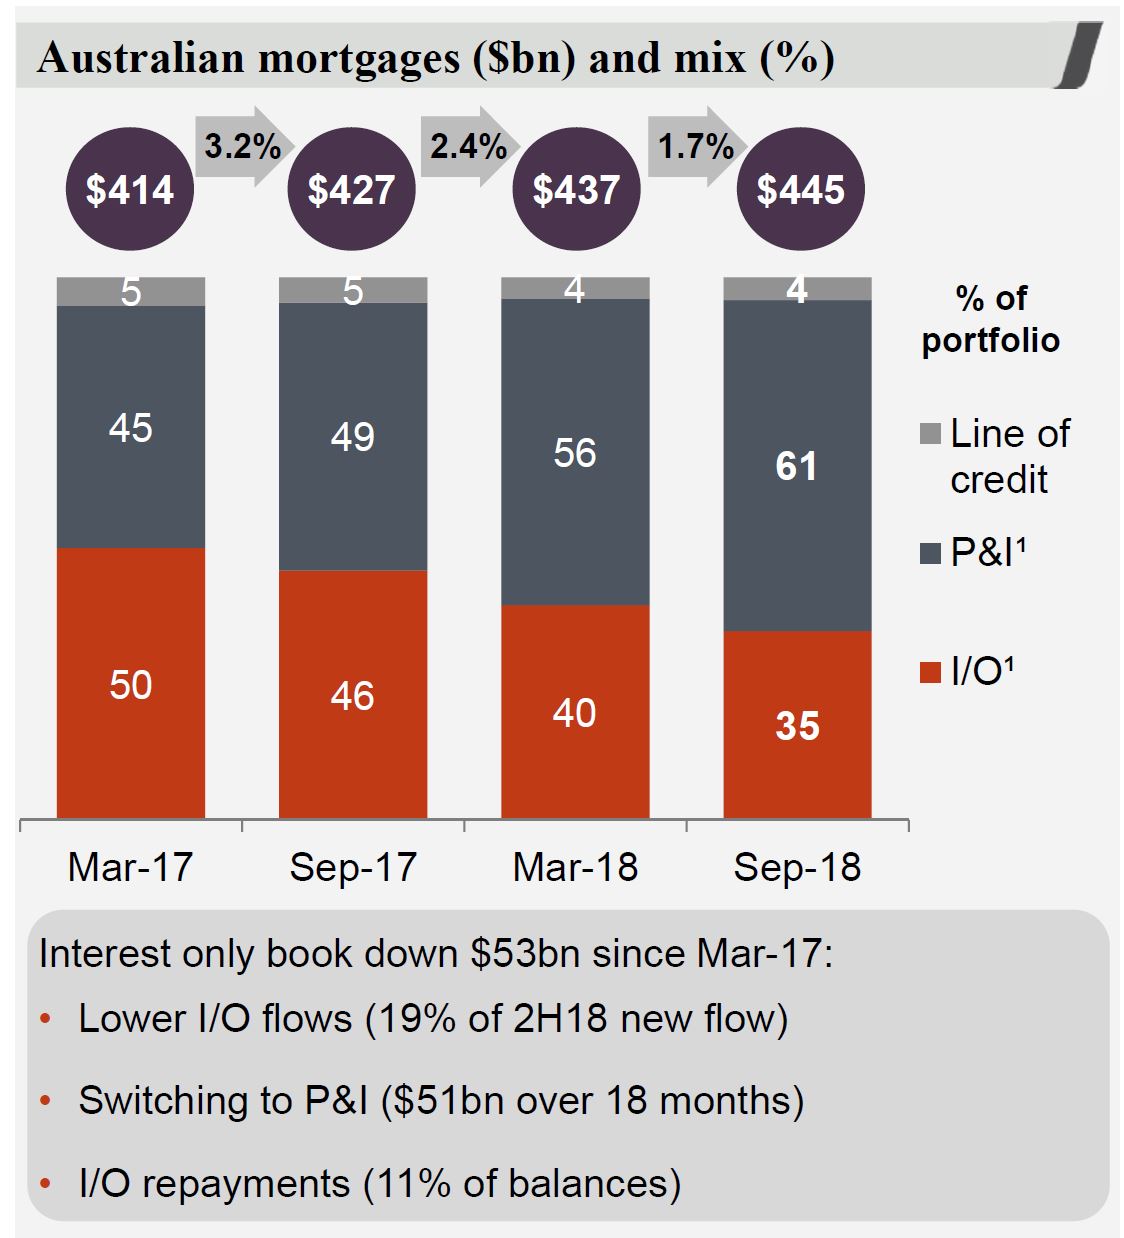
They highlight that Australian mortgage growth is moderating and interest only loans are down $53 billion since March 2017.
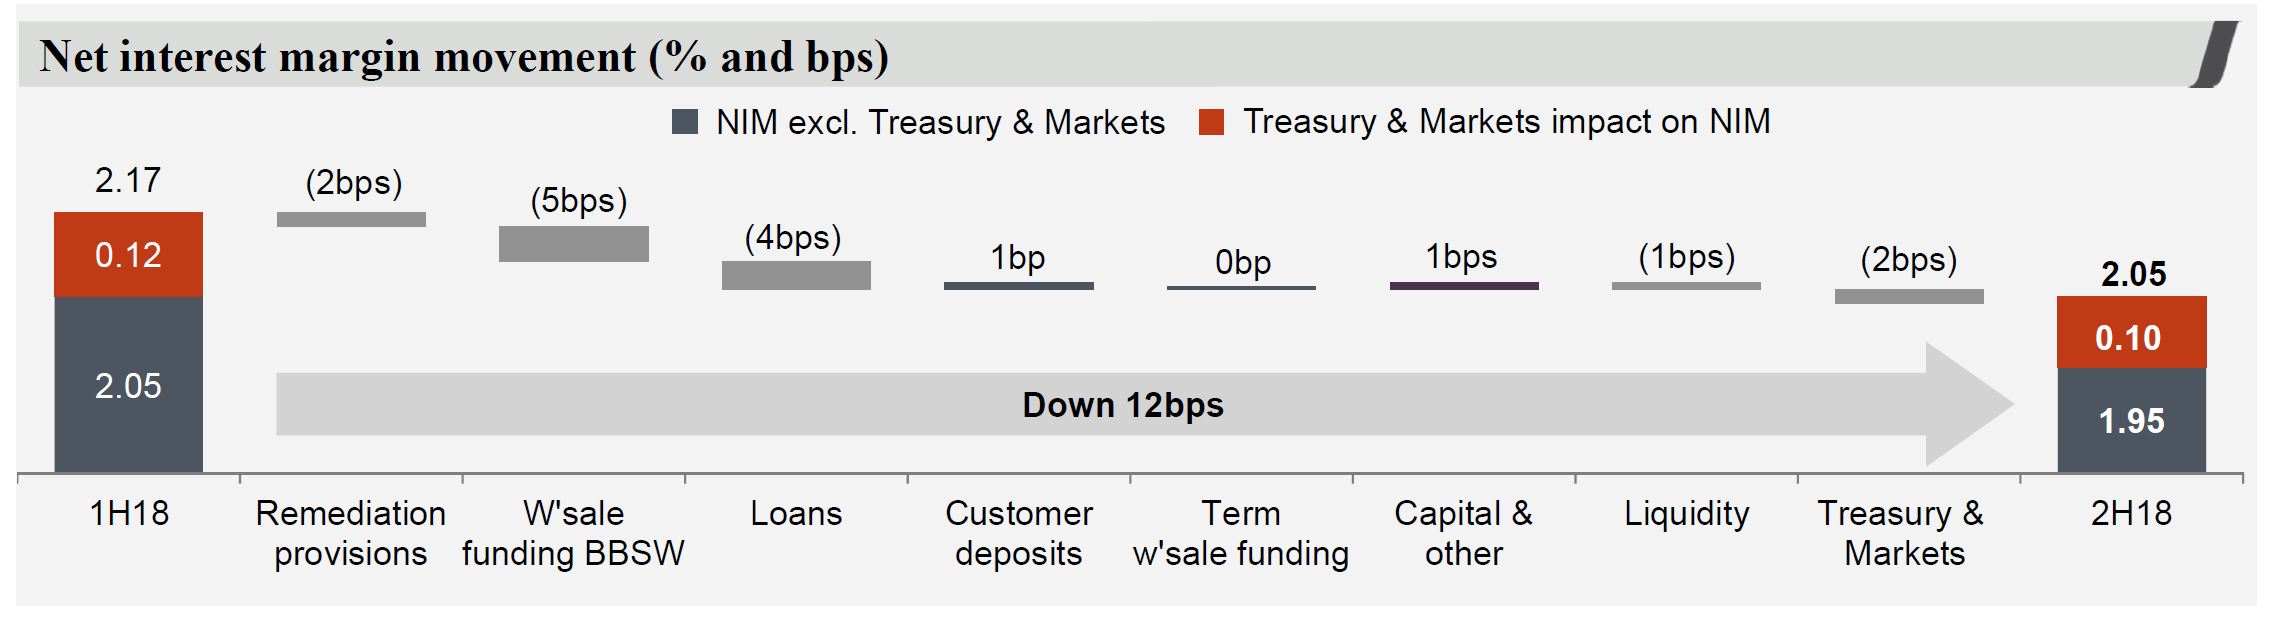
Margins in the second half were down from 2.05 to 1.95, or 10 basis points in the main banks, and from 0.12 to 0.10 in the Treasury and Markets. 5 basis points related to wholesale funding, and 4 basis points loans, offset by 1 basis point from deposits.
Non interest income fell and included provisions for customer refunds of $156 million and lower trading income, which was down 18% in the second half.
Expenses were higher thanks to regulation and compliance, remediation and platform investments.
FTE were down by around 700 from the first half.
Stressed assets as proportion of total committed exposure (TCE) was lower, despite a rise in 90 days+ past due. Australian 90 day + mortgage delinquencies rose from 69 to 72 basis points in the second half.
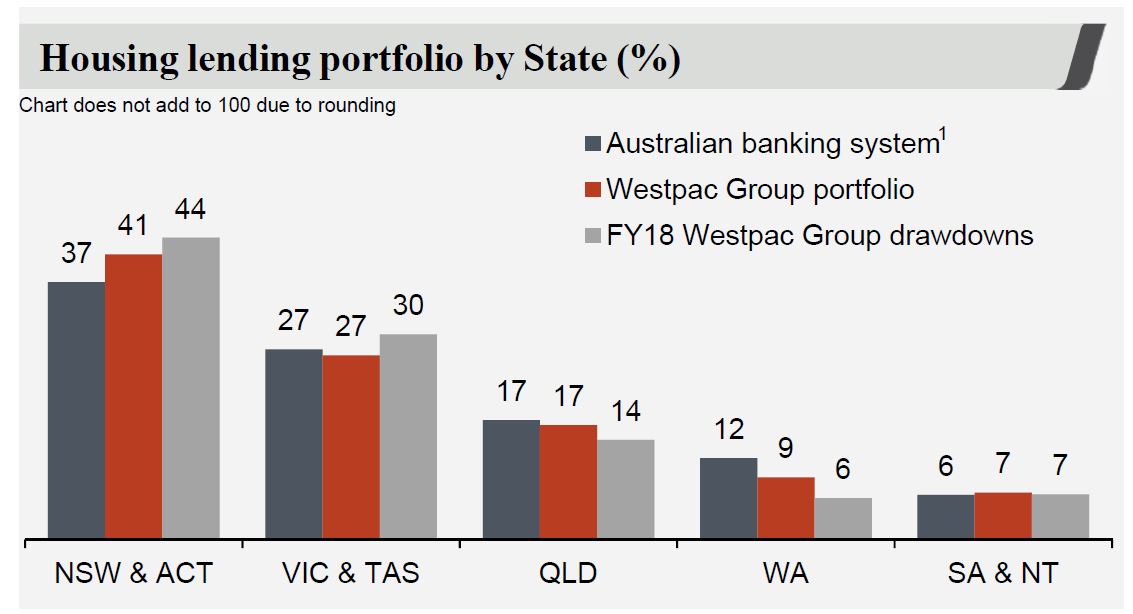
Westpac is writing more mortgage loans from NSW and VIC, relative to system and 51.6% of new flows came from propitiatory channels. 8.2% of new loans were from first time buyers. Borrowers applying for a mortgage must be able to service the higher of either: 7.25% minimum assessment rate; or product rate plus 2.25% buffer. Actual mortgage losses are 2 basis points.
The schedule of IO loan expiry reaches out over the next 10 years!
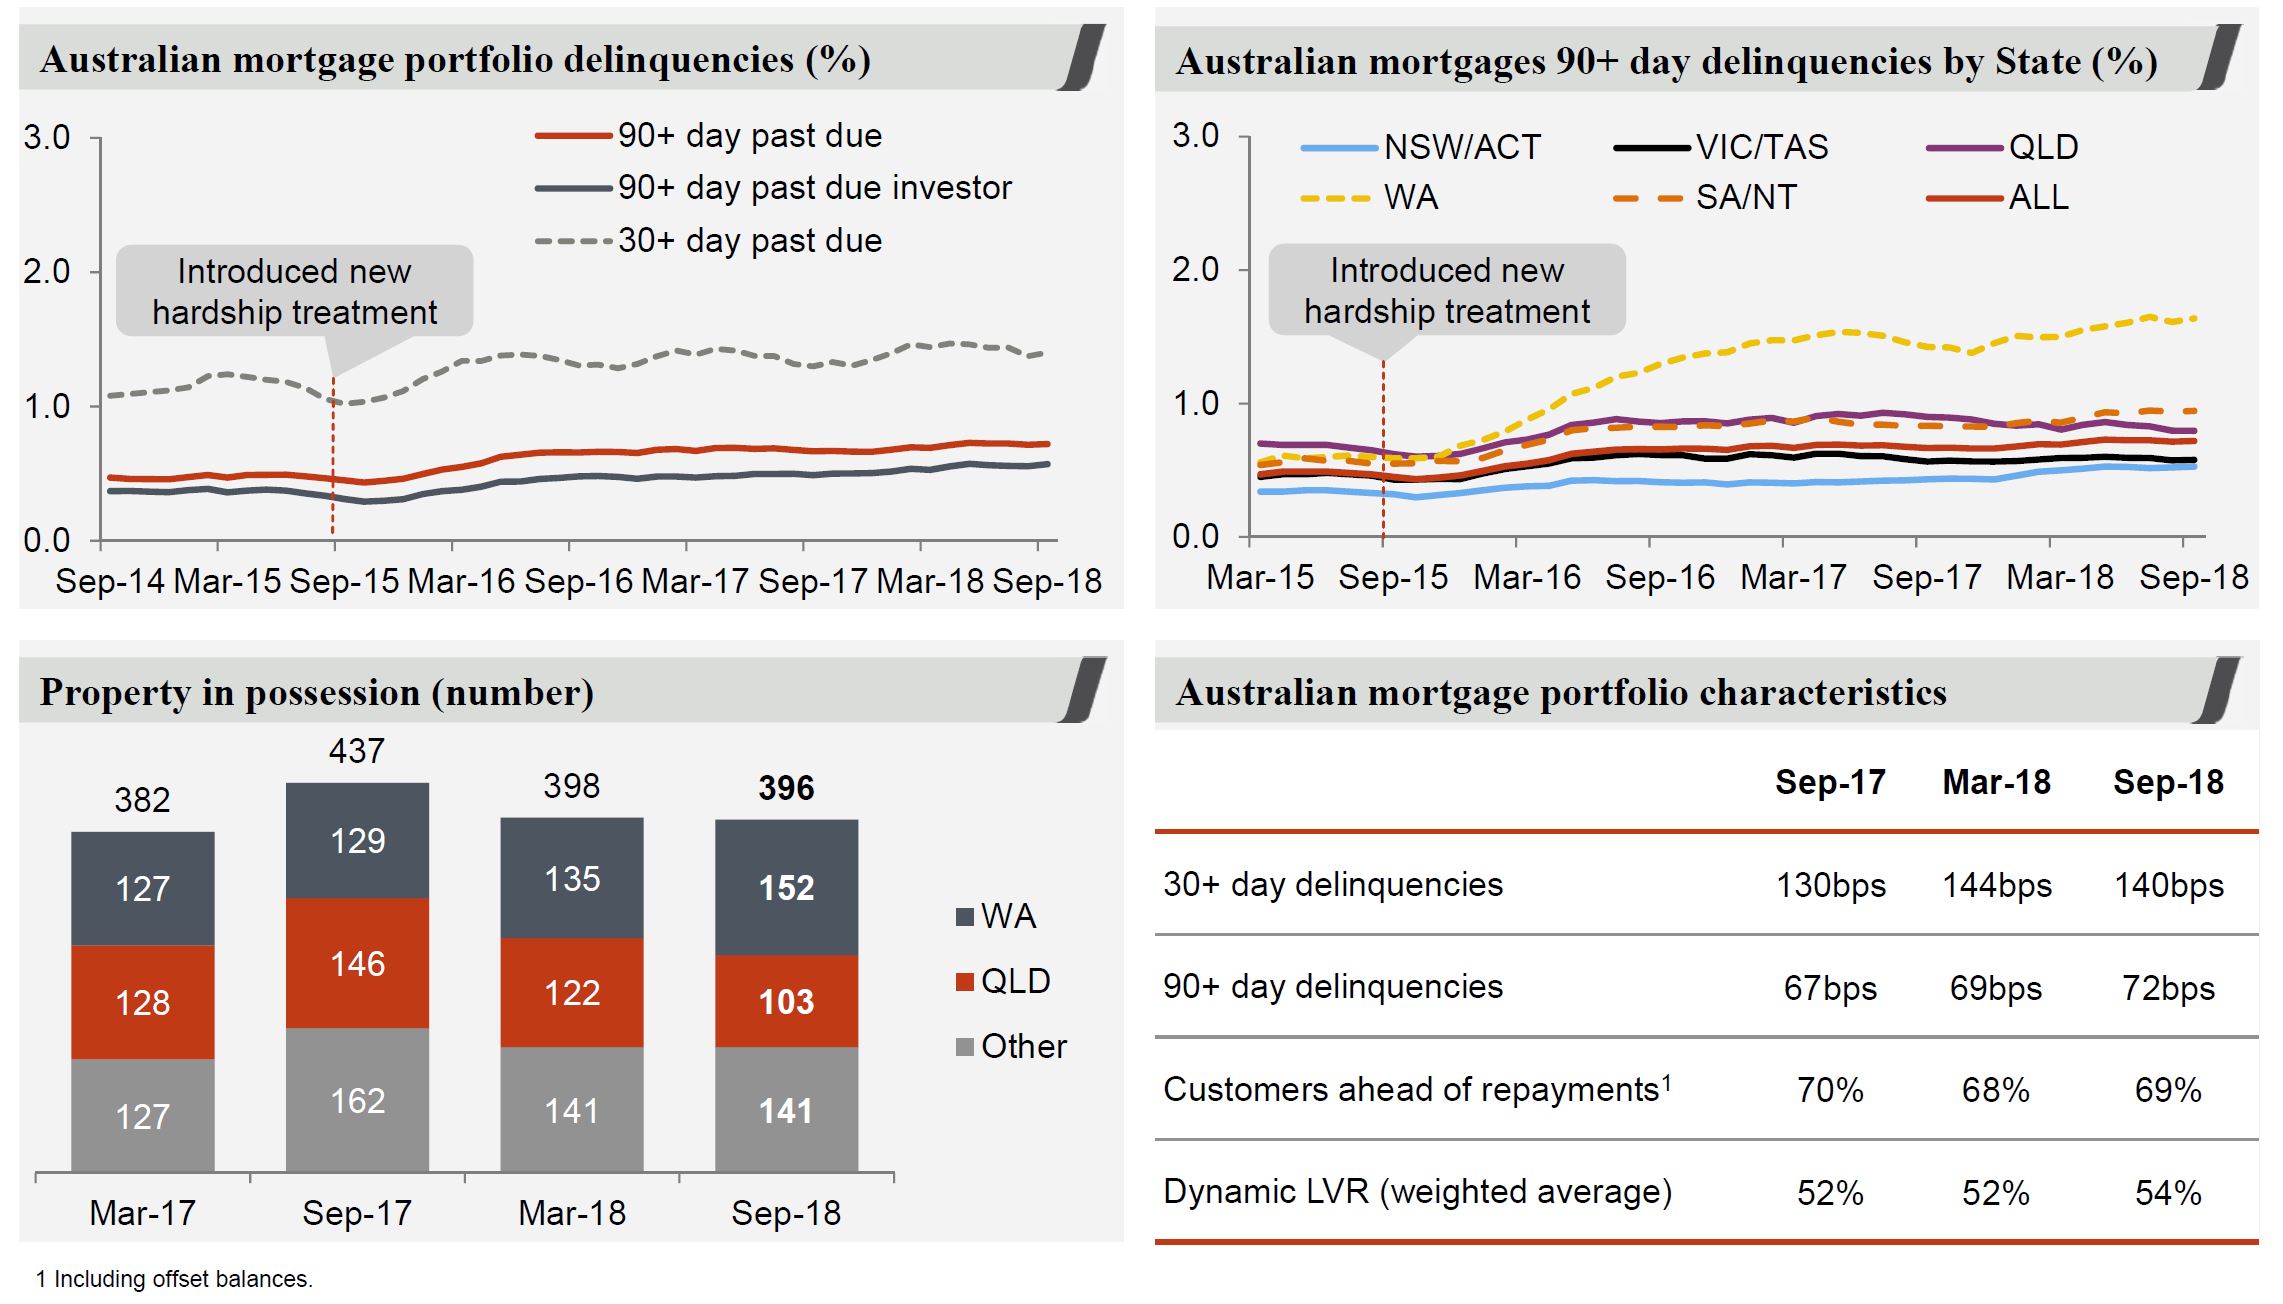
The Australian mortgage book shows a rise in delinquencies, a small fall in those paying ahead, and a rise in dynamic LVR (in response to falling prices). Dynamic LVR is the loan-to-value ratio taking into account the current loan balance, estimated changes in security value, offset account balances and other loan adjustments. WA and SA/NT are most exposed.
Westpac reported their mortgage stress tests which assumes a severe
recession in which significant reductions in consumer spending and business investment lead to six consecutive quarters of negative GDP growth. This results in a material increase in unemployment and nationwide falls in property and other asset prices. They say that estimated Australian housing portfolio losses under these stressed conditions are manageable and within the Group’s risk appetite and capital base.
Cumulative total losses of $3.9bn over three years for the uninsured portfolio (1H18: $3.5bn).
Cumulative claims on LMI, both WLMI and external insurers, of $911m over the three years (1H18: $911m).
Peak loss rate in year 2 has increased to 52bps (1H18: 48bps) due to recent
declines in house prices which leads to a higher dynamic LVR starting point for the portfolio. In addition, the unemployment rate for September of 5.0%
creates a bigger peak to trough change compared to 1H18.
WLMI separately conducts stress testing to test the sufficiency of its capital
position to cover mortgage claims arising from a stressed mortgage
environment.
Total impairments were down to $3,053 million (44% of impaired assets).
The CET1 ratio was 10.63%, up 13 basis points from March 2018.
We discuss the latest BIS report on “zombie firms” and their impact on productivity, banks and risks in the financial system.
The Bank for International Settlements recently released a new report “The rise of zombie firms: causes and consequences”. They define zombie firms, as firms that are unable to cover debt servicing costs from current profits over an extended period. They used firm-level data on listed firms in 14 advanced economies, to highlight a ratcheting-up in the prevalence of zombies since the late 1980s. They say this increase is linked to reduced financial pressure, which in turn seems to reflect in part the effects of lower interest rates. But such zombies weigh on economic performance because they are less productive and because their presence lowers investment in and employment at more productive firms. And as interest rates rise, many will fail.
Welcome to the Property Imperative weekly to 3rd November 2018, our digest of the latest finance and property news with a distinctively Australian flavour.
Watch the video, listen to the podcast or read the transcript.
The latest data reinforces the downward momentum in property, and the blowback more broadly across the economy and the finance sector. Those arguing for just a small adjustment, before a spring bounce are sadly plain wrong. In fact, the falls are likely to accelerate from here
And by the way you value the content we produce please do consider joining our Patreon programme, where you can support our ability to continue to make great content.
The latest data shows that sales listings are surging in the Sydney region, with 27,265 showing on Domain, and even more if you include hidden listings. And in one day 230 additional new listings were added. This is being driven by more property investors seeking to exit, either because of the extra costs of switching from an interest only mortgage to a principal and interest mortgage, or simply to crystallise gains before they dissipate. This is consistent with our survey data on transaction intentions, which also shows that the number of prospective purchasers is falling. You can watch our post “Decoding Property Buying Intentions – “You Ain’t Seen Nothing Yet” where we discuss the results in more detail.
The auction results last week, which were delayed from some sources, but showed lower results, many withdrawn properties, and more properties where the final sale price was not disclosed, all signs of a distressed market.
CoreLogic says there were 2,928 capital city homes taken to auction last week, making it the fifth busiest week for auctions so far this year, but more than half of the homes taken to auction failed to sell giving a final auction clearance rate of 47 per cent; the fifth consecutive week where the combined capital cities have seen less than 50 per cent of homes sold. Last year, there were 3,713 homes taken to auction over the same week, when a much higher 64.5 per cent sold.
Melbourne’s final auction clearance rate came in higher week-on-week. The improved clearance rate last week was across the second highest volume of auctions seen across the city this year. There were 1,709 auctions held, returning a clearance rate of 48.6 per cent, having increased on the 45.7 per cent over the week prior when 1,087 auctions were held.
In Sydney, 798 auctions took place last week with 45.3 per cent successful, up from the 44.6 per cent over the week prior when fewer auctions were held (675). Although the clearance rate was higher over the week, it remained much lower than the 58.3 per cent of homes successful at auction over the same week last year when a significantly higher 1,215 auctions took place.
Across the smaller auction markets, Adelaide was the best performing in terms of clearance rate with 57.6 per cent of homes selling at auction last week, although this was lower than the previous week.
This week, there are fewer auctions scheduled to take place across the combined capital cities, with 1,438 currently being tracked by CoreLogic, which is half the volume of auctions recorded last week when the combined capital cities saw 2,928 homes taken to auction.
Across Melbourne, the number of auctions to be held is expected to fall this week, with only 234 Melbourne homes scheduled to go to auction. The lower volumes are likely due to the upcoming Melbourne Cup festivities and coming off the back of the second busiest week for auctions this year (1,709).
Activity across Sydney is set to remain relatively steady week-on-week, with 764 homes scheduled for auction this week, decreasing by 4.3 per cent on last week’s final figures which saw 798 auctions held across the city.
Across the smaller auction markets, activity across Adelaide and Brisbane is virtually unchanged week-on-week, while Canberra, Perth and Tasmania are all expected to see a higher volume of auctions this week.
The most recent price results for October from CoreLogic takes the annual decline across the national index to 3.5%, signalling the weakest macro-housing market conditions since February 2012, with their hedonic home value index reporting a 0.5% fall in dwelling values nationally in October.
On a rolling quarterly basis, dwelling values are now trending lower across both the combined capital city regions (-1.6%) as well as the combined regional areas of Australia (-0.7%).
The weakest conditions continue to be felt across Australia’s two largest cities where investment buyers have been the most concentrated, supply additions have been the highest and where housing affordability is the most stretched. Sydney values are down 7.4% over the past twelve months and Melbourne values are 4.7% lower over the same period. Values also declined in Perth and Darwin however, the downturn in these two cities has been ongoing since mid-2014, with values falling 3.3% and 2.9% respectively over the past twelve months. Although dwelling values are rising on an annual basis across the remaining cities, the pace of growth has eased. Of course the averages do not tell the true story, there are places where prices have fallen more than 22% in the past year, and CoreLogic revised their index a little, but the trends are clearly down. The funniest thing I saw this week were the property spruikers trying to argue the rate of fall was slowing. That is just not really true!
Also it is worth noting that the higher end of the market continues to fall further and faster. The disparity of performance between the upper and lower quartiles is clear at lower geographic aggregations as well. In Melbourne, the top 25% of the market by value has seen values fall by almost 9% over the past twelve months; a slightly weaker performance than Sydney’s upper quartile market where values are down by 8.6%. At the same time, more affordable housing markets have seen a 2.9% rise in values across Melbourne over the past year, while Sydney’s lower quartile has recorded a fall that is almost half that of the upper quartile.
Finally on property, economist John Adams and I debunked Nine’s The Block in our post “Adams/North: “Block Mania” Will Literally Kill Innocent Australians” We looked at why people cannot see the upcoming property correction and we got deep and dirty into philosophy, TV villains, cash for comment and the KGB. What could possibly go wrong? Is reality on the blink?
We had full year results from NAB and ANZ this past week. In NAB’s cash earnings were down 14%. They included restructuring costs of $530m and customer related remediation of $261m, leading to a cash earnings figure before these of $6,493m down 2.2% on FY17. Their net interest fell 4 basis points from 1.88% in 2017 to 1.84% in 2018. This included 2 basis point falls in lending margin, and liquidity/funding plus 2 basis points from markets, offset by clawing back margin from depositors of 2 basis points. NAB was down 0.55% on Friday to 25.21.
ANZ’s Cash Profit on a continuing basis was $6.49 billion, down 5%, or flat on a statutory profit basis. Their approach to simplify the business and reduce costs have bolstered their capital position, but also left them potentially more exposed to a mortgage and construction sector downturn. They included charges of $377 million after tax for refunds to customers and related remediation costs, plus accelerated amortisation expense of $206 million predominantly relating to its International business and a restructuring charge of $104 million, largely relating to the previously announced move of the Australia and Technology Divisions to agile ways of working. Their net interest margin was significantly lower, thanks to the change in business mix, funding and customer remediation charges. Shane Elliot their CEO said he expected mortgage credit growth would probably halve, to 2 to 3 per cent, in the coming years, and that credit growth from investor borrowers has already “ground to a halt”. “I wouldn’t be surprised if the house price correction had further to run …” He also made the point ANZ is still using HEM for some mortgage lending, but that borrowing power has reduced. The average household average on income of $110,000 three years ago could have borrowed $550,000 for a mortgage but “that same family today with exactly the same income – $110,000 – today could probably only borrow about $440,000,”. ANZ was down 1.24% on Friday to 25.53.
Westpac, which reports next week, also advised the market on Friday it had upped its provisions for customer payments by $46 million to $281 million and its exit of infrastructure funds management business Hastings Funds Management, with also have a negative impact. More putting out the trash! It ended at 26.50 on Friday down 0.64%.
They are all being hit by the slowing mortgage sector, one off costs for customer remediation and business restructuring. Selling off businesses may generate additional capital, but it also puts more reliance on the fading property sector. CBA was also down on Friday dropping 0.86% to 68.35. And remember the Royal Commission is still running.
In contrast, Macquarie who reported their 1H19 results this week rose 3.86% on Friday to 122.42. They announced a net profit after tax of $A1,310 million for the half-year ended 30 September 2018 up five per cent on the half-year ended 30 September 2017. The bank continues a strong run, benefiting from its international business portfolio. International income accounted for 67 per cent of the Group’s total income. The Capital Markets business performed strongly. Their Australian mortgage portfolio of $A36.1 billion increased 10 per cent on 31 March 2018, representing approximately two per cent of the Australian mortgage market. Their shares rose on the results, with analysts revising up future earnings, up 3.86% on the day to 122.42.
And we got data from Lenders Mortgage Insurer Genworth. Their 3Q18 earnings today with a statutory net profit after tax (NPAT) of $19.6 million and underlying NPAT of $20.4 million for the third quarter ended 30 September 2018 (3Q18). It is an important bellwether for the mortgage industry, and confirms recent softening. Whilst they have a strong capital position, their net investment returns were also down a little.
They said that the Delinquency Rate increased from 0.50% in 3Q17 to 0.55% in 3Q18. This was driven by two factors. Firstly, there was a decrease in policies in force. The second factor was the increase in delinquency rates year-on-year across all States (in particular Western Australia, New South Wales and to a lesser extent South Australia). In terms of number of delinquencies, Western Australia and New South Wales experienced the largest increase with Queensland and Victoria experiencing a decrease in number of delinquencies. Their shares were up 1.34% on Friday to 2.27, still near to recent lows.
The latest Credit Aggregates from the RBA to September 2018 continues to show an easing of credit growth. Total credit, across all categories rose seasonally adjusted by $14.41 billion or 0.5%, to $2.8 trillion. Within that owner occupied lending rose 0.5% or $5.5 billion to $1.19 trillion while investment lending rose 0.1% or $0.52 billion to $593 billion. Other personal lending was flat, and business lending rose 0.9% to $943 billion, up $8.4 billion.
The 12 month ended data shows how investor lending continues to slow, owner occupied lending growth is easing, and overall lending for housing growth is slowing to 5.2%. This is a problem for the banks in that to maintain profitability as assets grow, they need the rate of growth of housing loans to RISE not slow down. Even at these levels (with some growth) household debt will rise relative to loans, so again it highlights the fundamental problem we have in the system at the moment. Lending in the less regulated Non-bank sector still appears to be growing more strongly than ADI lending.
APRA released their monthly banking statistics for September 2018. This includes the total balances by ADI broken by investor and owner occupied lending. Total lending grew by 0.21% in the month to a total of $1.65 trillion, or 2.5% annualised. Within that lending for owner occupation rose by 0.36% to $1.09 trillion and investor loans fell 0.03% to $557.4 billion. Investment loans now comprise 33.72% or the portfolio. Looking at the individual major players, we see that only NAB grew their investment loan portfolio in the month, among the big four. Macquarie and Bendigo are lifting investor loans the most by value. ANZ dropped their balances the most.
The CPI number was weak, thanks to some one offs, below the RBA target for inflation. And the retail turnover for September was also pretty low, The ABS released their latest statistics today for September 2018. Households remain under pressure judging by the weak results. In trend terms, overall retail turnover grew by 0.2% in the month. Within the segments, Other Retailing rose 0.6%, Cafes, Restaurants and Take Away Food rose 0.5%, Food Retailing 0.2%, Clothing, Footwear and Personal services was flat, while Household Goods fell 0.2% and Department stores fell 0.1%.
Across the states, TAS rose 0.5%, QLD and VIC both rose 0.3%, NSW rose 0.2% along with SA, ACT was flat, WA fell 0.1% and NT fell 0.9%. Online retail turnover contributed 5.6 per cent to total retail turnover in original terms in September 2018, an unchanged result from August 2018. In September 2017 online retail turnover contributed 4.4 per cent to total retail.
The ASX 100 was up 0.13% on Friday to, 4,817, while the ASX Financials 200 was down 0.38% to 5,748. The Aussie recovered a little against the US Dollar during the week, but ended down 0.18% to 71.93. Given the prospect of the RBA cutting rather than lifting rates, we expect it to go lower. Hexavest, a $14.5 billion fund, said Australia’s dollar may drop to a nine-year low of 67 U.S. cents as the central bank is set to become even more dovish and lean more toward cutting interest rates. A number of other major central banks are trying to catch up with the Fed, “if the RBA’s not playing that same game, bad news near term is you get a weaker currency,”.
AMP is till languishing, as they tried to explain the sale of chunks of the business to the market. It ended at 2.69, up 1.89% on Friday. The problem is, the business is impossible to value at the moment, given the Royal Commission, remediation and management changes. Perhaps someone will make a cheeky bid eventually.
The Gold Spot Aussie Dollar was up 0.11% to 1,713 and the Aussie Bitcoin was up 0.34% to 8,758. Market volatility in Australia is still extended, with the local VIX ending the week at 15.86, down 4.44%.
Volatility also continued in overseas markets, with the US VIX still elevated at 19.51, and up 0.88% on Friday.
The US labour data, released on Friday provided another reason to confirm the FED will continue to hike rates, the unemployment rate was steady at 3.7% with 250,000 additional jobs added. And over the year, average hourly earnings have increased by 83 cents, or 3.1 percent.
The benchmark United States 10-Year yield traded around 3.22% while the United States 2-Year climbed to 2.92%, its highest level in a decade. The 3-month rate though slide just a little to 2.33. You can watch our post Interest Rates WILL Rise
Wall Street closed lower Friday as uncertainty on trade dominated direction after President Donald Trump’s upbeat comments on U.S.-China trade relations appeared to contradict earlier comments from his chief economic advisor. The Dow Jones Industrial Average fell about 0.43% to 25,271. The S&P 100 fell 0.74% to 1.211, while the Nasdaq Composite fell 1.04% to 7,357. The S&P 500 Financials was flat on Friday having recovered during the week, to stand at 438.
“President Xi and I have agreed to meet at the G20 summit,” Trump told reporters on Friday. Trump added that “a lot of progress” had been made toward reaching a deal that would be “very fair for everybody.”
Trump’s comments seemingly contradicted earlier remarks from White House economic advisor Larry Kudlow, who indicated little progress had been made with China, denying reports that the president had asked his Cabinet to put together a trade deal with the country.
Bloomberg reported earlier Friday that Trump had asked officials to prepare a draft for a U.S.-China trade deal.
Beyond trade, tech stocks wreaked havoc on the broader market, led by a slump in shares of Apple. Apple fell 6.63% after its above-forecast earnings and revenue was overshadowed by soft guidance and weaker-than-expected iPhone shipments in the last quarter, ending at 207.48. The S&P 500 technology sector fell about 2%.
Gold was down on Friday by 0.11% to 1,235, but was higher across the week, reflecting the risk on sentiment across the market. Crude Oil fell 1.3% to 62.87, as the Trump Administration seems to be achieving its tri-fold agenda of punishing Iran while balancing the world’s energy needs and keeping oil prices low. Crude markets posted their largest weekly loss since February.
Bitcoin was down a little, at 6,426, down 0.38%, and is still going sideways. According to Agustín Carstens, the General Manager of Bank of International Settlements (BIS), the organization of more than sixty central banks from around the globe, Digital currencies are not real money, but an asset with an aesthetic importance to cryptographic connoisseurs. Cartens made those remarks on Thursday during the Finance and Global Economics Forum of the Americas in Miami. He presented his “Money and payment systems in the digital age” report with virtual coin part of it, dubbed “Cryptocurrencies: fake money.” “No discussion of money and payments in the digital age would be complete without addressing cryptocurrencies. But are cryptocurrencies money? No. The use of “currencies” is misleading,” Carstens told the attendees.
So all in all, locally the property news continues negative and globally the US rate hikes are set to create further pain across the markets. Blowback City in more ways than one!
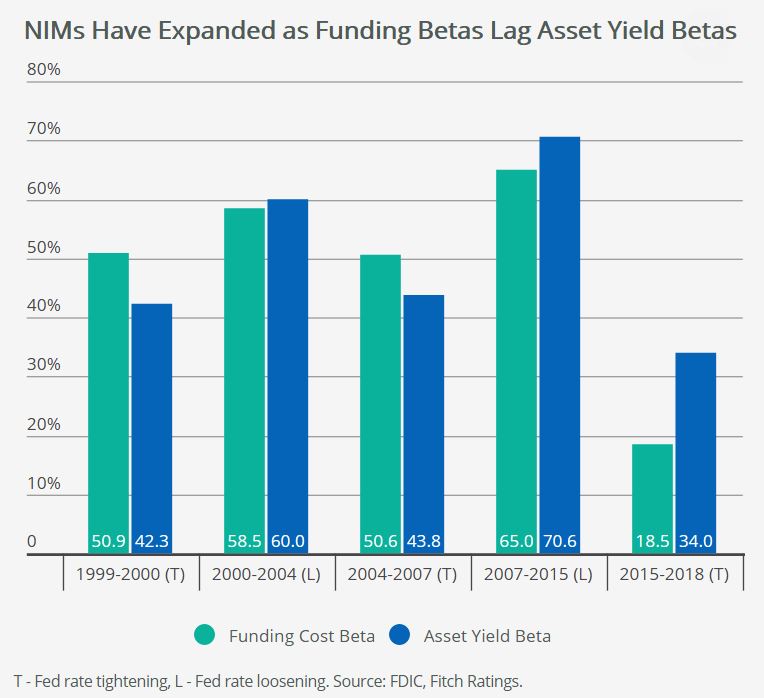
US banks should begin to see less and less benefit to earnings from rising short-term interest rates over the coming quarters, Fitch Ratings says. Net interest margins (NIMs) have continued to expand on a year-over-year basis due to the ongoing ability to lag funding costs relative to loan and investment portfolio repricing.
However, Fitch expects funding cost betas (or the proportion of the change in funding costs relative to the change in short-term interest rates) to continue to accelerate over the remainder of 2018 and into 2019. This could result in margin expansion stalling or even eventually reversing, which has begun in some markets driven by strong competition for both loans and deposits. Moreover, if longer-term interest rates continue to float upward and housing supply remains tight, Fitch expects to see further diminished levels of revenue generated from mortgage-banking operations across the industry.
Given how low rates were for so long, most U.S. banks had positioned their balance sheets to be asset sensitive. Banks that had been more asset sensitive at the beginning of the Fed tightening cycle were generally rewarded with margin expansion. By and large, these banks have shorter duration loan and investment portfolios, as well as strong core deposit franchises. Consequently, funding cost betas have remained lower relative to earning asset betas.
However, as low-or-no-cost deposits continue to either roll off balance sheets or rotate into higher cost deposit products such as money market savings accounts or certificates of deposits (CDs), returns from rising rates could diminish over time. Moreover, as the competitive environment for loans continues, Fitch believes loan spreads could remain tight, resulting in lower earning asset betas as short-term rates increase.
As seen below, in the past two tightening cycles, funding costs proved more sensitive to increasing rates than asset yields. This is in contrast with what has been experienced in the current tightening cycle so far, but funding cost betas have begun to close the gap.
Banks with low loan-to-deposit ratios should be able to maintain some flexibility to choose between repricing deposits and allowing some deposit runoff, which could allow for modest NIM expansion. On the other hand, those seeking to grow deposits to fund loan growth are likely to see funding costs continue to rise.
Rising rates, along with tight supply in the housing market, should also continue to pressure the revenue generated by and subsequent net income from mortgage operations at U.S. banks. Mortgage originations fell 16% at JPMorgan and 22% at Wells Fargo in 3Q18 on a year-over-year basis. Smaller mortgage competitors such as Hilltop Holdings saw originations fall 8% year over year and pre-tax income within the segment fall over 60%, weighing on the company’s overall earnings performance.
The Mortgage Bankers Association forecasts mortgage originations to fall 6% in total for 2018 (led by a 24% drop in refinancings) after a 17% decline in 2017. Lower originations should result in continued fee income pressure and lower production margins as the industry right sizes its overcapacity.
Taken together, these two factors have the potential to reverse the NIM and revenue expansion that most banks have been experiencing going into 2019. Still, Fitch does not believe there will be broad ratings implications for US banks from NIM expansion stalling or even compressing, nor due to less profitable mortgage operations. Moreover, continued benign asset quality as well as better operating efficiency driven by digitization efforts could contribute to stable earnings performance over coming quarters.
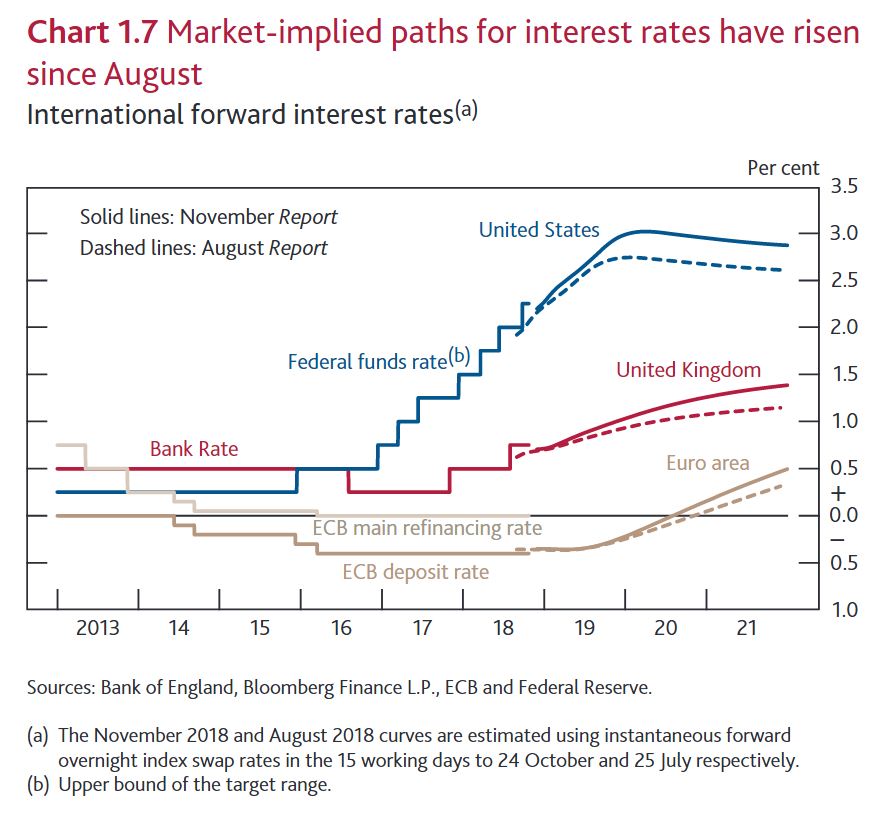
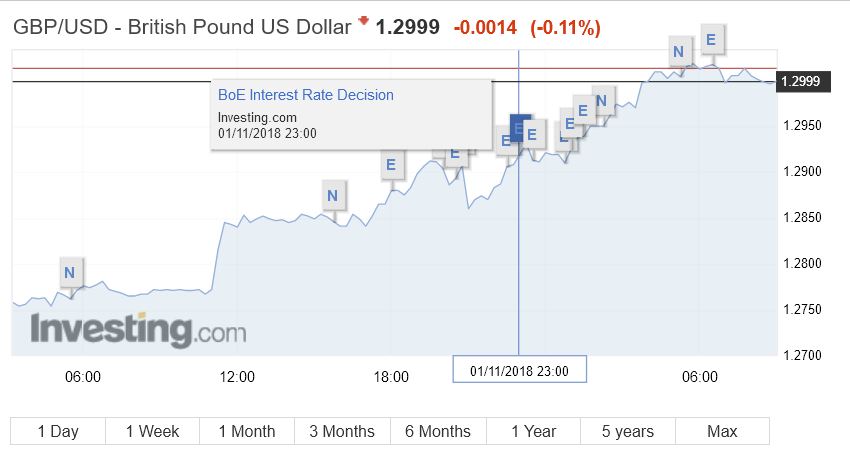
On one hand there was no change as “at its meeting ending on 31 October 2018, the MPC voted unanimously to maintain Bank Rate at 0.75%. The Committee voted unanimously to maintain the stock of sterling non-financial investment-grade corporate bond purchases, financed by the issuance of central bank reserves, at £10 billion. The Committee also voted unanimously to maintain the stock of UK government bond purchases, financed by the issuance of central bank reserves, at £435 billion”.
But the commentary highlighted the trend of higher rates ahead.
In August, the MPC raised Bank Rate to 0.75%. That had been anticipated well ahead of the announcement with most short‑term interest rates rising earlier in 2018).
In the run‑up to the November Report, stronger‑than‑expected activity and
inflation outturns, as well as increases in short‑term interest rates internationally, have pushed up the market‑implied path for Bank Rate. It is now expected to reach around 1.4% in three years’ time, up from 1.1% in August.
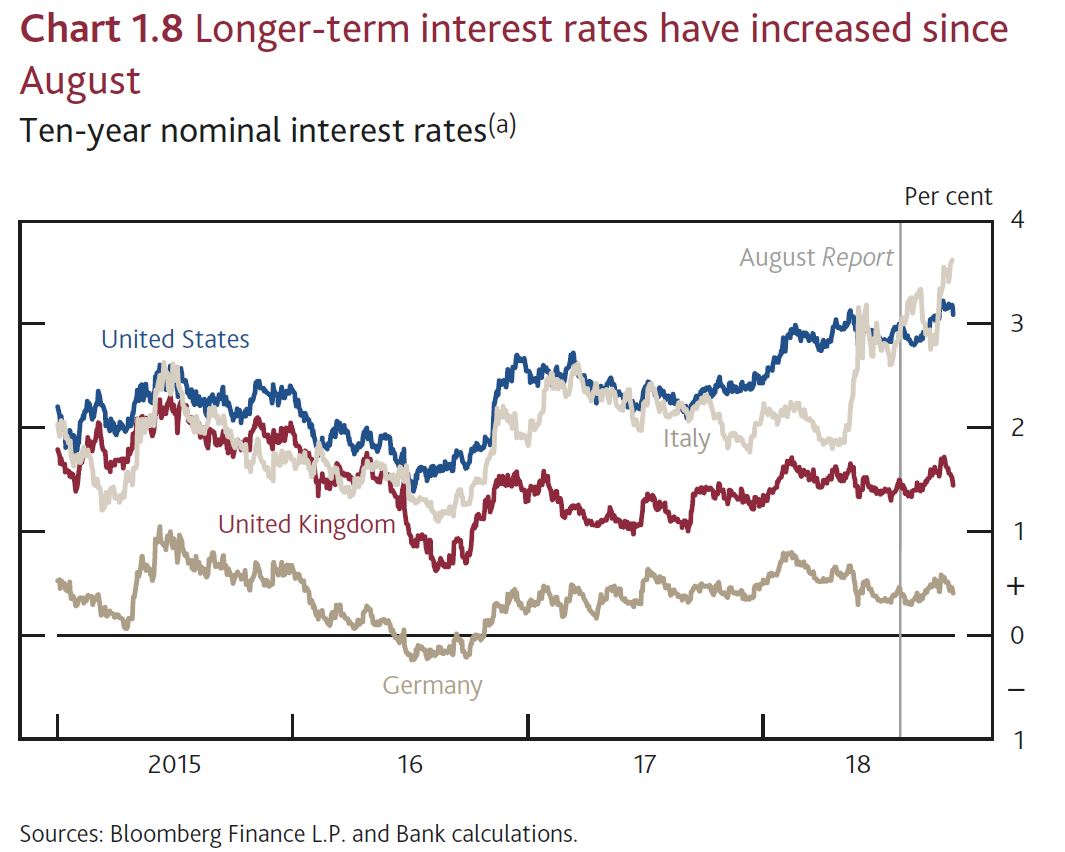
Long‑term UK interest rates have also risen since August, despite falling back in the run‑up to the November Report. Those rates have been affected in part by the increase in long‑term interest rates in other countries.
Unless there is a disorderly Brexit, it seems the market is now expecting 3 rate rises of 25 basis points ahead. As a result the pound moved higher.