Welcome to the Property Imperative weekly to 11th August 2018, our digest of the latest finance and property news with a distinctively Australian flavour. Another week, more data, so let’s dive straight in.
 And by the way, if you value the content we produce please do consider joining our Patreon programme, where you can support our ability to continue to make great content.
Watch the video, listen to the podcast or read the transcript.
We start with the trauma from Turkey which showed how fragile the financial markets are at the moment. Turkey’s finance minister (the President’s Son in Law) unveiled a new plan for their economy. The new economic stance will be one with “determination” — that’s a key part of it, he said. It will “transform” Turkey’s economy. It will also have a “strategic” and “powerful infrastructure.”
U.S. President Trump has repeatedly lashed out at Turkey over the continued detention of pastor Andrew Brunson, whom Turkish officials accuse of terrorism for his part of the failed 2016 coup, and no progress was made as delegates from both NATO countries met in Washington this week. Then Donald Trump, tweeted that he would double tariffs on Turkish steel and aluminum products.
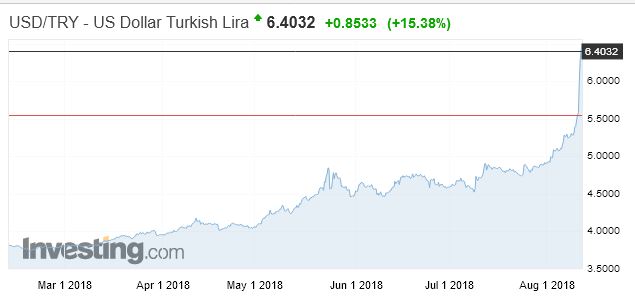
As a result, the Turkish Lira plummeted further. In the course of an hour, it reached a new low of 6.80 to the dollar, marking its worst daily performance in over a decade. This from Bloomberg:
It recovered a little afterwards, but it has lost about 40% of its value against the dollar since the start of the year.
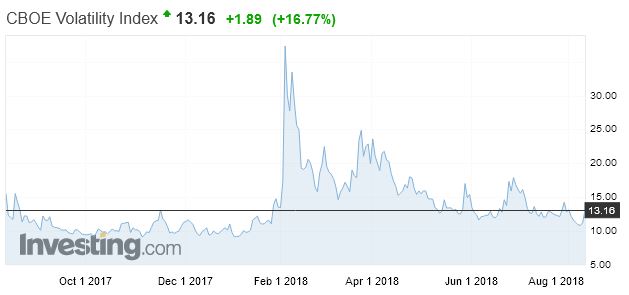
Many fear the fallout could spread beyond Turkey’s border, prompting traders to abandon riskier assets like stocks in search of safe-havens like gold, yen and Treasuries. Volatility, as measured by the VIX “fear index”, rose nearly 17%, highlighting investor concerns about the broader impact of a possible crash in Turkey’s economy.
One analyst said the exposure to a slump in Turkey’s economy is “pretty international,” though limited to the banking sector, but data from the Bank for International Settlements showed that Japanese banks are owed $14 billion, U.K. lenders $19.2 billion and the United States about $18 billion. Enough to make a dent.
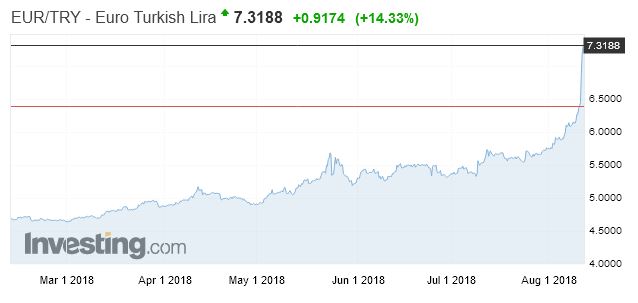
The Turkish Lira also moved the same way against the Euro, up 14.33%. “We’re not going to lose the economic warfare” being waged against Turkey said President Erdogan.
In the US, core consumer prices rose by their quickest pace in a decade in July and topped market forecasts, keeping the Federal Reserve on track to raise interest rates twice more this year. The data add to a robust picture of the US economy, which grew by a speedy annual rate of 4.1 per cent in the June quarter. The unemployment rate is close to its lowest level in 18 years. Core inflation, which strips out volatile energy and food prices and is closely followed by the Fed, rose 2.4 per cent year on year in July and up from 2.3 per cent in June. That was the fastest annual pace of core inflation since September 2008.
While headline inflation is rising more quickly than average hourly earnings, wages may pick up given the strength of the labour market. The Fed seems well positioned to carry on tightening policy at its current pace, with no reason to either speed up or slow down. That said, the Turkish situation took the probability of two more cuts down a little according to Bloomberg.
The US dollar was relatively steady following the inflation data. The DXY index, tracking the US currency against a weighted basket of global peers, was up 0.8 per cent following the inflation figures, having been up 0.6 per cent before the data release. The index rose above 96 on Friday for the first time in 11 months.
Looking at the US indices, the NASDAQ slipped 0.67% to 7,838 on Friday, while the DOW Jones Industrial slipped 0.77% to 25,313. Gold futures slide a little to 1,219 and Copper was down 0.74% to 2.75. Oil futures rose 1.45% to 67.78, as the International Energy Agency warned that the recent cooling in the market may not last. Bitcoin was weaker, down 6.03% to 6,153, not helped by the news that creditors of the defunct coin exchange Mt. Gox are trying to recoup money.
European shares also fell on Friday as worries over a dramatic fall in the Turkish lira jolted financial markets amid concerns of the region’s banks’ exposure to upheaval in Turkey. The Germans DAX fell 1.99% to 12,424.
Asian stocks closed mostly lower on Friday as global investors opted to sell risk assets while they also continued to assess the impact of the latest tit-for-tat in the trade war between the U.S. and China.
China’s Shanghai Composite index managed to eke out meagre gains on high volatility. The index had recorded seven straight swings of 1% or more, the longest stretch since Chinese markets crashed in 2015.
In other emerging markets currency, the Russian rouble continued its decline, hitting fresh two year lows, after the US imposed fresh sanctions against the Kremlin for its alleged part in poisoning a former British spy and his daughter in the UK. It closed at 67.71, up 1.52%.
The Aussie continued to slide, as expected, down 1.04% on Friday to 72.96. And we also slipped against the British pound, down 0.63%.
Trade Tariffs continue to worry the market, with Fitch suggesting there is every reason to believe the United States’ trade dispute with China will get worse before it gets better, and that the US trade deficit will widen further rather than shrinking.
Now that they are on the receiving end of US tariffs, Chinese policymakers have three options. First, they could capitulate, by scaling back many of the “discriminatory practices” identified in the US Trade Representative’s March 2018 report on technology transfers and intellectual property. So far, there is no indication that China is considering this option. Second, China could escalate the dispute. It could set its own tariffs higher than those of the US, apply them to a larger range (and greater dollar value) of US exports, or offset the impact of US tariffs on Chinese exporters by allowing the renminbi to depreciate against the dollar. Alternatively, policymakers could look beyond trade in goods to consider capital flows and related businesses associated with US firms, effectively allowing the authorities to impede US financial and nonfinancial firms’ Chinese operations. As with the first option, this one seems unlikely, at least at this stage of the dispute. So far, China has chosen the third option, which lies between capitulation and escalation. China has retaliated, but only on a like-for-like basis, matching US tariff rates and the dollar value of trade affected. At the same time, it has tried to claim the moral high ground, by eliciting international condemnations of protectionism and unilateralism. This hasn’t been difficult, given that several other major economies are currently facing US tariffs. Securing such third-party buy-in is critical for the Chinese leadership’s domestic position. If the government were perceived at home as being bullied by the US, it would have to take a much tougher line in the trade dispute.
Fitch thinks that the US actually has rather limited options, despite having initiated the dispute. Even for a notoriously unpredictable administration, a full and unconditional reversal on tariffs seems out of the question. But so is the status quo, now that China has already levelled the playing field by retaliating in kind. That leaves only escalation – a possibility that the Trump administration has already raised by threatening additional tariffs on all imports from China
With the US locked in a trade war with China and other nations, Gregory Daco at Oxford Economics suggested that higher tariffs could gradually filter through to producer and consumer prices, supporting expectations of a gradual pick-up of inflationary pressures.
Locally, the RBA released its quarterly Statement on Monetary Policy with updated forecasts for inflation, unemployment and economic growth. The central bank has downgraded its inflation forecast for 2018. The RBA now expects both core and underlying inflation to rise by 1.75% to December 2018, down from the May forecasts of 2.25% and 2% respectively. Beyond that time frame, the central bank kept its inflation forecasts relatively unchanged. Previously, it expected both core and underlying inflation to reach 2.25% by the middle of 2020. In Tuesday’s rate announcement, Lowe also said that “a further gradual decline in the unemployment rate is expected over the next couple of years to around 5%”. The bank has maintained its forecasts that the unemployment rate will stay at around 5.25% through to June 2020, before dropping to 5% in December.
It’s also worth looking at Lowe’s speech on Wednesday, when he said that “Electricity prices in some cities have declined recently after earlier large increases, and changes in government policy are likely to result in a decline in child care prices as recorded in the CPI,” Lowe said. “There have also been changes to some state government programs that are expected to lead to lower measured prices for some services.” In Tuesday’s rates decision, Lowe said “the central forecast is for inflation to be higher in 2019 and 2020 than it is currently”.
The central bank slightly bumped up its forecasts for GDP growth in Q2 2018, to 3% from 2.75%. Longer-term, the bank’s growth projections were little-changed. It still expects GDP growth to average 3.25% over the next two financial years, before falling to 3% in June 2020 and remaining at that level through to December.
Given the projections were the first to include a time frame out to December 2020, the forecasts confirmed that underlying inflation pressures are expected to remain low for at least the next two and a half years. The latest set of projections confirmed that the RBA still looks set to keep interest rates on hold for the foreseeable future.
The Royal Commission hearings were back with avengence this week, with NAB’s MLC Wealth management business in the spotlight first, and later in the week IOOF. We saw more of the poor cultural norms on display, with investors being charged for no service, and attempts to block the release of documents and the late delivery of evidence to the commission. In fact, the CEO of NAB went as far as releasing an apology in Twitter. NAB shares ended up slightly to $28.09.
Shares in IOOF, Australia’s second largest wealth manager fell as senior executives from the fund manager appeared before the commission. At the close, the shares were down 2.7% to $8.73. Questioning in the royal commission centred around payments to related parties and the flow of cash back to the super fund from external fund managers when IOOF invests in those funds. Michael Hodge, senior counsel assisting the royal commission, said: “One of the things we are trying to understand is how trustees go about dealing with these volumes based fees where a percentage of the investment of the trust’s money is being paid to another part of the retail group.” Tendered to the commission today was a letter from prudential regulator APRA to IOOF about the conflicts of interest between members of the IOOF super fund and shareholders of IOOF.
The bottom line, is that poor corporate behaviour and the inability of regulators to get to the key facts was again in evidence, and again, consumers lose out as a result. It is shameful.
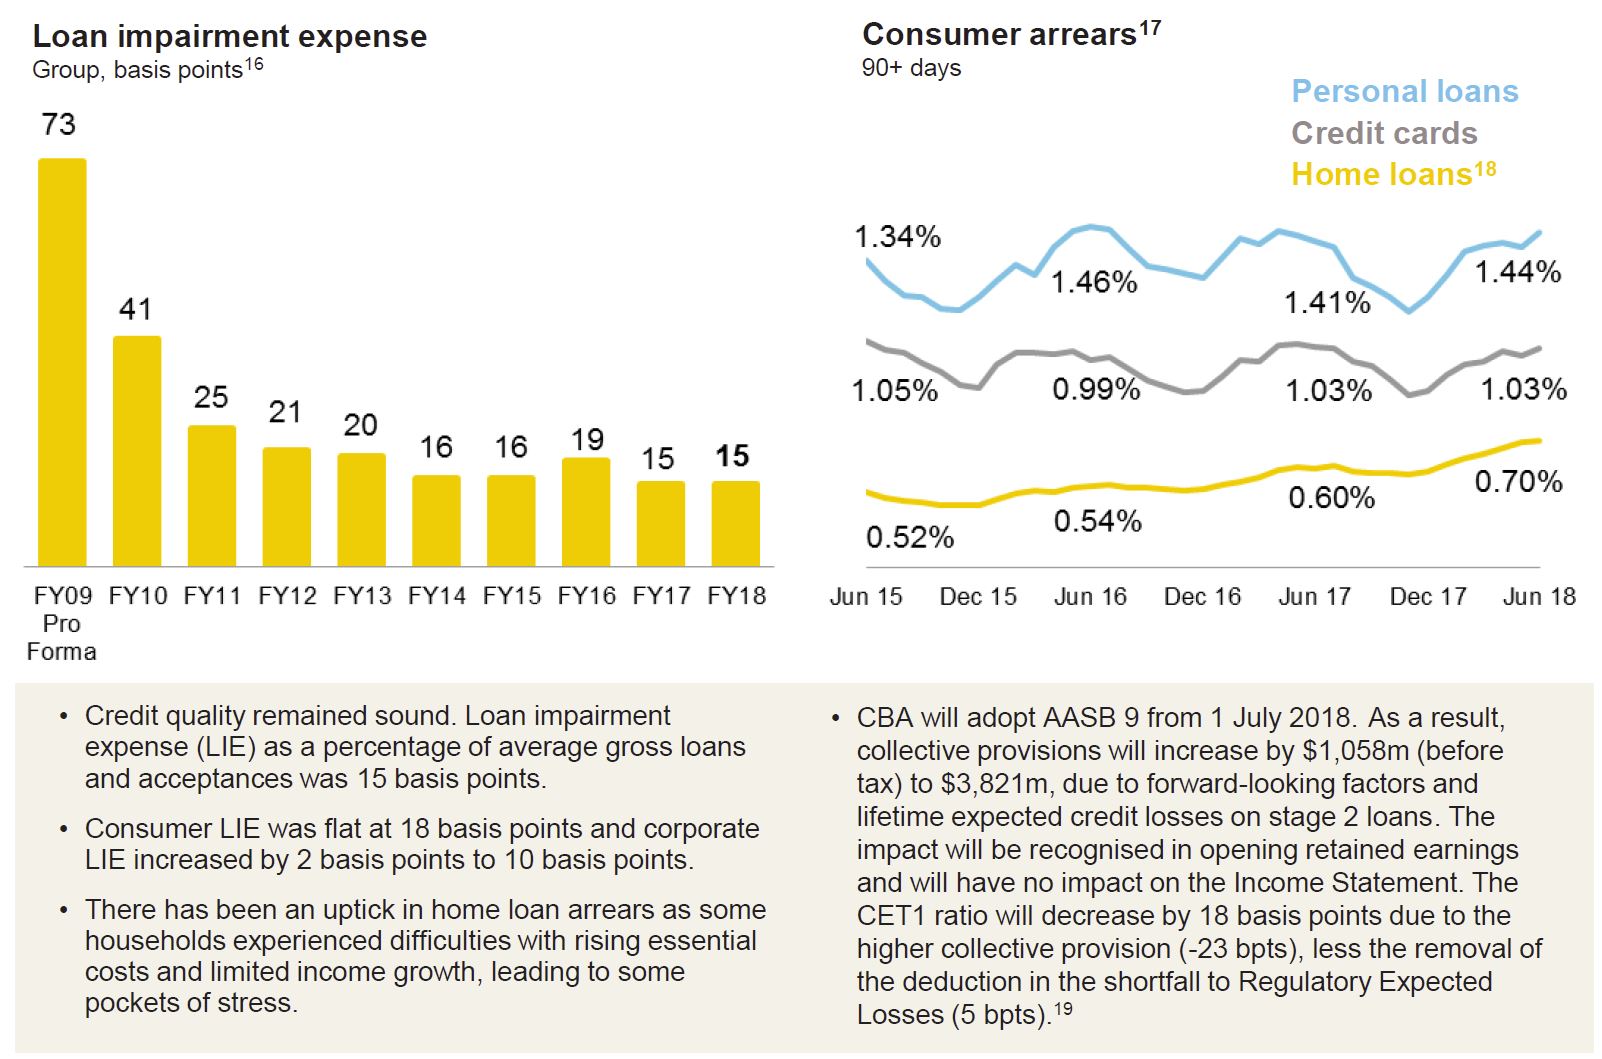
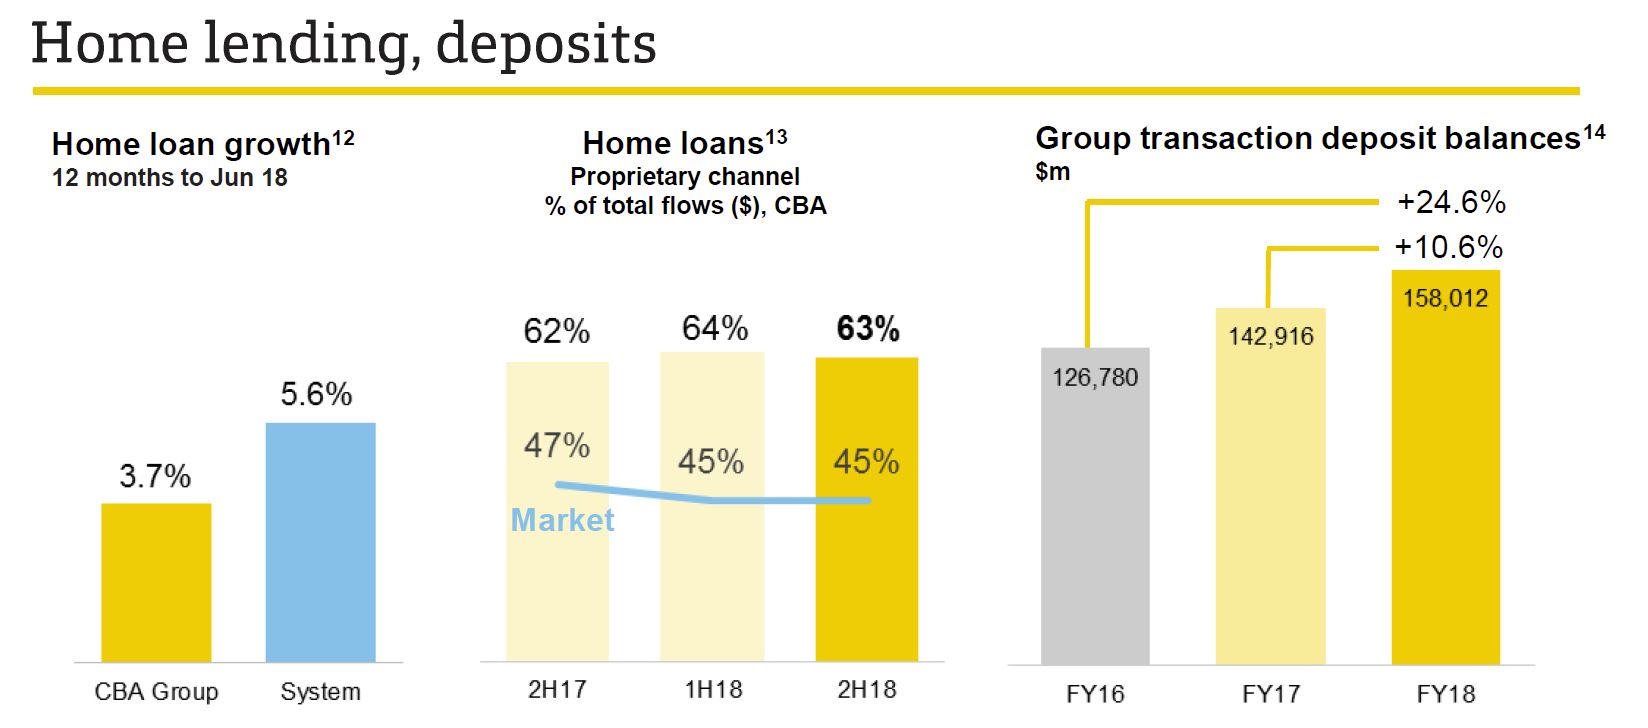
The CBA’s full-year results to 30 June 2018 (FY18) highlighted the pressure on Australian banks with an increase in wholesale funding costs squeezing CBA’s net interest margin in 2H18, slower loan growth and continued investment into the business and compliance contributed to higher expenses. Mortgage arrears also trended upwards due to some pockets of stress, and while they have not translated into higher provision charges as yet due to strong security values, continued moderation in Australian house prices may result in higher provisioning charges in future financial periods. CBA shares were up 0.03% on Friday to 75.39, and several commentators are claiming the worst is over for them, unlike for AMP, who also reported, and whose shares remain in the doldrums, reflecting the major changes to turn that ship around. Suncorp also reported and they did pretty well in the tight market, their shares rose after their results, and now stands at 15.63.
However, expect more bad news ahead, placing pressure on profit growth for all Australian banks. Increased regulatory and public scrutiny of the sector may make it difficult for the larger banks to reprice loans to incorporate the increase in wholesale funding costs, meaning net interest margins are likely to face some downward pressure. Loan growth is likely to further slow as the housing market continues to moderate, while compliance costs continue to rise due to the scrutiny on the sector. And of course the most prominent scrutiny is the royal commission into misconduct in the banking, superannuation and financial services industry, which has already identified a number of shortcomings within the industry.
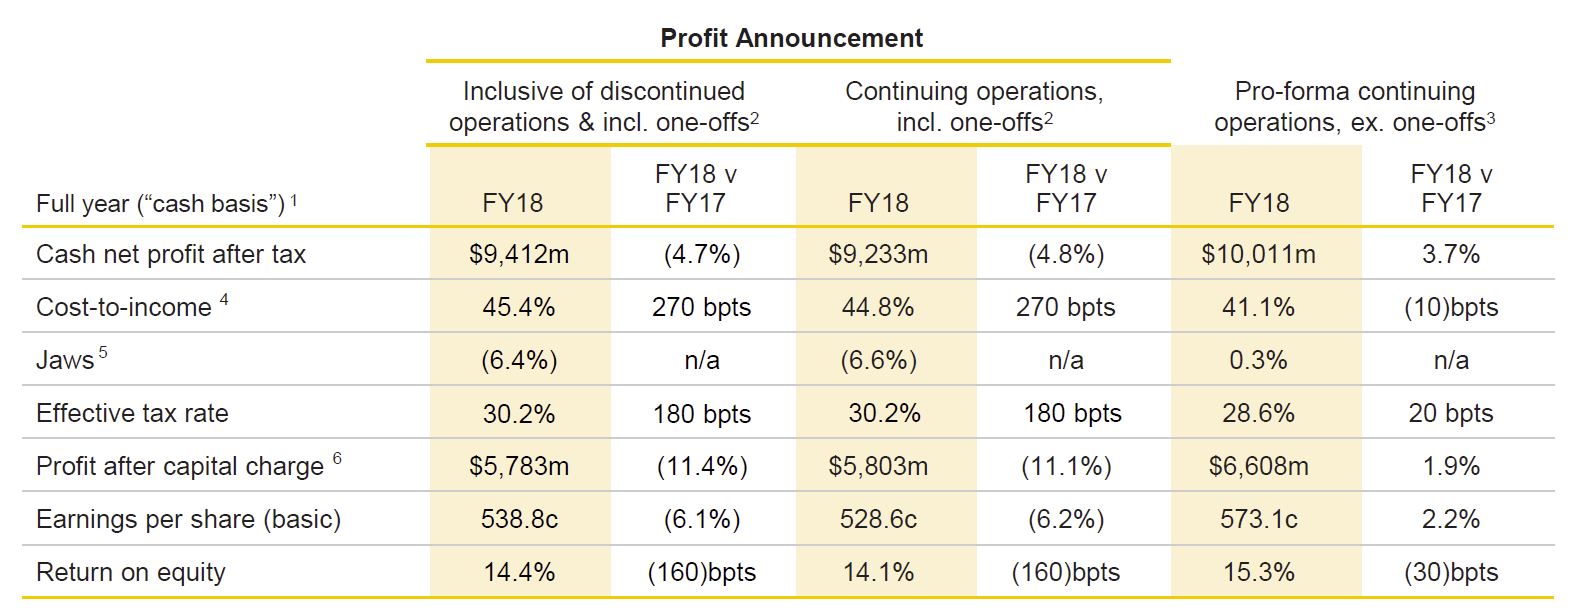
That said, CBA’s FY18 results show a level of resiliency despite these issues. The bank reported cash net profit after tax from continuing operations declined 5% to AUD9.2 billion in FY18, but this was driven by a number of one-off charges, including a AUD700 million fine to settle a civil case in relation to breaches of anti-money laundering and counter-terrorism financing requirements. Cash net profit after tax from continuing operations rose by 4% to AUD10.0 billion when the one-off items were excluded.
CBA has much more to do to fix its reputation, and strong capital ratios are not sufficient to allay the concerns in the business. It is more about culture and putting customers first.
So, perhaps no surprise this week, the Greens called for the big banks to be broken up. They said “It’s time that banks became banks again. Australians are sick and tired of these massive financial institutions getting away with murder because they can throw stacks of money at the two old political parties. Our banks should be working for us, not against us and this policy will make sure that happens.
Under the Greens proposal: Banks will no longer be able to own wealth management businesses that both create financial products and spruik them to unsuspecting customers. Consumers will be able to easily distinguish between the simple and essential products and services that the vast majority of Australians use—deposits and loans, superannuation and insurance—and the more complex and selective activity that is the domain of big business, the wealthy, and the adventurous. By removing hidden conflicts of interest, Australians will be able to trust that the advice they’re getting from their banker is designed to line their own pocket, not the other way round. The watchdogs have failed. They would strip ASIC of its responsibility for overseeing consumer protection and competition within the essential services of basic banking, insurance and superannuation and return them to the ACCC.
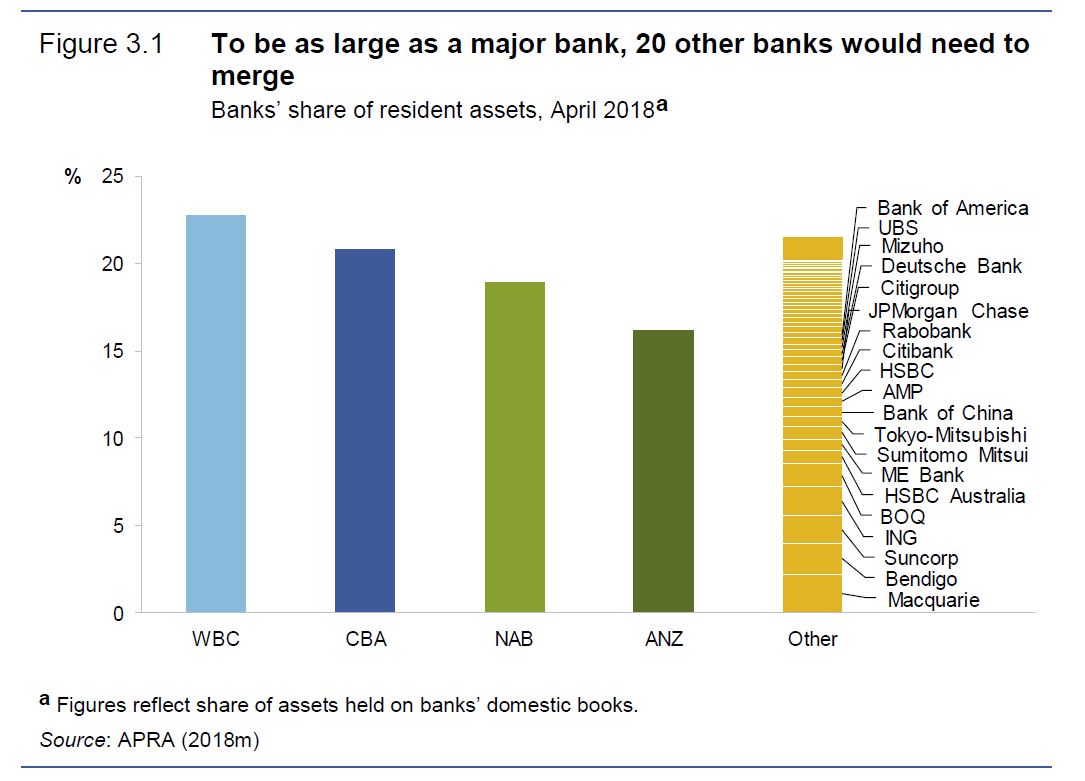
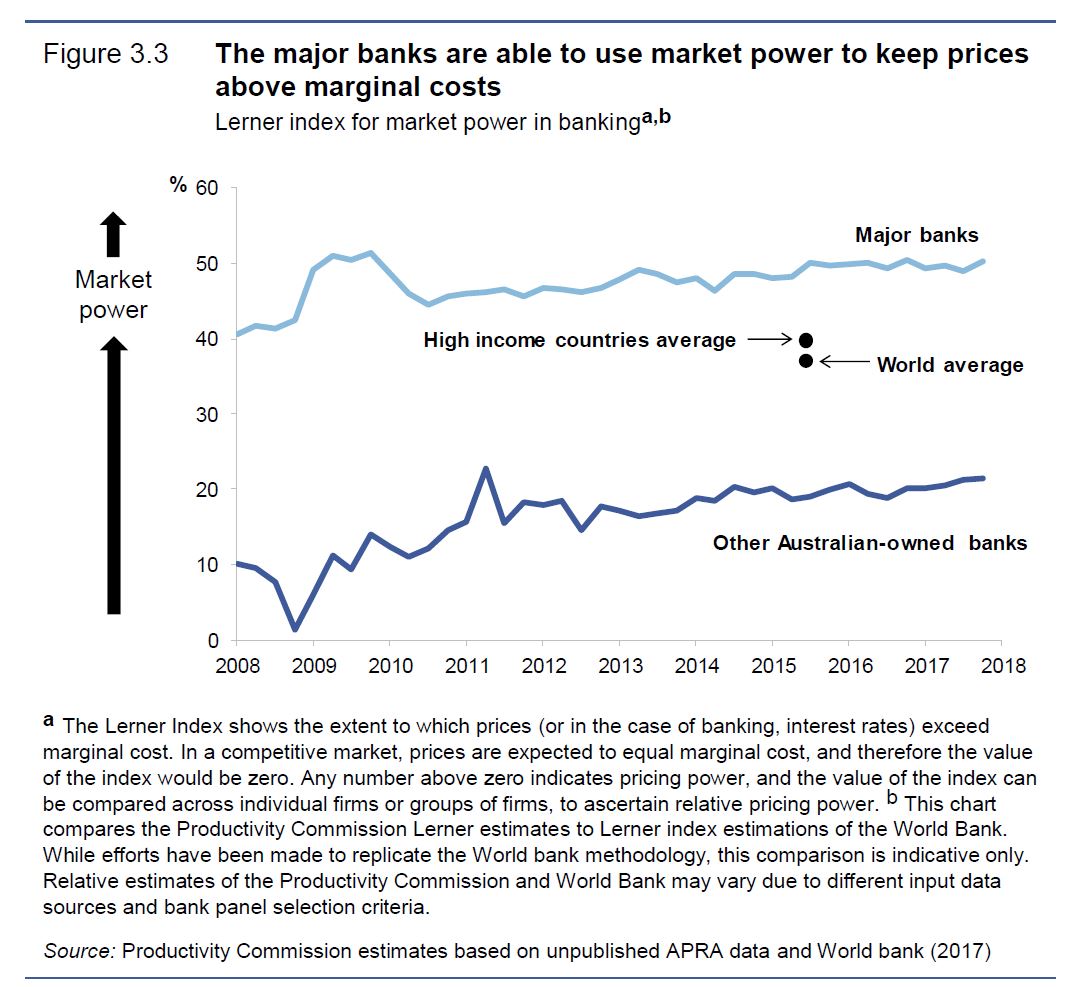
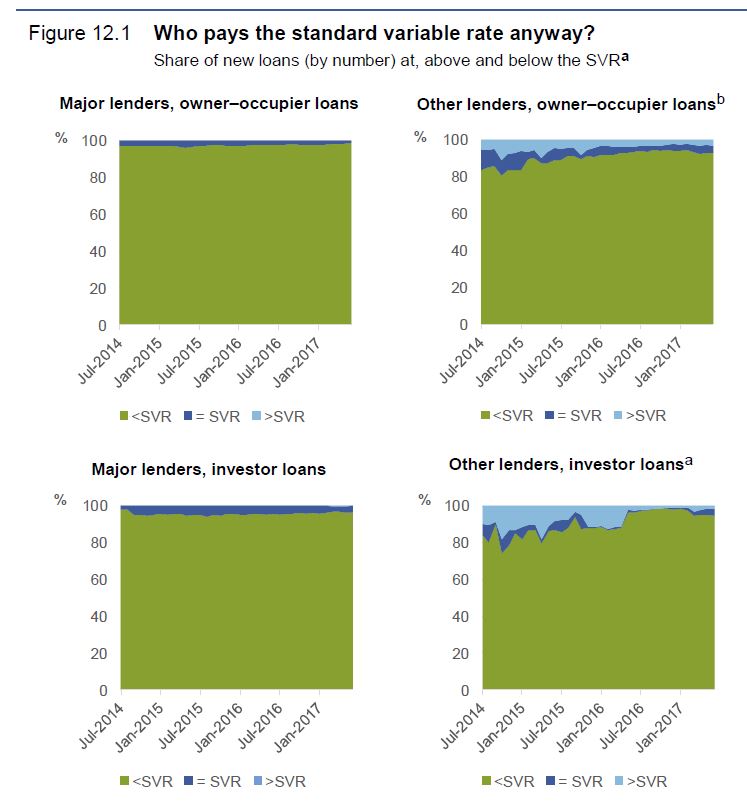
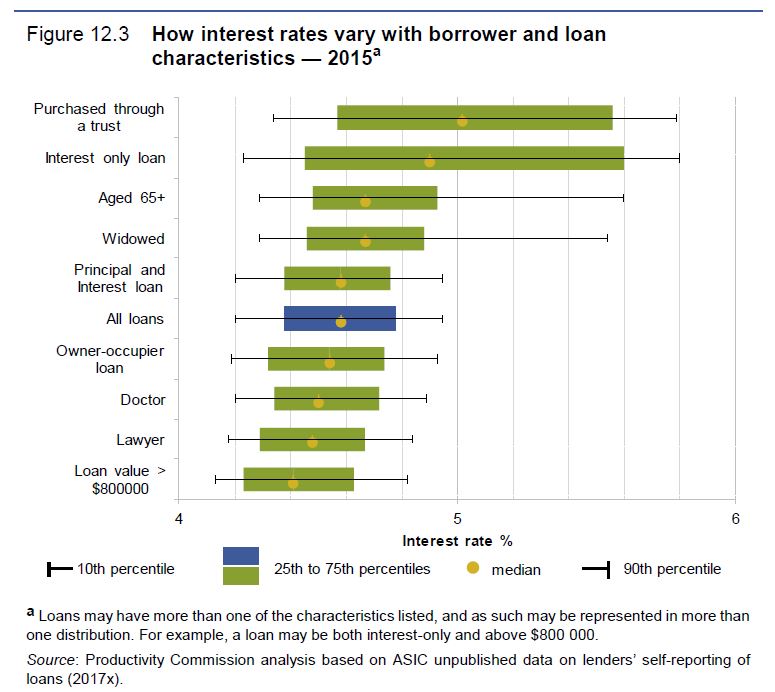
But we believe there is much more to do than just breakup the banks. We will be discussing this in a future post. The major banks have too much market power, as we discussed on our recent video How Much Market Power Do “The Big Four” Hold? and they continue to milk customers using poor business practice, for example in the home loan market, the mortgage rate you get is hard to compare, and obtuse. We discussed this in our show “Price Information In the Home Loan Market”.
You might also like to watch our show on the latest lending statistics and mortgage stress data, “Lending, Stress and All Things DFA”, as we are not going to have time to cover these today.
So quickly to the property market. Once again prices continue to fall in the main centres of Sydney and Melbourne.
In terms of auctions, CoreLogic says that last week the number across the combined capital cities fell with 1,324 held with a final clearance rate of 54 per cent, down from the previous week. Combined clearance rates have levelled out somewhat remaining within the low to mid 50 per cent range for 13 consecutive weeks. They note that despite the continued slowing in the market, clearance rates are still tracking higher each week relative to the same period in 2012; during the last significant downturn in home values.
Melbourne’s final clearance rate came in at 57 per cent across 629 auctions last week compared with 911 last year returning a substantially higher clearance rate of 73.9 per cent. Sydney’s final auction clearance rate fell to 51.9 per cent across 462 auctions last week, down on the previous weeks. In same week last year, 620 homes went to auction and a clearance rate of 66.4 per cent was recorded.
This week, 1,320 capital city auctions are currently being tracked by CoreLogic; remaining relatively steady on last week’s final result which saw 1,324 auctions held. Over the same period one year ago, there was a considerably higher 2,040 homes taken to auction.
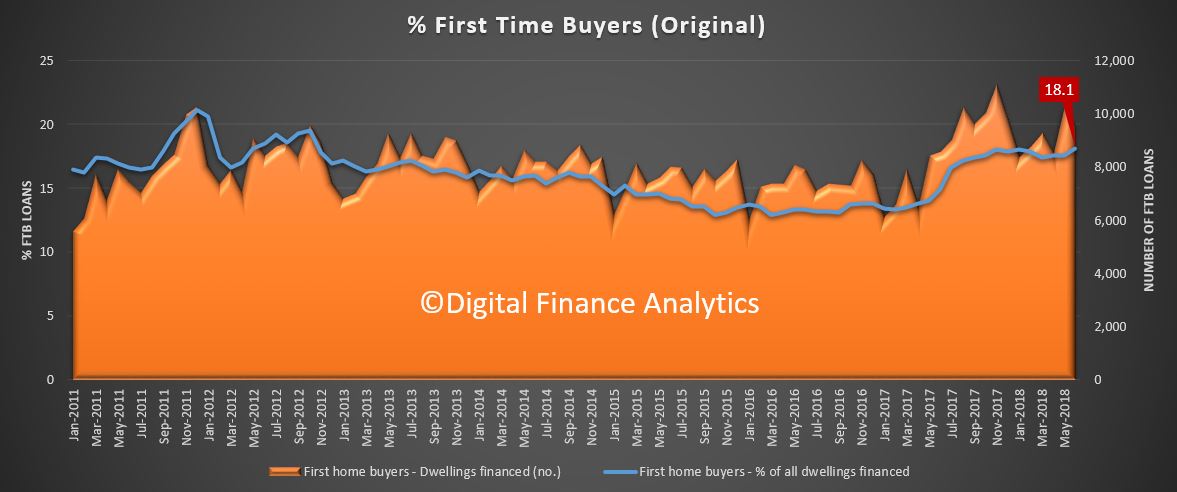
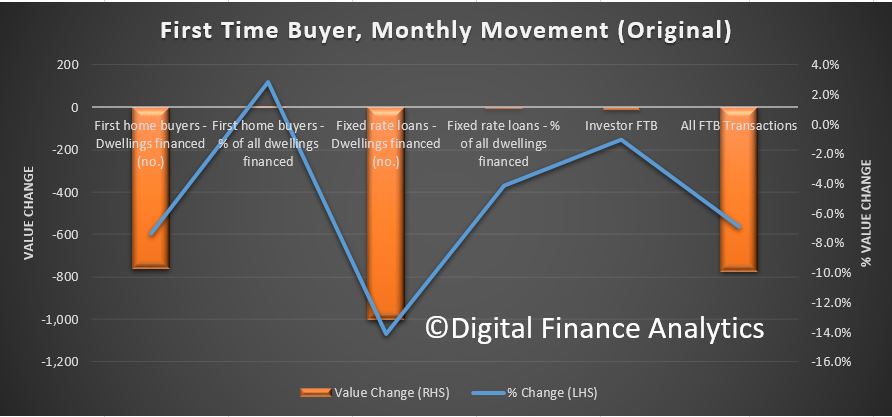
In June, according to the latest ABS housing finance data, first-home buyers accounted for 18.1% of the growth in owner-occupier loans, continuing a trend seen throughout this year. The chart from the RBA helps illustrate the effect that first home-buyers are having on the market. Clearly, there’s a trend underway in Sydney and Melbourne: The value of cheaper homes is holding up, while more expensive home prices have gone into reverse.
This is explained by increasing incentives in NSW and Victoria for first time buyers, and also more lower priced small apartments are coming on stream. The figures tie in with recent trends evident in the Sydney market, with more evidence of recent price falls among higher-end properties valued above $2 million.
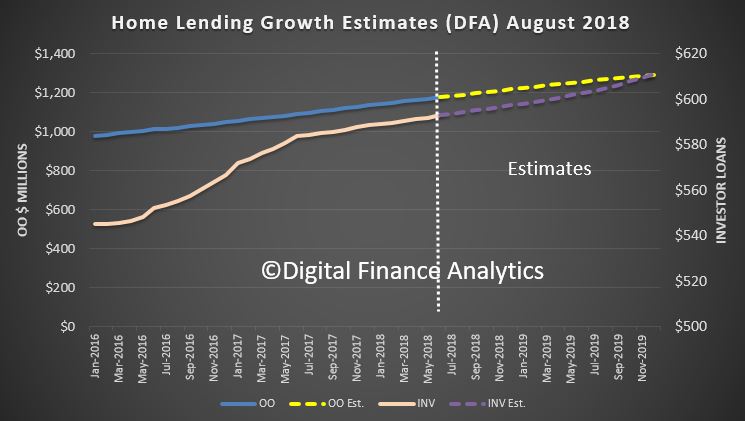
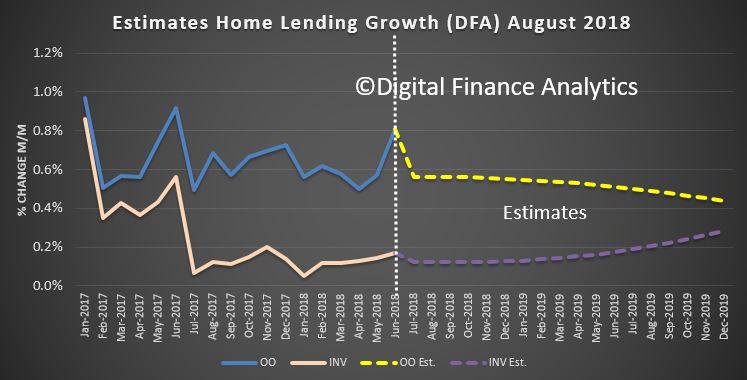
Of course the question is, with prices falling, and likely to continue to fall further, could first time buyers get a better deal later by waiting for further falls. That, in my view is a tricky call but our modelling of future credit growth suggests first time buyers will continue to prop up the lower end of the market for some time to come yet.
And finally today, mark your diary, the next DFA live stream event will be on Tuesday 21st August at eight PM Sydney. I will be providing more information shortly about the event, but is already scheduled on the channel if you want to set a reminder. And feel free to send questions in beforehand.