Mortgage Stress Climbs Again in October

We have completed our October 2018 mortgage stress analysis and today we discuss the results.

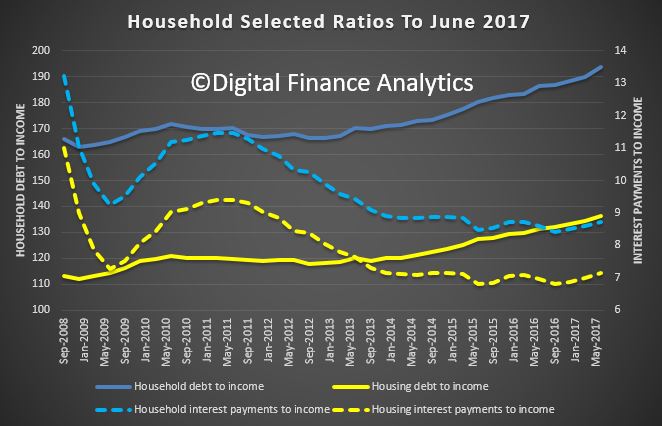
The latest RBA data on household debt to income to June reached a new high of 190.5.  This high debt level helps to explain the fact that mortgage stress continues to rise. Having crossed the 1 million Rubicon last month, across Australia, more than 1,008,000 households are estimated to be now in mortgage stress (last month 1,003,000). This equates to 30.7% of owner occupied borrowing households.

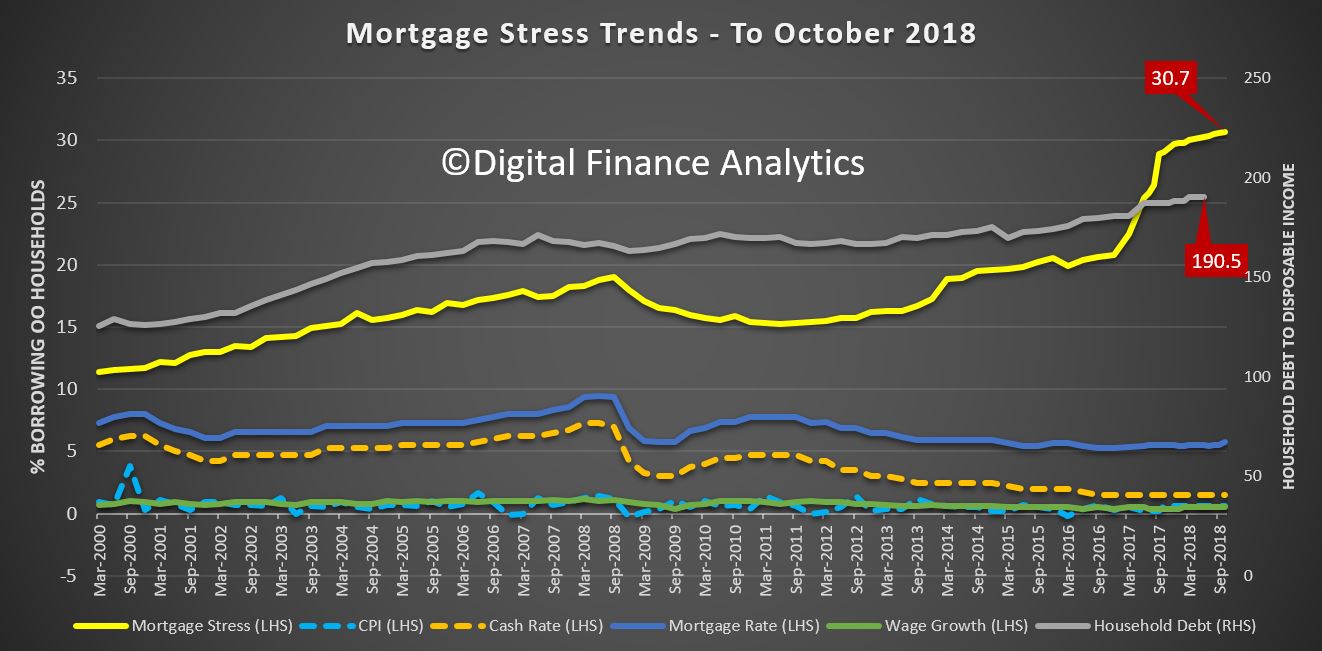
 In addition, more than 22,000 of these are in severe stress. We estimate that more than 61,000 households risk 30-day default in the next 12 months. We continue to see the impact of flat wages growth, rising living costs and higher real mortgage rates.  Bank losses are likely to rise a little ahead.

Our analysis uses the DFA core market model which combines information from our 52,000 household surveys, public data from the RBA, ABS and APRA; and private data from lenders and aggregators. The data is current to the end of October 2018. We analyse household cash flow based on real incomes, outgoings and mortgage repayments, rather than using an arbitrary 30% of income.

Households are defined as “stressed” when net income (or cash flow) does not cover ongoing costs. They may or may not have access to other available assets, and some have paid ahead, but households in mild stress have little leeway in their cash flows, whereas those in severe stress are unable to meet repayments from current income. In both cases, households manage this deficit by cutting back on spending, putting more on credit cards and seeking to refinance, restructure or sell their home.  Those in severe stress are more likely to be seeking hardship assistance and are often forced to sell.

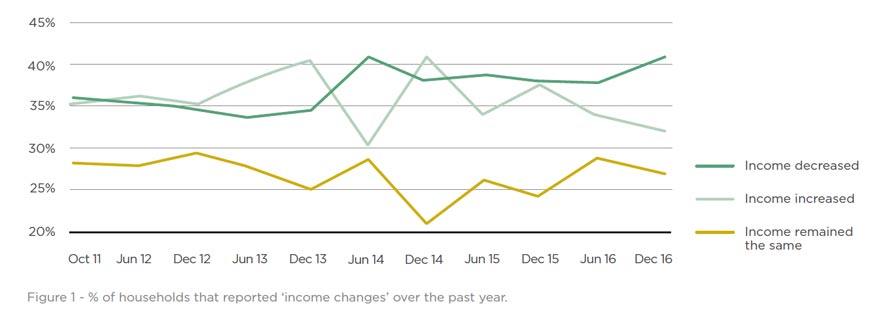
This rise in stress, which has continued for the past 6 years, should be of no surprise at all.  “Continued rises in living costs – notably child care, school fees and fuel – whilst real incomes continue to fall and underemployment is causing significant pain. Many are dipping into savings to support their finances.”

Indeed, the fact that significant numbers of households have had their potential borrowing power crimped by lending standards belatedly being tightened, and are therefore mortgage prisoners, is significant. More than 40% of those seeking to refinance are now having difficulty. This is strongly aligned to those who are registering as stressed.  These are households urgently trying to reduce their monthly outgoings.

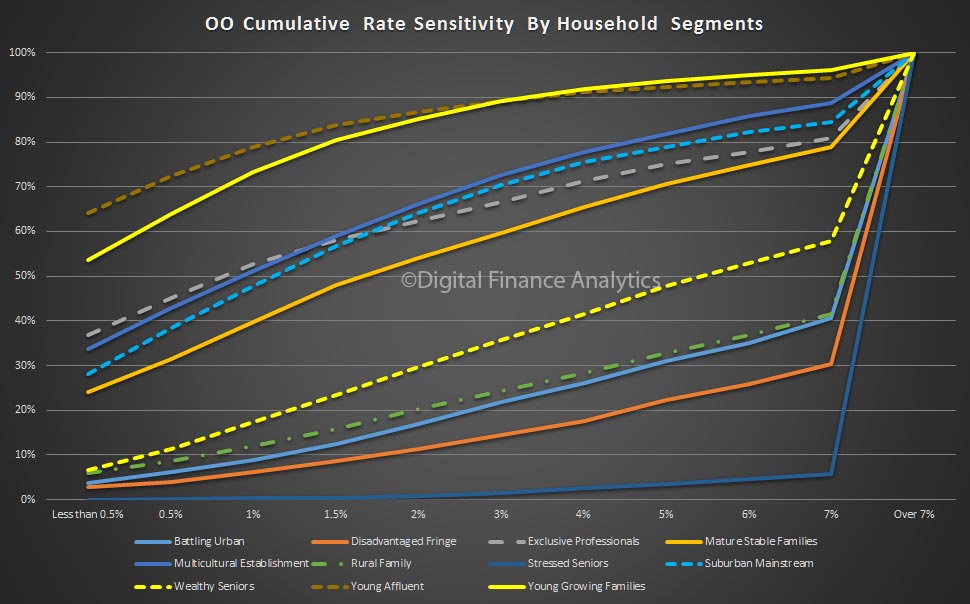
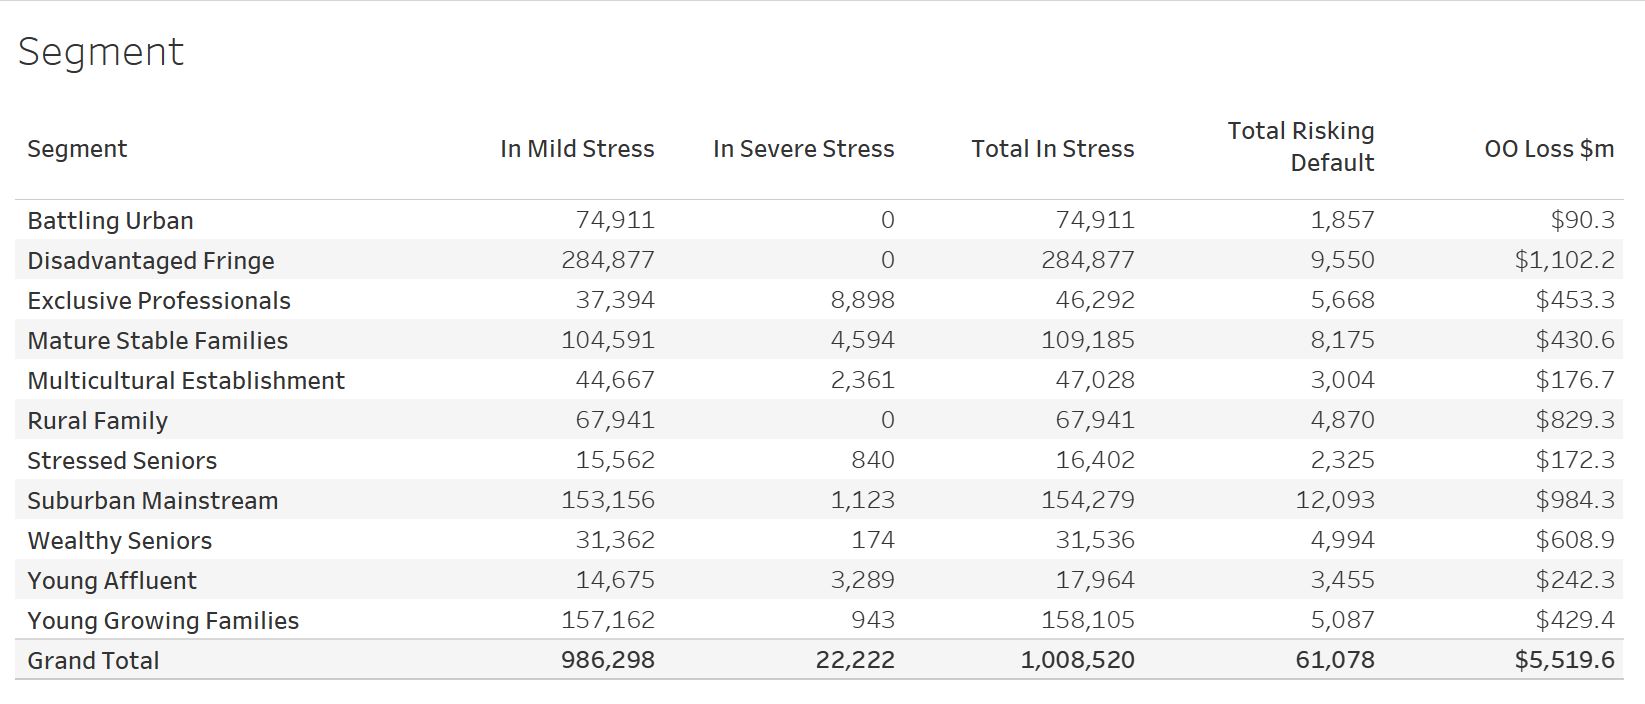
Probability of default extends our mortgage stress analysis by overlaying economic indicators such as employment, future wage growth and cpi changes.  Our Core Market Model also examines the potential of portfolio risk of loss in basis point and value terms. Losses are likely to be higher among more affluent households, contrary to the popular belief that affluent households are well protected.  This is shown in the segment analysis, with some more wealthy households up against it.

Regional analysis shows that NSW has 272,536 households in stress (276,132 last month), VIC 281,922 (276,926 last month), QLD 178,015 (176,528 last month) and WA has 132,827 (132,700 last month). The probability of default over the next 12 months rose, with around 11,630 in WA, around 11,300 in QLD, 15,200 in VIC and 16,200 in NSW.  
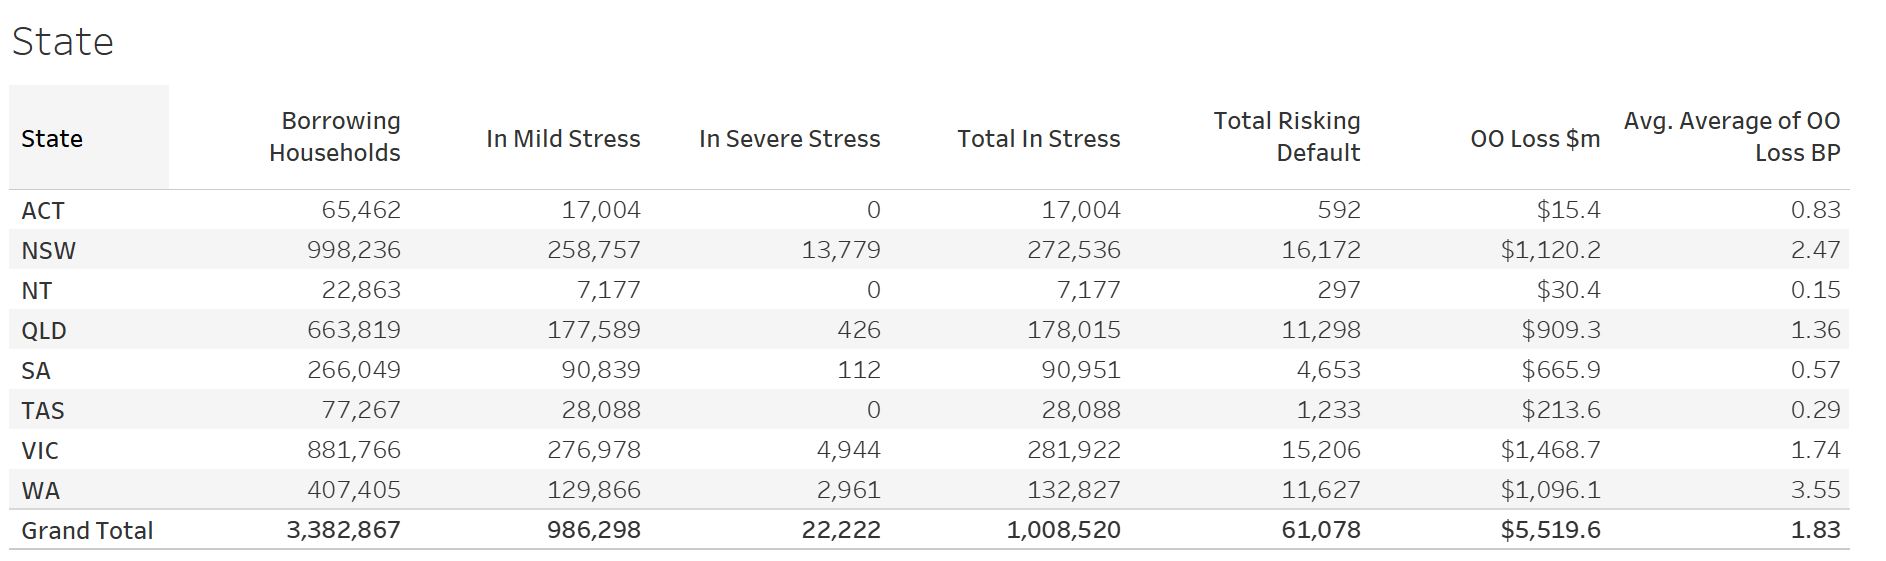
The largest financial losses relating to bank write-offs reside in NSW ($1.1 billion) from Owner Occupied borrowers) and VIC ($1.74 billion) from Owner Occupied Borrowers, though losses are likely to be highest in WA at 3.6 basis points, which equates to $1,096 million from Owner Occupied borrowers.

Turning to the post codes with the largest counts of households in stress, fifth was Melbourne suburb Berwick and Harkaway, 3806, with 5,267 households in stress and 143 risking default.

In fourth place is Toowoomba and the surrounding area, in Queensland, 4350, with 6,437 households in stress and 256 risking default.

Next in third place is Campbelltown in NSW, 2560, with 6,781 households in stress and 110 risking default.

In second place is Tapping and the surrounding areas in WA, 6065 with 7,409 in stress and 298 risking default

And in first place, the post code with the largest number of households in mortgage stress this month is the area around Chipping Norton and Liverpool, 2170, with 7,732 households in stress and 116 risking default.

As always, it’s worth saying that given flat incomes, and rising costs, and some mortgage rate rises, the pressure will continue, and falling home prices will make things worse. Many people do not keep a cash flow, so they do not know their financial position – drawing one up is the first step and ASIC has some excellent advice on their MoneySmart website. And the other point to make is, if you are in financial distress, you should talk to your lender, they do have an obligation to help in cases of hardship. The worst strategy is simply to ignore the issue and hope it will go away. But in my experience, this is unlikely.

We will update the data again next month.

You can request our media release. Note this will NOT automatically send you our research updates, for that register here.

[contact-form to=’mnorth@digitalfinanceanalytics.com’ subject=’Request The October 2018 Stress Release’][contact-field label=’Name’ type=’name’ required=’1’/][contact-field label=’Email’ type=’email’ required=’1’/][contact-field label=’Email Me The October 2018 Media Release’ type=’radio’ required=’1′ options=’Yes Please’/][contact-field label=”Comment If You Like” type=”textarea”/][/contact-form]

Note that the detailed results from our surveys and analysis are made available to our paying clients.

Are US Rates Going Higher?

The 10-Year US Bond yield is moving higher.  This is important because it has a knock-on effect in the capital markets and so Australian Bank funding costs, potentially putting upward pressure on mortgage rates.

Whilst the US Mortgage rates were only moderately higher today, the move was enough to officially bring them to the highest levels since the (Northern) Spring of 2017.

So this piece from Moody’s is interesting.  Is the markets view that rates won’t go higher credible?

Earnings-sensitive securities have thrived thus far in 2018. Not only was the market value of U.S. common stock recently up by 4.5% since year-end 2017, but a composite high-yield bond spread narrowed by 23 basis points to 336 bp. The latter brings attention to how the accompanying composite speculative-grade bond yield fell from year-end 2017’s 5.82% to a recent 5.72% despite the 5-year Treasury yield’s increase from 2.21% to 2.39%, respectively.

Thus, the latest climb by the 10-year Treasury yield from year-end 2017’s 2.41% to a recent 2.62% is largely in response to the upwardly revised outlook for real returns that are implicit to the equity rally and the drop by the speculative-grade bond yield. The 10-year Treasury yield is likely to continue to trend higher until equity prices stagnate, the high-yield bond spread widens, interest-sensitive spending softens, and the industrial metals price index establishes a recurring slide. In view of how the PHLX index of housing sector share prices has risen by 4.5% thus far in 2018, investors sense that home sales will grow despite the forthcoming rise by mortgage yields.

Moreover, increased confidence in the timely servicing of home mortgage debt has narrowed the gap between the 30-year mortgage yield and its 10-year Treasury yield benchmark from the 172 bp of a year earlier to a recent 152 bp. The latter is the narrowest such difference since the 150 bp of January 2014, which roughly coincided with a peaking of the 10-year Treasury yield amid 2013-2014’s taper tantrum.

Do suppliers of credit to the high-yield bond market and mortgage market correctly sense an impending top for benchmark Treasury yields? If they are wrong and the 10-year Treasury yield quickly climbs above its 2.71% average of the six-months-ended March 2014, they will regret having acquiesced to the atypically thin spreads of mid-January 2018.

Household Debt Burden Rises Once Again – RBA

The RBA has updated its E2 Household Finances Selected Ratios to June 2017. As a result, we see another rise in the ratio of household debt to income, and housing debt to income. Both are at new record levels.

In addition, we see the proportion of income required to service these debts rising, as out of cycle rates rises hit home. These ratios are below their peaks in 2011, when the cash rate was higher, but it highlights the risks in the system should rates rise.

We discuss this further in our September Mortgage Stress Data, to be released shortly.  The debt chickens will come home to roost!

But the policy settings are wrong, debt cannot continue to grow at more than three times cpi or wage growth.


More Evidence Of Households In Financial Stress

A new report released today by the Centre for Social Impact, in partnership with NAB explores the complex reasons why many Australians are facing increasing financial stress. Financial Resilience in Australia 2016 builds on the 2015 report to show that while people are more financially aware, savings are shrinking and economic vulnerability is on the rise.

The overall level of financial resilience in Australia decreased between 2015 to 2016. In 2016, 2.4 million adults were financially vulnerable and there was a significant decrease in the proportion who were financially secure (35.7% to 31.2%).

Looking at the components of financial resilience, between 2015 and 2016: the mean level of economic resources did not significantly change and, in good news, people’s levels of financial knowledge and behaviour significantly increased.

However, people’s levels of access to external resources – financial products and services and social capital – significantly decreased and while savings behaviours were up, the amount of savings people have to rely upon has gone down.

Economic resources: stayed the same overall but there are concerns about savings markers.

  • On average, adults in Australia were better able to access funds in an emergency in 2016 (77.6% in 2015 to 81.4% in 2016). But almost 1 in 5 still could not, or did not know if they could raise $2,000 in a week and this rate was worse than findings by the ABS in 2014 (when approximately 1 in 8 were not able to find money in an emergency).
  • Of those who reported they could raise $2,000 in an emergency, 70.7% would do so through family or friends demonstrating the importance of social capital.
  • While more people were saving in 2016 compared to 2015, less money was being saved relative to people’s income. Almost one in three (31.6%) adults had no savings or were just two pay packets (<1 month of savings) away from serious financial stress if they were to lose their jobs. Like in 2015, almost 1 in 2 reported having less than three months of income saved (46.6 and 45.5% respectively).

Financial products and services: access has gotten worse

  • People were more likely to report having no access to any form of credit in 2016 (25.6%) compared to 2015 (20.2%) and no form of insurance (11.8% in 2016 compared to 8.7% in 2015).
  • A higher proportion of people reported having access to credit through fringe providers in 2016 (5.4%) compared to 2015 (1.7%).
  • There were no differences in the reported level of unmet need for credit overall, between 2015 (3.8%) and 2016 (3.7%). However, 1 in 10 reported having an unmet need for more insurance (10.0% compared to 9.7% in 2015) and an additional 11.6% (compared to 6.4% in 2015) did not know if they needed more insurance.

Financial knowledge and behaviour: has improved

  • Adults in Australia reported having a higher level of both understanding of and confidence using financial products and services in 2016 than in 2015. In 2016, 5.5% reported having no confidence using financial products and services and 4.5% reported no understanding at all, compared to 8.2% and 9.2% respectively in 2015.
  • There was a positive change in the population’s reported approach to seeking financial advice, with more people reported seeking advice at the time of the survey (7.8% in 2016 compared to 4.8% in 2015).
  • More people reported saving regularly in 2016 (60.2%) compared to 2015 (56.4%).

Social capital: has decreased

  • Although social capital overall decreased between 2015 and 2016, more people reported having regular contact with their social connections (68% compared to 36.6%).
  • A lower proportion of the population reported needing community or government support in 2016.
  • However, the proportion of people reporting a need for support but no access to it grew from 3.2% in 2015 to 5.3% in 2016.

Who is doing better? Who is faring worse?

  • Income, educational attainment and employment were all positively associated with financial security
  • Established home owners were also more likely to be financially secure, while people living in very short-term rentals were more likely to be in severe financial stress.
  • Younger people under 35 years of age were less likely than other age groups to experience financial security.
  • A higher proportion of people born in a non-English speaking country were in the severe and high financial stress categories, than people born in an English-speaking country, including Australia.
  • Mental illness was also negatively correlated to financial security, with a higher proportion of people with a mental illness experiencing severe or high financial stress (44.7% compared to 9.3% of people with no mental illness).

The Centre for Social Impact (CSI) is a national research and education centre dedicated to catalysing social change for a better world. CSI is built on the foundation of three of Australia’s leading universities: UNSW Sydney, The University of Western Australia, and Swinburne University of Technology.

G20 Data Gaps Initiative – Real Estate Data Hole

Interesting speech from Prof Claudia Buch Vice-President of the Deutsche Bundesbank on “Data needs and statistics compilation for macroprudential analysis.” Availability of data on real estate markets does not match the importance of these markets for financial stability. The lack of data is profound.

Surveillance of risks to financial stability requires good data and information. The second phase of the G20 Data Gaps Initiative plays an important role for improvements in the statistical infrastructure. Apart from providing a conceptual framework for the collection of data, implementation of new concepts nationally and internationally will be crucial.

First, with its framework for the evaluation of financial sector reforms post-implementation, the FSB has started an ambitious project. The success of this project will depend crucially on the timely and comprehensive availability of granular data. Now is the time to start developing protocols defining how statistical and policy evaluation work can be integrated more closely.

The real estate sector plays an important role for the real economy and the financial system. Monitoring developments in real estate markets is, therefore, key to an early identification of vulnerabilities.

  • More than two-thirds of all Europeans own the homes they live in. Residential property typically forms the largest component of homeowners’ wealth.
  • The majority of households borrow to finance a home purchase. In many places, housing assets can be used as collateral to access funding.  Mortgage debt is thus the main financial liability of the household sector.
  • Mortgage loans are also a major asset of the financial system. In advanced economies, about 60 percent of banks’ total lending portfolios are held in the form of mortgage loans.

Given this large exposure of financial institutions, risks to financial stability can occur if a strong rise in house prices coincides with a strong expansion in mortgage loans and an easing of credit standards.

Risks can build up if market participants form overly positive expectations regarding future developments in debt sustainability. They may not give due consideration to the possibility that asset prices may fall and that interest rates may rise. If property prices subsequently decline, and if this is coupled with a simultaneous increase in default rates, banks may not be able to offset losses from mortgage lending.

The bursting of credit-driven real estate price booms does significant and long-lasting damage to the real economy.  A fall in house prices may also affect financial institutions more directly through their specific investments in residential real estate assets.

The availability of data on real estate markets does not match the importance of these markets for financial stability. The European Systemic Risk Board (ESRB 2016) has thus recommended “closing real estate data gaps”. Much work needs to be done to improve data on real estate in terms of coverage as well as of comparability across countries.

The lack of data is profound. For Germany, indicators are available only for (aggregated) prices and credits. Information on credit standards is insufficient for monitoring financial stability. Information is limited to the Eurosystem’s quarterly Bank Lending Survey (BLS). But this survey includes only qualitative information, and it is constrained to a sample of 139 large banks. As regards markets for commercial real estate, reliable indicators on both price and lending volumes are lacking.

The G20 Data Gaps Initiative aims at improving the availability of Residential Property Price Indices (RPPI) (IMF and FSB 2016). By the year 2021, G20 economies are to provide nationally available data on Commercial Property Price Indices to the BIS. In September 2016, the BIS had already published such data, including information on coverage and methodologies, for a number of countries.

Second, we have made much progress in the surveillance of non-bank finance or “shadow banking”. Assessing risks in this area requires drilling down further, using the infrastructure that we have in terms of data and methodologies. But it also requires further developing our analytical tools, especially in order to strengthen our understanding of shock transmission channels and the relevance of common exposures and inter-sectoral linkages for the latter, including those that extend across borders.

Third, international capital flows have many positive effects – but can also propagate shocks across borders. To address this concern, timely and granular data are needed for policy use. An improved sharing of and accessibility to sufficiently granular data is crucial for monitoring systemic risk. This implies the use of common identifiers in order to allow a better linking of different micro datasets and a more refined analysis of channels of propagation.

More On Household Debt, From The ABC

ABC’s RN Breakfast‘s Business Reporter Michael Janda discussed household debt as part of his segment on Radio National Breakfast this morning, and was kind enough to mention our recent research on owner occupied and investment housing debt sensitivity.

There was a subsequent flurry on Twitter discussing the DFA research approach.

To be clear, our household modelling is based on a rolling 26,000 statistically robust omnibus survey, to which each month we add 2,000 new households and drop off the oldest set. We have data from more than 10 years of research and it feeds our programme of activity and is reflected in the DFA blog.

From a mortgage stress perspective, we run our modelling, based on our household profiles and segments, which looks at net cash flow (before tax) and we also sensitive the modelling based on potential future rate movements. We take account of their total financial position, including other debt demands, and costs of living.

You can read more about our modelling here.  If you want to read our mortgage stress work, this overview is a great place to start.

P.S. Our research is separate and distinct from other research in the housing affordability arena, including the international Demographia survey. Whilst some of the findings may align, the research is based on different underlying research sources.


Job issues a drag on Aussie households

Income cuts, record-high job insecurity and high rates of underemployment are putting stress on households’ financial comfort, according to ME’s latest Household Financial Comfort Report.

The Report shows a marked long-term deterioration in Australian households’ ‘comfort with income’, which remains at its lowest level since the Report began in 2011, at 5.55 out of 10.


Record low income gains highlight widening gap between rich and poor

ME consulting economist and Report co-author, Jeff Oughton, said the reasons for income worries were clear.

“Only 32% of households reported ‘income gains’ over the past year – one of the lowest levels since the first survey in 2011 and down from the corresponding figure of 38% 12 months ago,” said Oughton.

Oughton said income gains were more likely to be reported by those with higher incomes and wealthier Australians.

Almost one in two (or 46%) of households with incomes over $100,000 reported ‘income gains’, compared to 17% of households earning under $40,000. Conversely, 41% of households earning less than $40,000 reported income losses, compared to only 13% of those earning over $100,000.

“The rich appear to be getting richer, while the rest of Australia is struggling – there’s a divide across households,” said Oughton.

Households earning an annual income above $200,000 reported very high overall financial comfort of 7.10 out of 10 in December, compared with ME’s overall household financial comfort index (5.41 out of 10).

“We’re seeing a shift in the composition of jobs as the economy moves away from mining and manufacturing with many employees leaving longer-term jobs and taking up lower-paying less-permanent jobs, which is having a negative impact on their financial comfort,” said Oughton.

ABS data shows wage growth at historical lows over the past two years to the September quarter. ME’s Report supports this, highlighting low wage growth continued in the whole of 2016 and is causing financial discomfort for many households, exacerbated by job insecurity and underemployment.”


Job insecurity and underemployment

In addition to income cuts, high levels of underemployment and record high ‘job insecurity’ were also contributing to households’ historically low comfort with income.

“One in three Australian households (34%) reported ‘job insecurity’ – a record high and an increase of 9 points over the year to December 2016,” said Oughton.

“Furthermore, 56% of households felt that they would ‘struggle to find a new job within two months if they became unemployed’, an increase of 3 points over the past year, while only 37% said it would be ‘easy to find a job’, down 3 points in the past 12 months.”

“Despite Australia’s relatively low official unemployment rate of 5.8% in December 2016, ME’s Report shows 60% of part-time employees would like to ‘increase the hours they work’ and 70% of casual workers want to ‘change from casual to permanent employment’,” said Oughton.


Tighter purse strings

The proportion of households saving increased 3 points to 51%, with these households saving an extra $58 each month on average.

“Arguably reflecting tougher labour market conditions outweighing the impact of rising (net) wealth, households tightened their purse strings over the six months to December, saving more where they could and overspending less.

“It’s an increased conservatism that will be contributing to a drag on growth as Australia’s economic transition continues,” said Oughton.

Meanwhile, those households ‘spending more than they earn each month’ (9% of households) also cut back, reducing their overspending by an average of $55 less each month. Consistent with these findings, overall household comfort with cash savings rose by 3% to 4.94 out of 10 in the latest Report.


Other findings:

‘Single parents’ doing it the toughest: ‘Single parents’ reported the lowest levels of financial comfort the Report has seen (4.34 out of 10) – a 3% decrease in the six months to December 2016.

‘Gen X’ down in the dumps: ‘Gen X’s’ financial comfort decreased by 5% to the lowest level on record (4.92 out of 10), reflecting lower comfort across all key drivers with the biggest falls in comfort around debt (down 8% to 5.21) and incomes (down 6% to 5.19).

‘Retirees’’ financial comfort on the up: ‘Retirees’’ household financial comfort rose by 8% to 6.23 out of 10. Likely due to current majority of retirees not being faced with pending superannuation and pension changes, and having ridden the continued wave of growth in the property market and renewed strength in equity markets. Retirees’ ‘comfort with both their investments and wealth’ rose by 11% in the last six months, and their ‘ability to cope with a financial emergency’ is the highest of all household cohorts.

WA rebounds, at least temporarily: Financial comfort in WA increased by 6% to 5.34 out of 10, reversing the record low results seen in the previous Report (5.02 out of 10). Many key drivers of financial comfort rose, with double-digit gains in ‘investments’ and ‘cash savings’.

South Australians feeling the pinch: South Australians experienced an 8% decrease in financial comfort during the six months to December 2016. Many key drivers of financial comfort fell, with recent adverse weather and energy disruptions potentially weighing, at least temporarily, negatively on household comfort.

The Case For “Inclusive Growth”

From the IMF Blog.

Four years ago, at the World Economic Forum in Davos, IMF Managing Director Christine Lagarde warned of the dangers of rising inequality, a topic that has now risen to the very top of the global policy agenda.

While the IMF’s work on inequality has attracted the most attention, it is one of several new areas into which the institution has branched out in recent years. A unifying framework for all this work can be summarized in two words: Inclusive growth

We want growth, but we also want to make sure:

  • that people have jobs—this is the basis for people to feel included in society and to have a sense of dignity;
  • that women and men have equal opportunities to participate in the economy—hence our focus on gender;
  • that the poor and the middle class share in the prosperity of a country—hence the work on inequality and shared prosperity;
  • that, as happens, for instance when countries discover natural resources, wealth is not captured by a few—this is why we worry about corruption and governance;
  • that there is financial inclusion—which makes a difference in investment, food security and health outcomes; and
  • that growth is shared just not among this generation but with future generations—hence our work on building resilience to climate change and natural disasters.

In short, a common thread through all our initiatives is that they seek to promote inclusion—an opportunity for everyone to make a better life for themselves.

These are not just fancy words; a click on any of the links above shows how the IMF is making work on inclusion a part of its daily operations.

Inclusion is important, but so of course is growth. “A larger slice of the pie for everyone calls for a bigger pie” (Lipton, 2016). So when we push for inclusive growth, we are not advocating as role models either the former Soviet Union or present day North Korea—those are examples of ‘inclusive misery,’ not inclusive growth. Understanding the sources of productivity and long-run growth—and the structural policies needed to deliver growth—thus remains an important part of the IMF’s agenda.

Globalization and inclusion

The IMF was set up to foster international cooperation. Hence, to us, inclusion refers not just to the sharing of prosperity within a country, but to the sharing of prosperity among all the countries of the world. International trade, capital flows, and migration are the channels through which this can come about. This is why we stand firmly in favor of globalization, while recognizing that there is discontent with some of its effects and that much more could be done to share the prosperity it generates.

Higher growth should help address some of the discontent, as argued by Harvard economist Benjamin Friedman in his book, The Moral Consequences of Economic Growth. Friedman shows that, over the long sweep of history, strong growth by “the broad bulk” of a society’s citizens is associated with greater tolerance in attitudes towards immigrants, better provision for the disadvantaged in society, and strengthening of democratic institutions.

However, designing policies so they deliver inclusive growth in the first place will be a more durable response than leaving matters to the trickle-down effects of growth.

Policies for inclusive growth

♦  Trampolines and safety nets: “More inclusive economic growth demands policies that address the needs of those who lose out … Otherwise our political problems will only deepen” (Lipton, 2016). Trampoline policies such as job counseling and retraining allow workers to bounce back from job loss: they help people adjust faster when economic shocks occur, reduce long unemployment spells and hence keep the skills of workers from depreciating. While such programs which already exist in many advanced economies, they deserve further study so that all can benefit from best practice. Safety net programs have a role to play too. Governments can offer wage insurance for workers displaced into lower-paying jobs and offer employers wage subsidies for hiring displaced workers. Programs such as the U.S. earned income tax credit should be extended to further narrow income gaps while encouraging people to work (Obstfeld, 2016).

♦  Broader sharing of the benefits of the financial sector and financial globalization: We need “a financial system that is both more ethical and oriented more to the needs of the real economy—a financial system that serves society and not the other way round” (Lagarde, 2015). Policies that broaden access to finance for the poor and middle class are needed to help them garner the benefits of foreign flows of capital. Increased capital mobility across borders has often fueled international tax competition and deprived governments of revenues (a “race to the bottom leaves everyone at the bottom,” (Lagarde, 2014). The lower revenue makes it harder for governments to finance trampoline policies and safety nets without inordinately high taxes on labor or regressive consumption taxes. Hence, we need international coordination against tax avoidance to prevent the bulk of globalization gains from accruing disproportionately to capital (Obstfeld, 2016).

♦  ‘Pre-distribution’ and redistribution: Over the long haul, polices that improve access to good education and health care for all classes of society are needed to provide better equality of opportunity. However, this is neither very easy nor an overnight fix. Hence, in the short run, ‘pre-distribution’ policies need to be complemented by redistribution: “more progressive tax and transfer policies must play a role in spreading globalization’s economic benefits more broadly” (Obstfeld, 2016).

A Cumulative View Of Mortgage Rate Sensitivity

We had significant interest in our recent posts on mortgage rate sensitivity in a rising market. One recurring request was for a cumulative view of rate sensitivity. So today we post these views on a segmented basis, using our master household segmentation.

A quick recap, we updated our analysis of how sensitive households with an owner occupied mortgage are to an interest rate rise, using data from our household surveys. This is important because we now expect mortgage rates to rise over the next few months, as higher funding costs and competitive dynamics come into pay, and as regulators bear down on lending standards.

To complete this analysis we examine how much headroom households have to rising rates, taking account of their income, size of mortgage, whether they have paid ahead, and other financial commitments. We then run scenarios across the data, until they trip the mortgage stress threshold.

At this level, they will be in difficulty.  The chart shows the relative distribution of borrowing households, by number. So, around 20% would have difficulty with even a rise of less than 0.5%, whilst an additional 4% would be troubled by a rise between 0.5% and 1%, and so on. Around 35% could cope with even a full 7% rise.

The chart below shows a segment view of this sensitivity. We add the score for each interest rate band. Young Affluent households are most sensitive to rate rises, thanks to large mortgages and static incomes. Young Growing Families are not far behind, but their household budgets are quite different. Other segments are more resilient, though a proportion of Exclusive Professionals are also highly leveraged. This first view takes account only of the owner occupied mortgages.

We can also overlay investment mortgages, and this changes the picture somewhat, when combined with owner occupied statistics. We see that the extra commitments have lifted the rate sensitivity, for example moving Exclusive Professionals from 36% to 54% exposed to a small rate increase.

Overall we see that some households really have very little headroom to cope with rising rates, a symptom of high household indebtedness.  Others are well protected and are also paying ahead.

New Banking Model For Latrobe Valley

Nab says Latrobe Valley residents will for the first time have access to a unique model of financial services – with plans for Victoria’s fourth Good Money store to open in Morwell next year.

A partnership between the Victorian Government, Good Shepherd Microfinance and the National Australia Bank (NAB), Good Money stores offer responsible financial products and services including no interest and low interest loans, financial counselling and affordable insurance.

The Minister for Families and Children, the Honourable Jenny Mikakos MP, said that the Latrobe Valley Good Money store would also be the first to offer in-house financial counselling services.

“We’re working to make sure that local people have improved access to appropriate and affordable financial services and products now and into the future,” said Minister Mikakos.

“Importantly, this will be the first Good Money store in regional Victoria and it will have a financial counsellor on site providing free support, information and advocacy for people who are experiencing financial difficulty,” she said.

The Victorian Government is investing $2.9 million to establish and operate the store over four years. Good Money will initially provide services from the Latrobe Valley Authority site in Morwell until the store opens in May 2017.

Chief Executive Officer of Good Shepherd Microfinance, Adam Mooney, said that the Victorian Government investment in the new Good Money store was an important step in helping to secure the economic future of the Latrobe Valley.

“Over the coming years, Good Money will enable people in the Latrobe Valley to keep their cars on the road, meet the costs associated with education and retraining, and afford the things that keep families running like washing machines and fridges,” said Mr Mooney.

“There is high demand for safe, fair and affordable finance options in many parts of regional Victoria and we’re delighted to open a Good Money store here in Morwell. This store will provide valuable services to individuals and families who are excluded from mainstream finance in the Latrobe Valley region,” said Mr Mooney.

NAB General Manager of Retail (Victoria), Mary Scoutas, said the announcement is part of NAB and Good Shepherd Microfinance’s joint commitment to provide more than one million people on low incomes with access to fair and affordable finance by 2018.

“We know there is a real need for initiatives such as this within the community to help build resilience and reduce the risk of falling into a situation of long-term financial hardship,” said Ms Scoutas.

“The Latrobe Valley Good Money store meets the evolving needs of the local community, extends the Good Money franchise to regional Victoria for the first time and builds on our growing network of stores, with three in Melbourne, one in South Australia and another two set to open in Queensland next year.”

The products and services offered through Good Money include:

  • No Interest Loan Scheme (NILS) – Loans of between $300 and $1,200 for essential goods and services, including educations costs and equipment needed for training.
  • StepUP Loan – Loans of between $800 and $3,000, typically used for car related expenses, that keep people on the road and enable them to get to work, get the kids to school and stay engaged with their community.
  • Affordable insurance – simple car and contents insurance with flexible payment options.
  • Financial counselling – free, confidential and independent debt management and budgeting advice.

The partnership between Good Shepherd Microfinance and NAB has reached almost half a million people in Australia with no and low interest loans since 2005.

Background

The Victorian Government provides operational funding for three Good Money community finance stores in Collingwood, Dandenong and Geelong, with microfinance loan capital provided by NAB. In 2015 Good Money expanded to South Australia and, in 2017, two stores will open in the Queensland. Good Money is a three-way partnership between Good Shepherd Microfinance, NAB and state governments.