Liar Loans and Household Finances – Property Imperative Weekly 16th Sept 2017

Risks in the property sector continue to rise, as we look at new data on household finances, the competitive landscape in banking and liar loans. Welcome to the Property Imperative to 16th September 2017.

We start our weekly digest looking at the latest data on the state of household finances. Watch the video, or read the transcript.

The Centre for Social Impact, in partnership with NAB released Financial Resilience in Australia 2016. This shows that while people are more financially aware, savings are shrinking and economic vulnerability is on the rise. In 2016, 2.4 million adults were financially vulnerable and there was a significant decrease in the proportion who were financially secure (35.7% to 31.2%). People were more likely to report having no access to any form of credit in 2016 (25.6%) compared to 2015 (20.2%) and no form of insurance (11.8% in 2016 compared to 8.7% in 2015). A higher proportion of people reported having access to credit through fringe providers in 2016 (5.4%) compared to 2015 (1.7%).

The ABS published their Survey of Household Income and Wealth. More than half the money Australian households spend on goods and services per week goes on basics – on average, $846 out of $1,425 spent. Housing costs have accelerated significantly. The data shows that more households now have a mortgage, while fewer are mortgage free. Rental rates remain reasonably stable, despite a rise in private landlords.

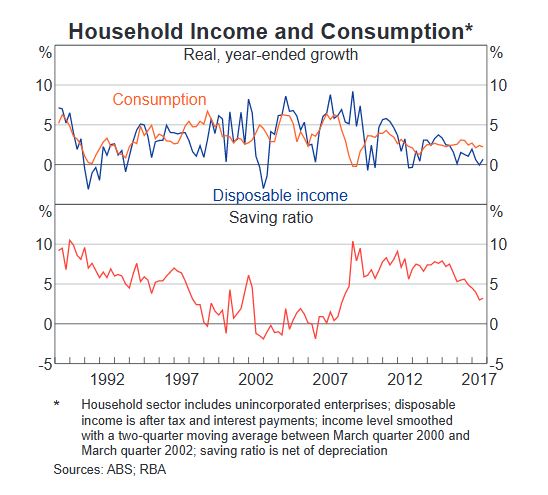
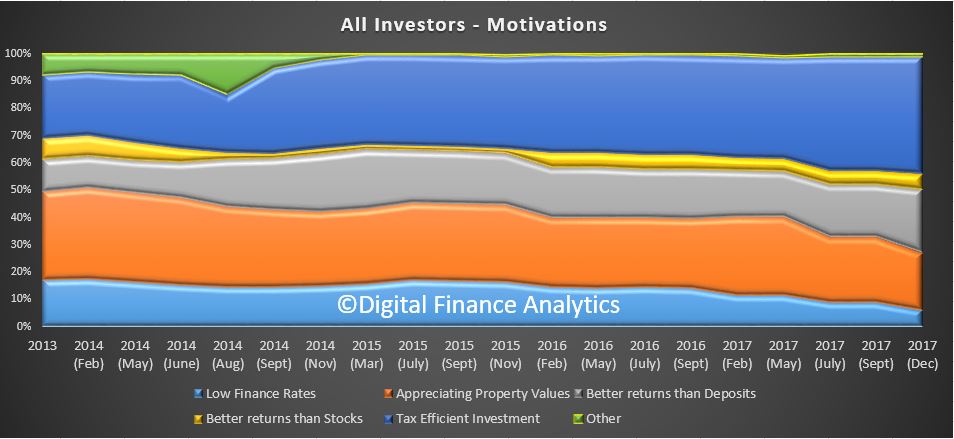
We published our Household Finance Confidence Index for August, which uses data from our 52,000 household surveys and Core Market Model to examine trends over time. Overall, households scored 98.6, compared with 99.3 last month, and this continues the drift below the neutral measure of 100. Younger households are overall less confident about their financial status, whilst those in the 50-60 year age bands are most confident. This is directly linked to the financial assets held, including property and other investments, and relative incomes. For the first time in more than a year, households in Victoria are more confident than those in NSW, while there was little relative change across the other states. One of the main reasons for the change is state of the Investment Property sector, where we see a significant fall in the number of households intending to purchase in NSW, and more intending to sell. One significant observation is the rising number of investors selling in Sydney to lock in capital growth, and seeking to buy in regional areas or interstate. Adelaide is a particular area of interest.

There was more mixed economic news this week, with the trend unemployment rate in Australia remaining at 5.6 per cent in August and the labour force participation rate rising to 65.2 per cent, the highest it has been since April 2012. However, the quarterly trend underemployment rate remained steady at 8.7 per cent over the quarter, but still at a historical high, for the third consecutive quarter. Full-time employment grew by a further 22,000 in August and part-time employment increased by 6,000.

The RBA published a discussion paper The Property Ladder after the Financial Crisis: The First Step is a Stretch but Those Who Make It Are Doing OK”. Good on the RBA for looking at this important topic. But we do have some concerns about the relevance of their approach. They highlight the rise of those renting, and attribute this largely to rising home prices. As a piece of research, it is interesting, but as it stops in 2014, does not tell us that much about the current state of play! A few points to note. First, the RBA paper uses HILDA data to 2014, so it cannot take account of more recent developments in the market – since then, incomes have been compressed, mortgage rates have been cut, and home prices have risen strongly in most states, so the paper may be of academic interest, but it may not represent the current state of play.   Very recently, First Time Buyers appear to be more active. More first time buyers are getting help from parent, and their loan to income ratios are extended, according to our own research. Also, they had to impute those who are first time buyers from the data, as HILDA does not identify them specifically.  Tricky!

ANZ has updated its national housing price forecast. They think nationwide prices will finish the year 5.8% higher, though prices are now 9.7% higher than a year ago. They attribute much of the slow-down in home price growth to retreating property investors. They also think Melbourne will be more resilient than Sydney.

Banks have been putting more attractor rates into the market to chase low risk mortgage loan growth this week.  CBA advised brokers that the bank is offering a $1,250 rebate for “new external refinance investment and owner-occupied principal and interest home loans” and some rate cuts.  ANZ increased its fixed rate two-year investor loans (with principal and interest repayments) by 31 basis points to 4.34 per cent p.a., while its two-year fixed resident investor loan with an interest-only repayment structure fell by 10 basis points to 4.64 per cent p.a. Suncorp also reduced fixed rates on its two and three-year investment home package plus loans by 20 and 30 basis points, respectively. The new rate for both is 4.29 per cent p.a., provided that the loan is for more than $150,000 and the loan to value ratio (LVR) is less than 90 per cent. MyState Bank has announced a decrease in its two-year fixed home loan rates for new, owner-occupied home loans with an LVR equal to or below 80%, effective immediately. Data from AFG highlights that the majors are reasserting their grip on the mortgage market – so much for macroprudential.

A UBS Report on “liar loans” grabbed the headlines. It is based on an online survey of 907 individuals who had taken out mortgages in the last 12 months and claimed 1/3 of mortgage applications (around $500 billion) were not entirely accurate. Understating living costs was the most significant misrepresentation, plus overstating income, especially loans via brokers. ANZ was singled out by UBS for an alleged high proportion of incorrect loans. Of course the industry rejected the analysis, but we have been watching the continued switching between owner occupied and investor loans – $1.4 billion last month, and more than $56 billion – 10% of the investor loan book over the past few months. This has, we think been driven by the lower interest rates on offer for owner occupied loans, compared with investor loans. But, we wondered if there was “flexibility with the truth” being exercised to get these cheaper loans. So UBS may have a point.  They conclude “while household debt levels, elevated house prices and subdued income growth are well known, these finding suggest mortgagors are more stretched than the banks believe, implying losses in a downturn could be larger than the banks anticipate”. Exactly.

The Treasury released their Affordable Housing draft legislation, which proposes an additional 10% Capital Gains Tax (CGT) benefit for investors who provide affordable housing via a recognised community housing entity. It also allows investment for affordable housing to be made via Managed Investment Trusts (MIT). The focus is to extend market mechanisms to get investors to put money into schemes designed to provide more rental accommodation via community housing projects. Whilst the aims are laudable, and the Government can say they are “Addressing Affordable Housing”, the impact we think will be limited.

APRA’s submission to the Productive Commissions review on Competition in the Australian Financial System review discusses the trade-off between financial stability and competition. They compared the banks’ cost income ratios in Australia with overseas, and suggests we have more efficient banks here – but they fail to compare relative net income ratios and overall returns – which are higher here thanks to a weaker competitive environment. They conclude that whilst some competition is good, too much risks financial stability.

The House of Representatives Standing Committee on Economics heard from the regulators this week. The focus was the banks’ out of cycle mortgage rate price hikes. Some of the banks have attributed the rise in rates to the regulatory changes but are they profiteering from the announcement? ASIC said the issue was whether the public justification for the interest rate rise was actually inaccurate and perhaps false and misleading, and therefore in breach of the ASIC Act. ASIC is currently “looking at this issue” and will be working with the ACCC, which has been given a specific brief by Treasury to investigate the factors that have contributed to the recent interest rate setting.

APRA was asked if lenders’ back book IO repricing practices were “actually opportunistic changes” that had effectively used the APRA speed limits as excuses to garner profit. Deflecting the question, APRA said it would wait to see what came out of inquiries by the ACCC and ASIC, but it was not to blame for any rate hikes, saying “a direct assertion that we made them put up interest rates is clearly not true”.

We think at very least the banks were given an alibi for their rate hikes, which have certainly improved margins significantly.

Finally, the ABS Data on Lending Finance to end July highlighted the rise in commercial lending, other than for investment home investment, was up 2%, while lending for property investment fell as a proportion of all lending, and of lending for residential housing. This included significant falls in NSW, further evidence property investors may be changing their tune.

So, finally some green shoots of business investment perhaps. We really need this to come on strong to drive the growth we need to stimulate wages. The upswing is there, but quite small, so we need to watch the trajectory over the next few months.  Overall lending grew 0.64% in the month, (which would be 7.8% on an annualised basis), way stronger than wages or cpi. So household debt will continue to rise, relative to income, so risks in the property sector continue to grow.

And that’s the Property Imperative to 16th September 2017. If you found this useful, do subscribe to get future updates and thanks for watching.

The ANZ has upped its national housing price forecasts

From Business Insider Australia.

ANZ Bank analysts have increased their forecasts for property price growth in Australia.

“Given Melbourne’s recent resilience, we have nudged our 2017 price forecasts higher, and now expect nationwide prices will finish the year 5.8% higher,” write economists Daniel Gradwell and Joanne Masters.

However, they see further evidence that the housing market is cooling.

“Weaker auction results point toward slow price growth through the rest of 2017, while tighter borrowing conditions and higher interest rates for investors are also likely to weigh on price growth in 2018,” they say.

At the national level, dwelling price growth has slowed over the past three months.

Prices are now 9.7% higher than a year ago, down from the peak of 11.4% in May.

Here are the ANZ’s forecasts:

Source: ANZ Bank

“Much of this slowdown appears to be caused by a retreating investor presence in the market, in line with recent regulatory changes,” they say.

APRA’s further crackdown aimed at investor borrowing, particularly those with interest-only loans, has seen the investor share of total borrowing steadily decline.

“In turn, price growth has slowed across most capital cities and regional areas and across detached houses and the unit/apartment market,” say Gradwell and Masters.

“Having said that, the Melbourne market has recently been more resilient than the Sydney market, perhaps reflecting an element of catch-up after Sydney outperformed in previous years.”

The economists note there is no suggestion that prices will fall outright only that price growth will slow.

“Melbourne and Sydney will continue to be the main drivers of this growth, in line with their expanding populations,” they write.

“Strong additions to supply are expected to keep a lid on Brisbane’s prices, while Perth and Darwin are likely to have another year of weakness, as their mining boom adjustment winds up.”

Rates Lower For Longer – The Property Imperative Weekly – 02 Sept 2017

New data out this week gives an updated read on the state of the property and finance market. We consider the evidence. Welcome to the Property Imperative Weekly to 2nd September 2017.

Starting overseas, we saw lower than expected job growth in the USA, and also lower than expected inflation. Overall, the momentum in the US economy still appears fragile, and this has led to the view that the Fed will hold interest rates lower for longer. As a result, the stock market has been stronger, whilst forward indicators of future interest rates are lower. In fact, half of the jump caused by the Trump Effect last November has been given back. In Europe, the ECB said there would be no tapering until later, again suggesting lower rates for longer.

This change in the international rate dynamics is relevant to the local market, because it means that international funding costs will be lower than expected, and so banks have the capacity to offer attractor rates without killing their margins.  The larger players still have around one third of their funding from overseas sources and so are directly connected to these international developments.

Westpac for example decreased rates on its Fixed Rate Home and Investment Property Loans with IO repayments by as much as 30 basis points. This sets the new fixed rates for owner occupiers between 4.59% p.a. and 4.99% p.a. while rates for investors lie between 4.79% p.a. and 5.19% p.a. They also brought in a two-year introductory offer on its Flexi First Option Home and Investment Property Loan for new borrowers. After two years, the loan will roll over to the base rate which may be more than 70 basis points higher. This may create risks down the track.

Mozo the mortgage comparison site said that twenty-three lenders have dropped their home loan rates since 1 July, showing that competition for good-quality borrowers is hotting up in the lead up to spring, with lenders offering lower interest rates, fee waivers, or lower deposits for favoured customers. Mozo’s research found the most competitive variable rate in the market for a $300,000 owner-occupier loan is 3.44 per cent, which is 120 basis points lower than the average Big 4 bank variable rate.  Borrowers should shop around.

Elsewhere, Heritage Bank, Australia’s largest customer-owned bank, said it had temporarily stopped accepting new applications for investment home loans, to ensure they comply with regulatory limitations on growth. They have experienced a sharp increase in the proportion of investment lending in their new approvals recently, partly due to the actions other lenders in the investor market have taken to slow their growth.

APRA’s monthly data for July revealed a significant slowing in the momentum of mortgage lending.  Bank’s mortgage portfolios grew by 0.4% in July to $1.58 trillion, the slowest rate for several months. This, on an annualised basis would still be twice the rate of inflation. Investment loans now comprise 35.08% of the portfolio, down a little, but still a significant market segment.

Owner occupied loans grew 0.5% to $1.02 trillion while investment loans hardly grew at all to $552.7 billion, the slowest growth in investment loans for several years. So the brakes are being applied in response to the regulators, although individual lenders are showing different outcomes.

The ABA released a report showing that Less than one third of those surveyed had high levels of trust in the banking industry. This is below the international benchmark. There are significant differences in attitude between those who have higher levels of trust, and those who do not. Those with low trust scores believed the banks were drive by profit, not focussed on customer needs and had terms and conditions which are not transparent.

APRA also released their Quarterly ADI Real Estate and Performance reports to June 2017.  Overall, major banks are highly leveraged, and more profitable. Net profit across the sector, after tax was $34.2 billion for the year ending 30 June 2017, an increase of $6.5 billion (23.5 per cent) on 2016. Provision were lower, with impaired facilities and past due items at 0.88 per cent at 30 June 2017, a decrease from 0.94 per cent at 30 June 2016. The return on equity was 12.0 per cent for the year ending 30 June 2017, compared to 10.3 per cent for the year ending 30 June 2016. Looking at the four major banks, where the bulk of assets reside, we see that the ratio of share capital to assets is just 5.4%, this despite a rise in tier 1 capital and CET1. This is explained by the greater exposure to housing loans where capital ratios are still very generous, one reason why the banks love home lending. Thus the big four remain highly leveraged.

The APRA Real Estate data shows ADIs’ residential mortgage books stood at $1.54 trillion as at 30 June 2017, an increase of $105.2 billion (7.3 per cent) on 30 June 2016. Owner-occupied loans were $1,006.2 billion (65.3 per cent), an increase of $75.8 billion (8.1 per cent) from 30 June 2016; and investor loans were $535.7 billion (34.7 per cent), an increase of $29.4 billion (5.8 per cent) from 30 June 2016. Whilst APRA use a different and private measure of interest only loans, their data showed a significant fall this quarter, although the proportion of new IO loans is still above their 30% threshold.  High LVR lending was down again, although there was a rise in loans approved outside standard approval criteria. Loans originated via brokers remained strong, with 70% of loans to foreign banks via this channel, whilst the major banks were at 48%.

Separately the RBA released their credit aggregates for July. Overall credit rose by 0.5% in the month, or 5.3% annualised. Within that housing lending grew at 0.5% (annualised 6.6% – well above inflation), other Personal credit fell again, down 0.1% (annualised -1.4%) and business credit rose 0.5% (annualised 4.2%). Home lending reached a new high at $1.689 trillion. Within that owner occupied lending rose $7 billion to $1.10 trillion (up 0.48%) and investor lending rose just $0.09 billion or 0.15% to $583 billion.  Investor mortgages, as a proportion of all mortgages fell slightly. A further $1.4 billion of loan reclassification between investment and owner occupied loans occurred in July 2017, in total $56 billion has been switched, so the trend continues.

Building Approvals for July rose 0.7% according to the ABS, in trend terms, approvals for private sector houses rose 1.0 per cent in July, whilst approvals for multi-unit projects continues to slide. This may well adversely hit the GDP figures out soon.  New home sales also declined in July according to the HIA. Sales volumes declined by 3.7 per cent during July 2017 compared with June 2017. Sales for the first seven months of this year are 4.6 per cent lower than in the same period of 2016.

The debate about mortgage broker commissions continues, with a joint submission from four consumer groups to Treasury arguing that brokers don’t always obtain better priced loans for clients than the banks and they don’t always offer a diverse range of loan options.  They suggested that given the trust consumers place in brokers, they should all be held to a higher standard than arranging a ‘not unsuitable’ loan for their customers. They should be required to act in the best interests of their customers. Most industry players argue for minor tweaks or retaining the current structure, arguing that first time buyers may be hit, and that the current commissions do not degrade the quality of advice. CBA apologised to Brokers this week. Ian Narev, the outgoing chief executive officer of the Commonwealth Bank, has apologised to brokers for some of the “uncertainties” it has caused. He said the bank was very committed to the broker channel, as the Aussie transaction shows.  He acknowledged that while the bank has “never shied away” from wanting to do its own business through its branches and direct channels, using a broker was “good for customers”.

CBA was of course in the news for all the wrong reasons, with APRA saying it would look at the culture of the Bank, following the money laundering claims. The investigation will be run by an independent panel, appointed by APRA for six months after which the regulator will receive a final report, to be made public. Of note is their perspective that capital security is not sufficient to guarantee the long term security of the financial system, – culture and accountability are critical too. Of course the big question will be – is CBA an outlier?  Does this also provide more weight to calls for a broader Royal Commission? The bank may also face big penalties if international regulators are forced to act over its breaches of rules around money laundering and terrorism financing. Moody’s says this is credit negative and could damage the bank’s reputation as well as compel it to incur costs and use resources to address any mandated remedial actions

CoreLogic’s revised home price index for August report a 0.1% rise across the capital cities, while regional values fell 0.2%. This was the lowest rolling quarterly gain since June last year. Sydney’s rolling 3-month gain was just 0.3%, with a 13% annual rise. Melbourne was 1.9% in the quarter with 12.7% over the year and Hobart led the pack at 13.6%. Perth and Darwin continue to fall. So the question now is, will the spring surge in sales, and lower mortgage rates support prices, or will we see a fall in the next few months?  Auction clearances remain quite strong.

It is worth saying that the strong growth in Australian home prices is nothing unusual as the latest data from the Bank For International Settlements shows.  Hong Kong has the strongest growth, and New Zealand and Canada are both well ahead of Australia.  We track quite closely with the USA. Spain sits at the bottom of the selected series. The year on year change shows that Australian residential prices are accelerating, whilst the macroprudential measures deployed in New Zealand is slowing growth there. Iceland, Canada and Hong Kong are all accelerating.

So, standing back we see demand for property remaining strong, even if supply of new property is on the slide. Banks are still willing to lend, but are more selective, meaning that some borrowers will find it hard to get a loan, while others will be greeted with open arms and discounts. Banks have the benefits of falling international funding costs and the war chests created by regulator inspired hikes in investor and interest only loans. So we think home prices will continue to find support, and lending will continue to grow overall, even if the mix changes. In addition, we have revised down our expectation of future mortgage rate rises, leading to an estimated fall in the number of defaults, despite the fact that more households are in mortgage stress. We published our updated figures for August on Monday, so look out for that.

And that’s the Property Imperative Weekly to 2nd September 2017. If you found this useful, do subscribe to get future updates and check back for our latest news and analysis on the finance and property market. Thanks for watching.

Are Sydney Home Prices Leading The Turn?

Corelogic has released their new hedonic home value index for August. They report a 0.1% rise across the capital cities, while regional values fell 0.2%.

This was the lowest rolling quarterly gain since June last year. Sydney’s rolling 3 month gain was just 0.3%, with a 13% annual rise. Melbourne was 1.9% in the quarter with 12.7% over the year and Hobart led the pack at 13.6%. Perth and Darwin continue to fall.

So the question now is, will the spring surge in sales, and lower mortgage rates support prices, or will we see a fall in the next few months? One other question of course is whether there are series breaks in the CoreLogic data given the revised method. We shall see in the months ahead.

CoreLogic says:

The hedonic imputation approach  – Hedonic regression is a statistical technique that measures the relationship between values of residential real estate and the observed values of its characteristics, for example attributes that encompass its geographic location and property features, such as number of bedrooms and bathrooms etc. The hedonic imputation index model essentially estimates the value of every property each day, using the coefficients derived using hedonic regression, and describes the daily movements in the value of the residential real estate portfolio.

They describe the methodology here. 


Australia’s Home Price Growth Nothing Special

The latest data from the BIS, which tracks residential property price growth has been released. It shows that home price inflation is widespread across many countries, and in that context, Australia (average 8 capital cities) is nothing special, we are in the middle of the pack.

Base-lined in 2010, this data series is the most comprehensive available, though with all the issues of matching data from multiple sources and translating it to a common basis. In most cases, this series covers all types of dwellings in markets for both new and existing dwellings in the country as a whole.

Hong Kong has the strongest growth, and New Zealand and Canada are both well ahead of Australia.  We track quite closely with the USA. Spain sits at the bottom of the selected series.

We can also look at the change YOY, which shows that Australian residential prices are accelerating, whilst the macroprudential measures deployed in New Zealand is slowing growth there. Iceland, Canada and Hong Kong are all accelerating.

Two observations. First home price growth is not just a local issue – as we discussed recently there are a range of complex factors driving asset prices higher.

Second, whilst we are in middle of the pack in terms of home price growth, our total debt burden is much higher, we are near the top of the pack on this measure. Once again driven by a complex range of interrelated factors.

How governments have widened the gap between generations in home ownership

From The Conversation.

Various government policies have fuelled the demand for housing over time, expanding the wealth of older home owners and pushing it further and further beyond the reach of young would-be home buyers. A new study highlights this divide between millennials and their boomer parents.

The study is part of a Committee of Economic Development of Australia (CEDA) report called Housing Australia. It compares trends in property ownership across age groups over a period of three decades.

Between 1982 and 2013, the share of home owners among 25-34 year olds shrunk the most, by more than 20%. On the other hand, the share of home owners among those aged 65+ years has risen slightly.

The rate of renting has spiralled among young people. By 2013, renting had outstripped home ownership among 25-34 year olds.

Same policies, different impacts on generations

There is undoubtedly a growing intergenerational divide in access to the housing market. The timing of policy reforms has been a major driver of this widening housing wealth gap.

Negative gearing has long advantaged property investors, potentially crowding out aspiring first home buyers. While negative gearing was briefly quarantined in 1985, this was repealed after just two years.

The appeal of negative gearing grew as financial deregulation spread rapidly during the 70s and 80s. This deregulation widened access to mortgage finance, but also pushed real property prices to ever higher levels.

In 1999, the Ralph review paved the way for the reform of capital gains tax on investment properties. Instead of taxing real capital gains at investors’ marginal income tax rates, only 50% of capital gains were taxed from 1999 onwards, albeit at nominal values.

The move, designed to promote investment activity, actually aggravated housing market volatility. The confluence of negative gearing benefits and the capital gains tax discount encouraged investors to go into more debt to finance buying property, taxed at discounted rates. The First Home Owners Grant, introduced in 2000, was another lever that increased demand. In the face of land supply constraints, these sorts of subsidies were likely to result in rising house prices.

Other policy reforms, while not directly housing related, have also affected young people’s opportunities to accumulate wealth.

The Higher Education Contribution Scheme (HECS) was introduced in 1989, at a time when many Gen X’s were entering tertiary education. This ended access to the free education that their boomer parents enjoyed.

HECS parameters were tightened over time. And in 1997, HECS contribution rates rose for new students and repayment thresholds were reduced.

Of course, the 1992 introduction of the superannuation guarantee would have boosted Gen X’s retirement savings relative to boomers. However, these savings are not accessible till the compulsory preservation age, so can’t be used now to buy a house.

All these policies have clearly had varying generational impacts, adversely affecting home purchase opportunities for younger generations while delivering significant wealth expansion to older home owners.

An intergenerational housing policy lens

A new housing landscape has emerged in recent years. It is marked by precarious home ownership and long-term renting for young people.

It’s also dominated by a growing wealth chasm – not just between the young and old – but also between young people who have access to wealth transfers from affluent parents and those who do not.

The majority of housing related policies do not consider issues of equity across generations. There are currently very few examples of potential housing reforms that can benefit multiple generations.

However, there is one policy that could – the abolition of stamp duties. It would remove a significant barrier to downsizing by seniors.

The equity released from downsizing would boost retirement incomes for seniors, while freeing up more housing space for young growing families. Negative impacts on revenue flowing to government could be mitigated by a simultaneous implementation of a broad based land tax. This would in turn push down house prices.

As life expectancies increase, the need for governments to take into account policy impact on different generations is critical. On the other hand, policies that take a short-term view will only worsen intergenerational tensions and entrench property ownership as a marker of distinction between the “haves” and “have nots” in Australia.

Author: Rachel Ong, Deputy Director, Bankwest Curtin Economics Centre, Curtin University

House of Cards

From The IMFBlog.

In some countries, owning a home is a rite of passage: a symbol of a stable life and a sound investment.

However young adults in the United Kingdom, United States, and Europe have experienced declining home ownership rates.

Our chart of the week, drawn from research by Lisa Dettling and Joanne W. Hsu, senior economists at the US Federal Reserve, in the June issue of Finance & Development magazine , shows that millennial home ownership rates are nearly 10 percent lower than those of their baby boomer and Generation X counterparts of the same age.

For millennials who have purchased a home, net housing wealth—the value of the home, minus mortgage debt—is about the same as that of their baby boomer parents at the same age.

It remains to be seen if millennials are delaying home purchases or forgoing home ownership all together. New research suggests barriers to financing a home, such as borrowing constraints, are at least partially to blame for falling home ownership rates and rising co-residence rates.

Whether these barriers will ease in the future is unknown. However, a recent study in the UK finds that groups experiencing low home ownership rates at age 30 tend to catch up later in life.

To read more research and find data on housing markets around the world, check out the IMF’s Global Housing Watch .

You can also read more blogs about global house prices and our recent chart of the week on the housing price boom in Norway .

Rising mortgage debt is the biggest threat to super balances

From The New Daily.

New data suggests rising property prices are a threat to the retirement system, as many Australians use their superannuation balances to pay off their mortgages before they retire.

The latest investment update from NAB highlights that many Australians are concerned about ending their working lives in debt. It reported an increase in the number of respondents who feared a lack of retirement savings. It also found that paying down debt was the highest priority for the next 12 months.

Likewise, the 2017 Household, Income and Labour Dynamics in Australia (HILDA) report – widely reported in recent days for its concerning home ownership numbers – also showed that both men and women were spending considerable chunks of their super to pay debts.

It found that men paying down debts spent on average $240,000 to do so in 2015, or 58 per cent of their super, while men helping family members spent $108,500, around 84 per cent of super. Women paying down debt spent $120,500, or 70 per cent of super and those helping family spent $67,000, or 48 per cent of super.

Some men and women also spent up big on things for themselves, as the following table shows. However, men spent far more than women here, indicating the gender imbalance in superannuation accounts.

Ian Yates, chief executive of the Council on the Ageing (COTA), said rising property prices could force more people to pay down more mortgage debt on retirement in the future.

“People are paying off debts of not inconsequential amounts on retirement. The numbers doing it and the amounts used surprised me,” he told The New Daily.

“It’s a concerning trend and if people plan to use their super to pay off a mortgage then they are not using it to provide retirement income.”

He said this could result in the government being faced with a dilemma.

“Given the family home is untaxed, the increased use of concessionally-taxed superannuation to pay off homes in retirement would not be what the government intended,” he said.

That could mean governments would be forced to review both superannuation and housing policy as “both superannuation and the age pension are predicated on high levels of home ownership”.

The HILDA report also showed that both men and women are retiring later with the average age of women retirees reaching 63.8 years in 2015 and men 66.1 years.

Mr Yates said the rise in retirement ages, while partly due to desire to work longer, also had a negative financial driver.

“A lot of people got frightened by the market crash accompanying the financial crisis and decided they need a bigger financial buffer before they retire.”

For 16 years the HILDA survey, run by the University of Melbourne, has polled the same 17,000 Australians.

The report’s author, Professor Roger Wilkins, pointed to the falling home ownership levels among younger people. In 2014, approximately 25 per cent of men and women aged 18 to 39 were home owners, down from nearly 36 per cent in 2002.

Younger people with housing debt saw average mortgages up from $169,000 to $336,500 between 2002 and 2014.

That reality plus rising prices meaning people have to save longer before buying “could result in the superannuation system being thwarted in its aim to provide retirement income by rises in outstanding mortgage debt”, Professor Wilkins told The New Daily.

Why is Melbourne’s property market outpacing Sydney’s?

From The Real Estate Conversation.

Recent data suggests Melbourne’s property market is beginning to outpace Sydney’s, and this trend is likely to continue as affordability, higher interest rates and migration patterns all favour the southern city, say experts.

In June, Melbourne’s median dwelling price rose 2.71 per cent, compared with Sydney’s increase of 2.21 per cent, according to CoreLogic.

In the year to 30 June, Melbourne price growth also outpaced Sydney’s. Melbourne’s median dwelling price rose 13.7 percent (to $913,060), while Sydney’s median dwelling price rose only 12.2 per cent (to a median price of $1,118,020).

And there are other signs the Melbourne market is outpacing Sydney’s.

Melbourne’s clearance rate last week was higher than Sydney’s. Last week, Melbourne’s clearance rate was 77.4 per cent, compared with 72.9 per cent for Sydney. A total of 753 properties went to auction in Melbourne, compared with 600 in Sydney.

And Melbourne houses are selling slightly more quickly than Sydney’s. Melbourne houses are selling within 29 days, while Sydney houses are selling within 31 days. Vendors are discounting houses to achieve a sale to the tune of 4.5 per cent in Sydney, compared with the lower discount of 3.8 per cent in Melbourne.

Cameron Kusher, senior research analyst with CoreLogic, says there are four reasons the Melbourne real estate market is likely to see prices grow more strongly than Sydney’s prices.

Firstly, Melbourne prices are much lower than Sydney’s, so Melbourne prices are unlikely to see any correction to the same degree as Sydney.

Second, interstate migration into NSW is waning, while it is continuing to strengthen in Victoria, partly because of housing affordability, says Kusher.

The 2016 Census revealed that Melbourne is growing more quickly than Sydney, with the southern city adding 1,859 people per week between the 2001 and 2016, and Sydney adding only 1,656 people per week. And while Sydney remains the largest city, with a population of 4.8 million, Melbourne isn’t far behind with a population of 4.5 million.

The third reason Kusher gave for Melbourne’s relatively strong performance is there are more properties advertised for sale in Sydney. “There are currently 13.3% more properties advertised for sale in Sydney than at the same time last year, while in Melbourne listings are just 0.1% higher than a year ago,” said Kusher. So people looking to buy in Sydney have greater choice, which keeps price growth contained, he said.

And finally, Kusher says that higher interest rates are likely to have more of an impact in Sydney, because a higher proportion of the market is made up of investors. CoreLogic’s May data showed that investors accounted for 55.1% of new mortgage demand (excluding refinances) in NSW, and 44.6% of new mortgage demand in Victoria.

“If the higher interest rates are discouraging investment (as they appear to be),” says Kusher, “it is going to be having a much bigger impact on market demand in Sydney than in Melbourne given their much higher level of participation.”

Rick Daniel, agent with Nelson Alexander Fitzroy, told SCHWARTZWILLIAMS the Melbourne market is seeing strong interest from interstate.

“Towards the end of last year, we saw quite an influx of interstate investors” into the Melbourne market, he said.

“Melbourne provides quite a lot of value,” he said, adding that buyers also see lifestyle benefits of buying in Melbourne, because transport is easy, and the inner-city suburbs are eminently walkable.

Daniel said that even though the Melbourne market is experiencing the seasonal slow down, “there still seems to be some activity,” he said, adding that unique properties, such as the one at 6 Oxford Street, Collingwood, are still attracting strong interest, including from interstate.

Chris Wilkins, principal of Ray White Drummoyne, told SCHWARTZWILLIAMS the Sydney market is in a “holding pattern”, and the “feeling [in the market] is worse than last year”.

Wilkins said he has had several potential sellers sitting on their hands because there is nothing for them to buy.

Rod Fox of 1st City Real Estate Double Bay told SCHWARTZWILLIAMS the “urgency” has gone out of the Sydney market. Fox said that six months ago, any property that came onto the market sold very quickly, and often for higher-than-expected prices. Fox said that previously, 80 per cent of properties were selling before auction, and that figure has now halved.

But Fox said good quality properties are still selling quickly and for good prices, but overall, Sydney “buyers are more cautious”.

Taxing empty homes: a step towards affordable housing, but much more can be done

From The Conversation.

Vacant housing rates are rising in our major cities. Across Australia on census night, 11.2% of housing was recorded as unoccupied – a total of 1,089,165 dwellings. With housing affordability stress also intensifying, the moment for a push on empty property taxes looks to have arrived.

The 2016 Census showed empty property numbers up by 19% in Melbourne and 15% in Sydney over the past five years alone. Considering that thousands of people sleep rough – almost 7,000 on census night in 2011, more than 400 per night in Sydney in 2017 – and that hundreds of thousands face overcrowded homes or unaffordable rents, these seem like cruel and immoral revelations.

Public awareness of unused homes has been growing in Australia and globally. In London, Vancouver and elsewhere – just as in Sydney and Melbourne – the night-time spectacle of dark spaces in newly built “luxury towers” has triggered outrage.

This has struck a chord with the public not only because of its connotations of obscene wealth inequality and waste, but also because of the contended link to foreign ownership.

Early movers on vacancy tax

Against this backdrop, the Victorian state government has felt sufficiently emboldened to legislate an empty homes tax. Federally, the shadow treasurer, Chris Bowen, recently backed a standard vacant dwelling tax across all the nation’s major cities.

Similar measures have come into force in Vancouver and Paris. And Ontario’s provincial government recently granted Toronto new powers to tax empty properties .

Both Vancouver (above) and Melbourne now have a 1% capital value charge on homes left vacant. Tim Welbourn/flickr, CC BY-NC

Emulating Vancouver, Victoria’s tax is a 1% capital value charge on homes vacant for at least six months in a year. Curiously, though, it applies only in Melbourne’s inner and middle suburbs. And there are exceptions – if the property is a grossly under-used second home you pay only if you’re a foreigner.

Also, as in Vancouver, tax liability relies on self-reporting, which is seemingly a loophole. This might be less problematic if all owners were required to confirm their properties were occupied for at least six months of the past year. But that would be administratively cumbersome.

This highlights a broader “practicability challenge” for empty property taxes. For example, how do you define acceptable reasons for a property being empty?

In principle, such a tax should probably be limited to habitable dwellings. So, if you own a speculative vacancy, what do you do? Remove the kitchen sink to declare it unliveable?

How can we be sure a home is empty?

Lack of reliable data on empty homes is a major problem in Australia. Census figures are useful mainly because they indicate trends over time, but they substantially overstate the true number of long-term vacant habitable properties because they include temporarily empty dwellings (including second homes).

About 150,000 dwellings in Sydney and Melbourne, including many apartments, are ‘speculative vacancies’, but establishing tax liability isn’t simple. Dean Lewins/AAP

Using Victorian water records, Prosper Australia estimates about half of Melbourne’s census-recorded vacant properties are long-term “speculative vacancies”. That’s 82,000 homes.

Applying a similar “conversion factor” to Sydney’s census numbers would indicate around 68,000 speculative vacancies. Australia-wide, the Prosper Australia findings imply around 300,000 speculative vacancies – 3% of all housing. That’s equivalent to two years’ house building at current rates.

According to University of Queensland real estate economics expert Cameron Murray, a national tax that entirely eliminated this glut might moderate the price of housing by 1-2%. Therefore, although worthwhile, dealing with this element of our inefficient use of land and property would provide only a small easing of Australia’s broader affordability problem.

Making better use of a scarce resource

Taxing long-term empty properties is consistent with making more efficient use of our housing stock – a scarce resource. A big-picture implication is that tackling Australia’s housing stress shouldn’t be seen as purely about boosting new housing supply – as commonly portrayed by governments.

It should also be about making more efficient and equitable use of existing housing and housing-designated land.

Penalising empty dwellings is fine if it can be practicably achieved. That’s especially if the revenue is used to enhance the trivial amount of public funding going into building affordable rental housing in most of our states and territories.

But empty homes represent just a small element of our increasingly inefficient and wasteful use of housing and the increasingly unequal distribution of our national wealth.

One aspect of this is the under-utilisation of occupied housing. Australian Bureau of Statistics survey data show that, across Australia, more than a million homes (mainly owner-occupied) have three or more spare bedrooms. A comparison of the latest statistics (for 2013-14) with those for 2007-08 suggests this body of “grossly under-utilised” properties grew by more than 250,000 in the last six years.

Our tax system does nothing to discourage this increasingly wasteful use of housing. It’s arguably encouraged by the “tax on mobility” constituted by stamp duty and the exemption of the family home from the pension assets test.

A parallel issue is the speculative land banks owned by developers. The volume of development approvals far exceeds the amount of actual building. In the past year in Sydney, for example, 56,000 development approvals were granted – but only 38,000 homes were built.

In many cases, getting an approval is just part of land speculation. The owner then hoards the site until “market conditions are right” for on-selling as approved for development at a fat profit.

Properly addressing these issues calls for something much more ambitious than an empty property tax. The federal government should be encouraging all states and territories to follow the ACT’s lead by phasing in a broad-based land tax to replace stamp duty.

Such a tax will provide a stronger financial incentive to make effective use of land and property. The Grattan Institute estimates this switch would also “add up to A$9 billion annually to gross domestic product”. How much longer can we afford to ignore this obvious policy innovation?

Author: Hal Pawson, Associate Director – City Futures – Urban Policy and Strategy, City Futures Research Centre, Housing Policy and Practice, UNSW