Household debt in Australia continues to rise. But the strongest growth at 15%, is found in the sub prime Alternative Lending Personal Credit sector.
So it is worth considering the personal credit market holistically.
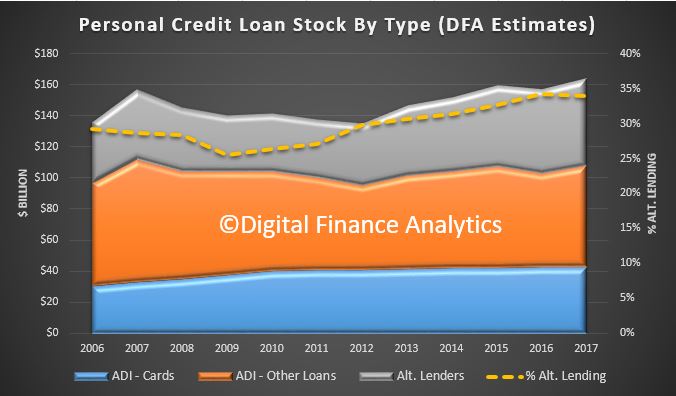
Drawing data from our cure market models we estimate total personal credit to the ~9.2 million Australian households currently amounts to $164 billion. This is separate from the $1.7 trillion secured debt for owner occupied and investment housing.
Within that banks and mutuals (ADI’s) hold $42 billion in credit cards, and $66 billion in personal loans of all types. But this leaves Alternative Lenders, (non-banks) with around $56 billion, or 34% of all personal credit. The chart below shows the relative shares since 2006. The Alternative Lending sector is growing faster than credit from ADI’s.
Relatively, overall personal credit has grown at around 2.6% in the past 3 years. Within that, credit card debt has been static, ADI personal credit rose 2% but Alternative Lending credit rose 5%.
In fact ADI’s have stepped up their personal lending as mortgage lending has eased, with an 8% rise in the past 12 months. We expect this momentum to continue, with a strong focus on vehicle credit, another risk area!
Alternative Lenders include many large well established companies, as well as a rising tide of new online lenders, including P2P loan providers. In fact online has become the predominate origination channel. As they are not banks, ASIC is the primary regulatory body.
But looking in more detail, the sub prime segment of Alternative Lending has growing significantly faster at around 15% per annum over the past three years, compared with 5% for all Alternative Lending. We define sub prime as households with VedaScore/Equifax Score below 622, or a poor credit history, or adverse personal circumstances.
There are a range of products taken by households in the sub prime segment, including unsecured personal loans, Medium Amount Credit Contracts (MACC), Small Amount Credit Contracts (SACC), secured and unsecured car loans or loans on other capital goods, and loans secured by assets, such as cars post purchase.
Our surveys show that a considerable number of highly in debt households with mortgages also hold loans with Alternative Lenders. Such loans might be difficult spot during an assessment of a mortgage loan application, thanks to the negative credit records which are only now morphing into comprehensive credit.
This is a concerning trend and is further evidence of the debt laden state of many households. It also helps to explain the gap between stated finances on a mortgage loan application and the real state of household finances.
How far will home prices fall? Welcome to the Property Imperative weekly to 3rd March 2018.
Yet another big big week in property and finance for us to review today. Watch the video or read the transcript.
We start with the latest home price data from CoreLogic. Prices continue to soften. On an annual basis, prices are down 0.5% in Sydney, 2.7% in Perth and 7.4% in Darwin. They were higher over the year in Melbourne, up 6.9%, Brisbane 1.8%, Adelaide 2.2% and Hobart a massive 13.1%. But be beware, these are average figures, and there are considerable variations across locations within regions and across property types. The bigger falls are being seen at the top end of the market.
Over the three months to February, Adelaide was up 0.1% and Hobart 3.2%. These were the only capital cities in which values rose. Sydney, which has been the strongest market for value growth over recent years, saw the largest fall in values over the three-month period, down -2.4%. Sydney was followed by Darwin, which has been persistently weak over recent years, and saw values fall by a further -2.0% over the quarter.
Finally, CoreLogic says month-on-month falls were generally mild but broad based. Over the month, values fell across every capital city except Hobart (+0.7%) and Adelaide (steady), with the largest monthly decline recorded across Darwin (-0.9%) and Sydney (-0.6%). Values were lower in Melbourne (-0.1%), Brisbane (-0.1%), Perth (-0.2%), and Canberra (-0.3%).
The reason for the falls are pretty plain to see. Demand is substantially off, especially from investors, as mortgage underwriting standards are tightening. So it was interesting to hear APRA chairman Wayne Byres’s testimony in front of the Senate Economics Legislation Committee. I discussed this with Ross Greenwood on 2GB. During the session he said that the 10% cap on banks’ lending to housing investors imposed in December 2014 was “probably reaching the end of its useful life” as lending standards have improved. Essentially it had become redundant. But the other policy, a limit of more than 30% of lending interest only will stay in place. This more recent additional intervention, dating from March 2017, will stay for now, despite it being a temporary measure. The 30% cap is based on the flow of new lending in a particular quarter, relative to the total flow of new lending in that quarter. This all points to tighter mortgage lending standards ahead, but still does not address the risks in the back book. The mortgage underwriting screws are much tighter now – our surveys show that about a quarter or people seeking a mortgage now cannot get one due to the newly imposed limits on income, expenses and serviceability.
During the sessions, Senator Lee Rhiannon asked APRA about mortgage fraud. This was to my mind the most significant part.
Yet even now, more than 10% of new loans are being funded at a loan to income of more than 6 times. And whilst the volume of interest only loans has fallen to 20% of new loans, well below the 30% limit, it seems small ADI’s are lending faster than the majors. And we know the non-banks are going gang busters.
Now the HIA said their Housing Affordability Index saw a small improvement of 0.2 per cent during the December 2017 quarter indicating that affordability challenges have eased thanks to softer home prices in Sydney where they are now slightly lower than they were a year ago. This makes home purchase a little more accessible, particularly for First Home Buyers they said. But they failed to mention the now tighter lending standards which more than negates any small improvement in their index.
The impact of this tightening came through in the latest data on housing finance from both the RBA and APRA. I made a separate video on this if you want the gory details. The RBA said that in January owner occupied lending rose 0.6%, or 8% over the past year to $1.14 trillion. Investment lending rose 0.2% or 3% over the past year to $587 billion and comprises 34% of all housing lending. They changed the way they report the data this month. It changes the trend reporting significantly. Since mid-2015 the bank has been writing back perceived loan reclassifications which pushed the investor loans higher and the owner occupied loans lower. They have now reversed this policy, so the flow of investment loans is lower (and more in line with the data from APRA on bank portfolios). Investor loans are suddenly 2% lower. Magically! Once again, this highlights the rubbery nature of the data on lending in Australia. What with data problems in the banks, and at the RBA, we really do not have a good chart and compass. It just happens to be the biggest threat to financial stability but never mind.
The latest APRA Monthly Banking Statistics to January 2018 tells an interesting tale. Total loans from ADI’s rose by $6.1 billion in the month, up 0.4%. Within that loans for owner occupation rose 0.57%, up $5.96 billion to $1.05 trillion, while loans for investment purposes rose 0.04% or $210 million. 34.4% of loans in the portfolio are for investment purposes. So the rotation away from investment loans continues, and overall lending momentum is slowing a little (but still represents an annual growth rate of nearly 5%, still well above inflation or income at 1.9%!). Looking at the lender portfolio, we see some significant divergence in strategy. Westpac is still driving investment loans the hardest, while CBA and ANZ portfolios have falling in total value, with lower new acquisitions and switching. Bank of Queensland and Macquarie are also lifting investment lending.
Now searching questions are being asked about Lax Mortgage Lending, and the risks the banks are sitting on at the moment. While better lending controls will help ahead, we have a significant problem now, with many households facing financial difficulty. First there is the issue of basic cash flow, as incomes remain contained, costs of living rise, and mortgage payments still need to be met. We estimate 51,500 households risk default in the year ahead, a small but growing problem. We will release the February mortgage stress data on Monday, so look out for that.
Then there is the question of banks and brokers not doing sufficient due diligence on loan applications. This is something the Royal Commission will be looking at in the next couple of weeks. We worked with the ABC on a story, which aired this week, looking at the issues around poor lending. Its complex of course, because borrowers have to take some responsibility for the applications they made for credit, and need to be truthful. But both brokers and lenders have obligations to make sufficient inquiry into the applicant’s circumstances to ensure the loan is “not unsuitable” – which is nothing to do with the “best” mortgage by the way, it’s a much lower hurdle. But if a loan were deemed to be unsuitable, the courts may change the terms of the loan, or cancel the loan, meaning a borrower could leave a property without debt. An upcoming court case may clarify the law. But in the ABC piece, Brian Johnston, one of the best analysts in the business said this means it moves from being the borrowers problem to being the banks problem!
This also touches on the role of mortgage brokers, and whether their commission based remuneration might influence their loan recommendations, to the detriment of their customers, which is more than half the market. This is something which both ASIC and the Productivity Commission have been highlighting. Speaking at a CEDA event, Productivity Commission chairman Peter Harris said more than $2.4bn is now paid annually for mortgage broker services. The commission’s draft report released in early February says that based on ASIC’s findings, lenders pay brokers an upfront commission of $2,289 (0.62%) and a trail commission of $665 (0.18%) a year on an average new home loan of $369,000. He zeroed in on trailing commissions – which he said are worth $1bn per annum – and questioned their relevance.
The Banking Royal Commission says the first round of public hearings will be held in Melbourne at the Owen Dixon Commonwealth Law Courts Building at 305 William Street from Tuesday 13 March to Friday 23 March. They listed the range of matters they are exploring, from mortgages, brokers, cards, car finance, add-on insurance and account administration, with reference to specific banks, including NAB, CBA, ANZ, Westpac, Aussie, and Citi. Responsible lending is the theme.
Talking of mortgage brokers, another question to consider is the ownership relationship between a broker, their aggregator and the Bank. Not only are many brokers effectively directly employed by the big banks, but more have strong associations, these relationships are not adequately disclosed.
The New Daily did a good piece on showing these linkages, most of which are hard to spot. They said that Fans of Married at First Sight and My Kitchen Rules may have noticed over the past few days that popular property website realestate.com.au has started advertising a new product: home loans. But Realestate.com.au Home Loans is not an independent initiative. Far from it. It is a deal between Rupert Murdoch’s News Corp, which owns 61.6 per cent of realestate.com.au, and big-four bank NAB. Last June REA Group, the company behind the realestate.com.au website, signed what it called a “strategic mortgage broking partnership” with NAB. What REA Group is actually doing is piggy-backing on a mortgage broker called Choice Home Loans. In other words, while the branding may be realestate.com.au, the actual mortgage broking firm is Choice Home Loans. And who owns Choice Home Loans? NAB does. If you get conditional approval through realestate.com.au, it will be provided by NAB. However, getting conditional approval with NAB does not commit you to a NAB home loan. First, you could choose a realestate.com.au ‘white label’ loan. This is a loan that on the face of it looks like it is provided by realestate.com.au. But once again appearances are deceptive. REA Group does not have a mortgage lenders’ licence. So while these loans may be branded realestate.com.au, they are actually provided by a nationwide mortgage lender called Advantedge. And who owns Advantedge? NAB does. If you don’t fancy the realestate.com.au home loan, there are other choices. First, there is a range of NAB mortgages. And then, there is a list of mortgages from other providers – more than 30 of them, including big names like Westpac, ANZ, Commonwealth Bank, Macquarie, ING, ME, UBank – the list goes on. Oh, and by the way, that last bank mentioned – UBank – is also owned by NAB. All this highlights the hidden connections and the market power of the big banks. Like I said, these relationships are hard to spot!
Another little reported issue this week was the financial viability of Lenders Mortgage Insurers in Australia, those specialist insurers who cover mortgages over 80% loan to value. QBE Insurance reported their full year 2017 results today and reported a statutory 2017 net loss after tax of $1,249 million, which compares with a net profit after tax of $844 million in the prior year. This is a diverse and complex group, which is now seeking a path to rationalisation. They declared their Asia Pacific result “unacceptable” and said the strategy was to “narrow the focus and simplify back to core” with a focus on the reduction in poor performing segments. This begs the question. What is the status of their Lenders Mortgage Insurance (LMI) business? They reported a higher combined operating ratio consistent with a cyclical slowdown in the Australian mortgage insurance industry, higher claims and a lower cure rate. Very little detail was included in the results, but this aligns with similar experience at Genworth the listed monoline who reported a 26% drop in profit, and provides greater insight into the mortgage sector. Both LMI’s are experiencing similar stresses, with lower premium income, and higher claims. And this before the property market really slows, or interest rates rise! Begs the question, how secure are the external LMI’s? Another risk to consider.
Last week’s auction preliminary results from Domain said nationally, so far from the 2,627 properties listed for auction, only 1,794 actually went for sale, and 1,325 properties sold. So the real clearance rate against those listed is 50.4%. Domain though calculates the clearance rate on those going to auction, less withdrawn sales over those sold. This give a higher measure of 68.8% nationally, which is still lower than a year ago. But, we ask, which is the real clearance rate?
Finally, there is a rising chorus demanding that APRA loosen their rules for mortgage lending in the face of slipping home prices. This despite the RBA’s recent comments about the risks in the system, especially relating to investor and interest only loans. But this is unlikely, and in fact more tightening, either by a rate rise, or macroprudential will be needed to contain the risks in the system. The latter is more likely. Some of this will come from the lenders directly. For example, last week ANZ said it will be regarding all interest-only loan renewals as credit critical event requiring full income verification from 5 March. If loans failed this assessment these loans would revert to P&I loans (with of course higher repayment terms). We are already seeing a number of forced switches, or forced sales thanks to the tighter IO rules more generally. We will release updated numbers next week. But, as ANZ has pointed out in a separate note from David Plank, Head of Australian Economics at ANZ; household leverage is still increasing, this despite a moderation in housing credit growth over the past year. Household debt continues to grow faster than disposable income. With household debt being close to double disposable income it will actually require the growth in household debt to slow well below that of income in order for the ratio of household debt to income to stabilise, let alone fall. In fact, he questions whether financial stability has really been improved so far, when interest rates are so very low.
So, nothing we have seen this week changes our view of more, and significant falls in property values ahead as mortgage lending is tightened further. This also shows that it is really credit supply and demand, not property supply and demand which is the critical controller of home price movements. Another reason to revisit the question of negative property gearing in my view.
What’s the story with Interest only? Welcome to the Property Imperative Weekly to 24th February 2018.
Welcome to the latest weekly digest of property and finance news. Watch the video or read the transcript.
Michelle Bullock from the RBA spoke about Mortgage Stress and Investor Loans this week. She argued that, based on HILDA data from 2016, mortgage stress was not a major issue, (we beg to differ) but also warned there were elevated risks to Property Investors, and especially those holding interest only loans. This mirrors APRA’s warnings the previous week. She said that investors have less incentive than owner-occupiers to pay down their debt. Many take out interest-only loans so that their debt does not decline over time. If housing prices were to fall substantially, therefore, such borrowers might find themselves in a position of negative equity more quickly than borrowers with an equivalent starting LVR that had paid down some principal. The macro-financial risks are potentially heightened with investor lending. For example, since it is not their home, investors might be more inclined to sell investment properties in an environment of falling house prices in order to minimise capital losses. This might exacerbate the fall in prices, impacting the housing wealth of all home owners. As investors purchase more new dwellings than owner-occupiers, they might also exacerbate the housing construction cycle, making it prone to periods of oversupply and having a knock on effect to developers.
So we did some further analysis on Interest Only Loans, we already identified that conservatively $60 billion of loans will fail current underwriting standards on reset, which is more than 10% of the portfolio. We discussed this with Ross Greenwood on 2GB’s Money Show.
But how many loans are interest only, and what is the value of these loans? A good question, and one which is not straightforward to answer, as the monthly stats from the RBA and ABS do not split out IO loans. They should.
The only public source is from APRA’s Quarterly Property Exposures, the next edition to December 2017 comes out in mid March, hardly timely. So we have to revert to the September 2017 data which came out in December. This data is all ADI’s with greater than $1 billion of term loans, and does not include the non-bank sector which is not reported anywhere!
They reported that 26.9% of all loans, by number of loans were IO loans, down from a peak of 29.8% in September 2015. They also reported the value of these loans were 35.4% of all loans outstanding, down from a peak of 39.5% in September 2015.
So, what does this trend look like. Well the first chart shows the value of loans in Sept 2017 was $549 billion, down from a peak of $587 billion in March 2017. The number of loans outstanding was 1.56 million loans, down from a peak of 1.69 million loans in December 2016.
If we plot the trends by number of loans and value of loans, we see that the value exposed is still very high. Finally, the average loan size for IO loans is significantly higher at $347,000 compared with $264,300 for all loans. Despite the fall in volume the average loan size is not falling (so far). The point is the regulatory intervention is having a SMALL effect, and there is a large back book of loans written, so the problem is risky lending has not gone away.
US Mortgage rates continue to climb, following the recent FED minutes which were more upbeat, and continues to signal more rate hikes this year. As a result, average rates moved to their highest levels in more than 4 years. Moody’s made the point that US Government debt will likely rise by 5.9% in the next year, significantly faster than private sector debt, yet argued that this might not be sufficient to drive rates higher. On the other hand, Westpac argues that the Fed may have to lift rates faster and higher than many expect thanks to strong wage growth and higher government spending, and are forecasting rises of 1.25% ahead. This would have a significant knock-on effect. In fact, the recent IMF country report on Australia forecast that the average mortgage rate in Australia would rise by 2% to 7.1% in 2021. That would cause some pain (and lift mortgage stress from ~920k to 1.25m households on our models. We heard this week that the ACCC is due to release its interim report into residential mortgage pricing shortly. As directed by the Treasurer, a key focus will be on transparency, particularly how the major banks balance the interests of consumers and shareholders in making their interest rate decisions. And the RBA minutes seemed to suggest a wait and see approach to changing the cash rate.
The Royal Commission continues its deep dive into lending misconduct, and announced the dates for the next set of hearings in early March. They also released a background document spotlighting Mortgage Brokers. The data highlights broker share is up to 55% of mortgages, and some of the largest players are owned by the big banks, for example Aussie, is owned by CBA.
Separately ASIC discussed structural conflicts from the relationship between Financial Planners and Mortgage Brokers and the companies who own them and the commission structures which are in place. To reduce the impact of ownership structure, ASIC proposed that participants in the industry “more clearly disclose their ownership structures”.
When asked whether mortgage brokers should come under “conflicted remuneration laws”, ASIC’s Peter Kell said: “There’s been a lot of work done on this, so it’s difficult to get a yes or no answer, but we’ve obviously highlighted in our report that we think there are some aspects of the way that remuneration works in the mortgage-broking sector that would be better to take out of the sector because they raise unreasonable conflicts.”
However, the Productivity Commission has gone a step further by calling for a legal provision to be imposed by ASIC to require lender-owned aggregators to work in the “best interest” of customers.
Draft recommendation 8.1 reads: “The Australian Securities and Investments Commission should impose a clear legal duty on mortgage aggregators owned by lenders to act in the consumer’s best interests.
“Such a duty should be imposed even if these aggregators operate as independent subsidiaries of their parent lender institution, and should also apply to the mortgage brokers operating under them.”
We caught up with several investment management teams this week who are in the country visiting the major banks as part of their regular reviews. One observation which came from these is that the major banks generally believe there will be very little change coming from the plethora of reviews currently in train, so it will be business as usual. We are less sure, as some of the issues being explored appear to be structurally significant.
Economic news this week included the latest wage price data from the ABS. You can clearly see the gap between trend public and private sector rates, with the private sector sitting at 1.9% and public sector 2.4%. The CPI was 1.9% in December, so no real growth for more than half of all households! Victoria was the highest through the year wage growth of 2.4 per cent and The Northern Territory recorded the lowest of 1.1 per cent. So if you want a wage rise, go to the Public Sector in Victoria!
There were more warnings, this time from comparison site Mozo on the risks of borrowers grabbing the “cheap” special mortgage offers which are flooding the market at the moment. Crunching the numbers in the Mozo database, they found that homeowners could pay as much as 174 basis points more when the ‘honeymoon period’ on their home loan ends. In fact, the research revealed that the average homeowner with a $300,000 home loan could end up paying as much as $3,423 in additional interest charges each year if they’re caught taking the introductory rate bait. But this can become an even more costly error when you consider how much extra interest you could end up paying over the life of the loan.
And mortgage underwriting standards continue to tighten as NAB has made a change to its home lending policy amid concerns over the rising household debt to income ratio and as APRA zeroes in on loan serviceability. From Friday, 16 February, the loan to income ratio used in its home lending credit assessment has been changed from 8 to 7. With the new change, loan applications with an LTI ratio of 7 or less will proceed as normal and will be subject to standard lending criteria, according to the note. But stop and think about this, because a loan to income of 7 is hardly conservative in the current environment. In fact, when I used to underwrite mortgages we used a basic calculation of no more than 3.5 times one income plus one time any second income. We still think underwriting is too loose.
Finally home prices continued to drift lower, especially in Sydney according to CoreLogic, who also said the final auction clearance rate across the combined capital cities rose to 66.1 per cent across a higher volume of auctions last week, with 1,992 auctions held, increasing from the 1,470 auctions the week prior when 63.7 per cent cleared. But last week’s clearance rate was lower than the 74.9 per cent recorded one year ago when volumes were higher (2,291). So momentum is still sluggish.
We think lending standards, and misconduct will be coming to the fore in the coming couple of weeks leading up to the next Banking Commission Hearing sessions. Remember this, if a loan is judged as “suitable”, it opens the door for recourse to the lender, which may include cancellation or alternation of the loan. Now, if volumes of interest only loans were judged “not suitable” this could open the flood gates on potential claims. Things might just get interesting!
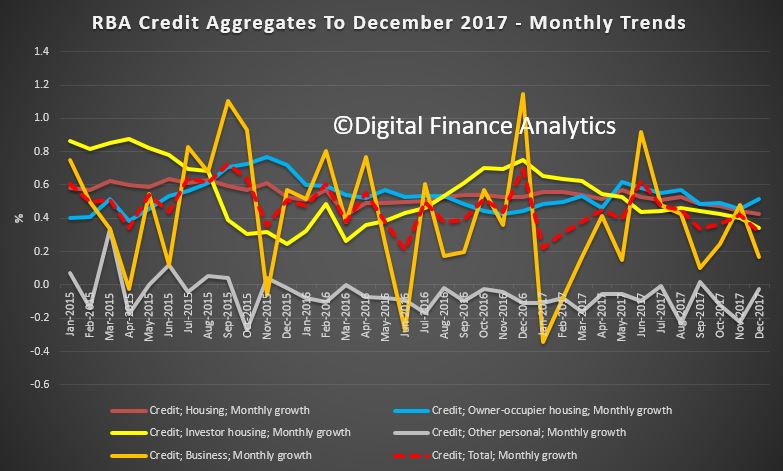
They report that lending for housing grew 6.3% for the 12 months to December 2017, the same as the previous year, and the monthly growth was 0.4%. Business lending was just 0.2% in December and 3.2% for the year, down on the 5.6% the previous year. Personal credit was flat in December, but down 1.1% over the past year, compared with a fall of 0.9% last year. This is in stark contrast to the Pay Day Loan sector, which is growing fast, as we discussed yesterday (and not in the RBA data).
Total credit grew 0.3% in the month, and 4.8% for the year, so mortgage lending is still supporting overall growth, lifting the record household debt even higher. We need still tighter regulatory controls – especially as the costs of living continue to outstrip wage growth.
The annual trends show that investor lending is slowing a little, but still stands at 6.1% seasonally adjusted. Owner occupied lending is running at 6.4% over the last year. 34.1% of loans are for investment purposes.
The monthly data is very noisy as usual.
The value of owner occupied loans was $1.13 trillion, up $6.3 billion or 0.6%, seasonally adjusted; investment loans were $587 billion up $2 billion or 0.3%, seasonally adjusted; other personal credit $151 billion, down 0.2% or 0.3 billion and business lending was $908 billion, up $0.8 billion or 0.1%.
The data contains various health warnings:
All growth rates for the financial aggregates are seasonally adjusted, and adjusted for the effects of breaks in the series as recorded in the notes to the tables listed below. Data for the levels of financial aggregates are not adjusted for series breaks. Historical levels and growth rates for the financial aggregates have been revised owing to the resubmission of data by some financial intermediaries, the re-estimation of seasonal factors and the incorporation of securitisation data. The RBA credit aggregates measure credit provided by financial institutions operating domestically. They do not capture cross-border or non-intermediated lending.
Following the introduction of an interest rate differential between housing loans to investors and owner-occupiers in mid-2015, a number of borrowers have changed the purpose of their existing loan; the net value of switching of loan purpose from investor to owner-occupier is estimated to have been $62 billion over the period of July 2015 to December 2017, of which $1.1 billion occurred in December 2017. These changes are reflected in the level of owner-occupier and investor credit outstanding. However, growth rates for these series have been adjusted to remove the effect of loan purpose changes.
Lenders are facing a dilemma, do they chase mortgage lending growth, and embed more risks into their portfolios, or accept the consequences of lower growth and returns as household debt explodes and we join the 200% Club!
Welcome to the Property Imperative weekly to 20 January 2018. We offer two versions of the update, the first a free form summary edition in response to requests from members of our community:
Alternatively, you can watch our more detailed version, with lots of numbers and charts, which some may find overwhelming, but was the original intent of the DFA Blog – getting behind the numbers.
Tell us which you prefer. You can watch the video, or read the transcript.
In our latest digest of finance and property news, we start with news from the ABS who revised housing debt upward, to include mortgage borrowing within Superannuation, so total Household Liabilities have been increased by approximately 3% to $2,466bn. The change, which required the accurate measurement of property investment by self-managed superannuation funds, brought the figure up from 194 per cent so we are now at 200% of income. A record which no-one should be proud of. It also again highlights the risks in the system. Australian households are in the 200% club.
The final set of data from the ABS – Lending Finance to November 2017 which also highlights again the changes underway in the property sector. Within the housing series, owner occupied lending for construction fell 0.88% compared with the previous month, down $17m; lending for the purchase of new dwellings rose 0.25%, up $3m; and loans for purchase of existing dwellings rose 0.11%, up $12m.
Refinance of existing owner occupied dwellings rose 0.28%, up $16m.
Looking at investors, borrowing for new investment construction rose 5%, up $65m; while purchase of existing property by investors fell $74m for individuals, down 0.75%; and for other investors, down $21m or 2.28%.
Overall there was a fall of $16m across all categories.
We see a fall in investment lending overall, but it is still 36% of new lending flows, so hardly a startling decline. Those calling for weakening of credit lending rules to support home price growth would do well to reflect that 36% is a big number – double that identified as risky by the Bank of England, who became twitchy at 16%!
Looking then across all lending categories, personal fixed credit (personal loans rose $70m, up 1.74%; while revolving credit (credit cards) fell $4m down 0.18%. Fixed commercial lending, other than for property investment rose $231m or 1.12%; while lending for investment purposes fell 0.25% or $30m. The share of fixed business lending for housing investment fell to 36.7% of business lending flows, compared with 41% in 2015. Revolving business credit rose $6m up 0.06%.
A highlight was the rise in first time buyer owner occupied loans, up by around 1,030 on the prior month, as buyers reacted to the incentives available, and attractor rates. This equates to 18% of all transactions. Non-first time buyers fell 0.5%. The average first time buyer loan rose again to $327,000, up 1% from last month. We do not think the data gives any support for the notion that regulators should loosen the lending rules, as some are suggesting. That said the “incentives” for first time buyers are having an effect – in essence, persuading people to buy in at the top, even as prices slide. I think people should be really careful, as the increased incentives are there to try and keep the balloon in the air for longer.
So, what can we conclude? Investment lending momentum is on the turn, though there is still lots of action in the funding of new property construction for investment – mostly in the high rise blocks around our major centres. But in fact momentum appears to be slowing in Brisbane, Sydney and Melbourne. This does not bode well for the construction sector in 2018, as we posit a fall in residential development, only partly offset by a rise in commercial and engineering construction (much of which is state and federal funded). What I’m noticing is that those in the construction sector – from small builders to sub-contractors – have significantly lower confidence levels than they did six months ago, based on our surveys.
Whilst lending to first time buyers is up, there are risks attached to this, as we will discuss later.
The good news is lending to business, other than for housing investment is rising a little, but businesses are still looking to hold costs down, and borrow carefully. This means economic growth will be slow, and potential wages growth will remain contained.
Fitch Ratings says Australian banks’ profit growth is likely to slow in 2018 as global monetary tightening pushes up funding costs, loan-impairment charges rise, and tighter regulation has an impact on business volumes and compliance costs from the 15 or so inquiries or reviews across the sector (according to UBS). They say Australian banks are more reliant on offshore wholesale funding than global peers, as the superannuation scheme here has created a lack of domestic customer deposits. Global monetary tightening could therefore push up banks’ funding costs. Indeed, The 10-Year US Bond yield is moving higher, and whilst the US Mortgage rates were only moderately higher today, the move was enough to officially bring them to the highest levels since the (Northern) Spring of 2017.
The main risks to banks’ performance stem from high property prices and household debt. Australian banks are more highly exposed to residential mortgages than international peers, while households could be sensitive to an eventual increase in interest rates or a rise in unemployment, given that their debt is nearly 200% of disposable income. Indeed, Tribeca Investment Partners said this week that local equities may be hurt by troughs in the domestic property market. “A heavily indebted household sector that is experiencing flat to negative real income growth, as well as dealing with higher energy and healthcare costs, and which has drawn down its savings rate, is unlikely to fill the gap in growth”
In local economic news, the latest ABS data on employment to December 2017, shows the trend unemployment rate decreased slightly to 5.4 per cent in December 2017, after the November 2017 figure was revised up to 5.5 per cent. The trend unemployment rate was 0.3 percentage points lower than a year ago, and is at its lowest point since January 2013.
The seasonally adjusted number of persons employed increased by 35,000 in December 2017. The seasonally adjusted unemployment rate increased by 0.1 percentage points to 5.5 per cent and the labour force participation rate increased to 65.7 per cent. The number of hours worked fell. By state, trend employment rose in NT, WA and SA. Over the past year, all states and territories recorded a decrease in their trend unemployment rates, except the Northern Territory (which increased 1.6 percentage points). The states and territories with the strongest annual growth in trend employment were Queensland and the ACT (both 4.6 per cent), followed by New South Wales (3.5 per cent).
The ABA released new research – The Edelman Intelligence research conducted late last year which tracks community trust and confidence in banks. Whilst progress may be being made, the research shows Australian banks are behind the global benchmark in terms of trust. Based on the Annual Edelman Trust Barometer study released in January 2017, Australia remains 4 points behind the global average.
The Australian Financial Review featured some of our recent research on the problem of refinancing interest only loans (IO). Many IO loan holders simply assume they can roll their loan on the same terms when it comes up for periodic review. Many will get a nasty surprise thanks to now tighter lending standards, and higher interest rates. Others may not even realise they have an IO loan!
Thousands of home owners face a looming financial crunch as $60 billion of interest-only loans written at the height of the property boom reset at higher rates and terms, over the next four years.
Monthly repayments on a typical $1 million mortgage could increase by more than 50 per cent as borrowers start repaying the principal on their loans, stretching budgets and increasing the risk of financial distress.
DFA analysis shows that over the next few years a considerable number of interest only loans (IO) which come up for review, will fail current underwriting standards. So households will be forced to switch to more expensive P&I loans, assuming they find a lender, or even sell. The same drama played out in the UK a couple of years ago when they brought in tighter restrictions on IO loans. The value of loans is significant. And may be understated.
We also featured research on the Bank of Mum and Dad, now a “Top 10” Lender in Australia. Our analysis shows that the number and value of loans made to First Time Buyers by the “Bank of Mum and Dad” has increased, to a total estimated at more than $20 billion, which places it among the top 10 mortgage lenders in Australia. Savings for a deposit is very difficult, at a time when many lenders are requiring a larger deposit as loan to value rules are tightened. The rise of the important of the Bank of Mum and Dad is a response to rising home prices, against flat incomes, and the equity growth which those already in the market have enjoyed. This enables an inter-generational cash switch, which those fortunate First Time Buyers with wealthy parents can enjoy. In turn, this enables them also to gain from the more generous First Home Owner Grants which are also available. Those who do not have wealthy parents are at a significant disadvantage. Whilst help comes in a number of ways, from a loan to a gift, or ongoing help with mortgage repayments or other expenses, where a cash injection is involved, the average is around $88,000. It does vary across the states. But overall, around 55% of First Time Buyers are getting assistance from parents, with around 23,000 in the last quarter.
There was also research this week LF Economics which showed that some major lenders are willing to accept a 20% “Deposit” for a mortgage from the equity in an existing property, and in so doing, avoided the need for expensive Lenders Mortgage Insurance.
Both arrangements are essentially cross leveraging property from existing equity, and is risky behaviour in a potentially falling market. More evidence of the lengths banks are willing to go to, to keep their mortgage books growing. We think these portfolio risks are not adequately understood.
So, we conclude that banks are caught between trying to grow their books, in a fading market, by offering cheap rates to target new borrowers, and accept equity from existing properties, thus piling on the risk; while dealing with rising overseas funding, and in a flat income environment, facing heightened risks from borrowers as they join the 200% club.
That’s the Property Imperative Weekly to 20 January 2018. If you found this useful, do leave a comment, subscribe to receive future updates and check back for our latest posts. Many thanks for watching.
In the final edition of the Property Imperative Weekly for 2017, we look ahead to 2018 and discuss the future trajectory of the property market, the shape of the mortgage industry, the evolution of banking and the likely state of household finances.
Watch the video, or read the transcript.
We start with the state of household finances. The latest data from the RBA shows that the ratio of debt to income deteriorated again (no surprise given the 6%+ growth in mortgage debt, and the ~2% income growth). The ratio of total debt to income is now an astronomical 199.7, and housing debt 137.5. Both are at all-time records, and underscores the deep problem we have with high debt.
We think that households will remain under significant debt pressure next year, and the latest data shows that mortgage lending is still growing at 3 times income growth. We doubt that incomes will rise any time soon, and so 2018 will be a year of rising debt, and as a result, more households will get into difficulty and mortgage stress will continue to climb. We think Treasury forecasts of rising household incomes are overblown. On the other hand, the costs of living will rise fast.
As a result, two things will happen. The first is that mortgage default rates are likely to rise (at current rock bottom interest rates, defaults should be lower), and if rates rise then default rates will climb further. The second outcome is that households will spend less and hunker down. As the Fed showed this week, the US economy is highly dependent on continued household spending to sustain economic growth – and the same is true here. We think many households will hold back on consumption, spending less on discretionary items and luxuries, and so this will be a brake on economic activity. This will have a strong negative influence on future economic growth, which we already saw throughout the Christmas shopping season.
Mortgage interest rates are likely to rise as international markets follow the US higher, lifting bank funding costs. This is separate from any change to the cash rate. This year the RBA was able to sit on its hands as the banks did their rate rises for them. We hold the view that the cash rate will remain stuck it its current rut for the next few months, because the regulators are acutely aware of the impact on households if they were to lift. They have little left in the tank if economic indicators weaken, and the bias will be upward, later in the year.
Competition for new loans will be strong, as banks need mortgages to support their shareholder returns. The latest credit data from the RBA showed that total mortgages are now at a record $1.71 trillion, and investor lending has fallen to an annual rate of 6.5%, compared with owner occupied lending at 6.3%, so total housing lending grew at 6.4%. Business lending is lower, at 4.7% and personal lending down 1.2%.
But APRA’s data shows that banks are writing less new business, so total Owner Occupied Balances are $1.041 trillion, up 0.56% in the month (so still well above income growth), while Investment Loans reached $551 billion, up 0.1%. So overall portfolio growth is now at 0.4%, and continues to slow. In fact, comparing the RBA and APRA figures we see the non-bank sector is taking up the slack, and of course they do not have the current regulatory constraints. The portfolio movements of major lenders show significant variation, with ANZ growing share the most, whilst CBA shrunk their portfolio a little. Westpac and NAB grew their investment loans more than the others.
We think there will be desperate attempts to attract new borrowers, with deeply discounted rates, yet at the same time mortgage underwriting standards will continue to tighten. We already see the impact of this in our most recent surveys. The analysis of our December 2017 results shows some significant shifts in sentiment – in summary:
First, obtaining finance for a mortgage is getting harder – this is especially the case for some property investors, as well as those seeking to buy for the first time; and those seeking to trade up. Clearly the tightening of lending standards is having a dampening effect. As a result, demand for mortgage finance looks set to ease as we go into 2018 and mortgage growth rates therefore will slide below 6%.
Next, overall expectations of future price gains have moderated significantly, and property investors are now less expectant of future capital growth in particular. This is significant, as the main driver for investors now is simply access to tax breaks. As a result, we expect home prices to drift lower as demand weakens.
Mortgage rates have moved deferentially for different segments, with first time buyers and low LVR refinance households getting good deals, while investors are paying significantly more. This is causing the market to rotate away from property investors.
Net rental returns are narrowing, so more investors are underwater, pre-tax. So the question becomes, at what point will they decide to exit the market?
We see a falling expectation of home price rises in the next 12 months, across all the DFA household segments. Property Investors are clearly re-calibrating their views, and this could have a profound impact on the market. We see a significant slide in the proportion of property investors and portfolio investors who are looking to borrow more. First time buyers remain the most committed to saving for a deposit, helped by new first owner grants, while those who desire to buy, but cannot are saving less. Those seeking to Trade Up are most positive of future capital growth. Foreign buyers will be less active in 2018.
So our view is that demand for property will ease, and the volume of sales will slide through 2018. As a result, the recent price falls will likely continue, and indeed may accelerate. We will be watching for the second order impacts as investors decide to cut their losses and sell, creating more downward pressure. Remember the Bank of England suggested that in a down turn, Investment Property owners are four times more likely to exit compared with owner occupied borrowers.
So risks in the sector will grow, and bank losses may increase.
More broadly, banks will remain in the cross-hairs though 2018 as the Royal Commission picks over results from their notice requiring banks, insurance companies and superannuation funds to detail all cases of misconduct from 2008 onwards. We expect more issues will surface. The new banking code which was floated before Christmas is not bad, but is really still setting a low bar and contains elements which most customers would already expect to see. This is not some radical new plan to improve customer experience, rather more recognition of the gap between bank behaviour and customer expectation. And it does not HAVE to be implemented by the banks anyway.
There is much more work to do. For example, how about proactive suggestions to switch to lower rate loans and better rates on deposits? What about the preservation of branch and ATM access? What about the full disclosure of all fees relating to potential loans? And SME’s continue to get a raw deal thanks to lending policy and bank practice (despite the hype).
Then the biggie is mortgage lending policy, where banks current underwriting standards are set to protect the bank from potential loss, rather than customers from over-committing.
We will get to hear about the approach to Open Banking, the Productivity Commission on vertical integration and the ACCC on mortgage pricing, as well as the outcomes from a range of court cases involving poor banking behaviour. APRA will also discuss mortgage risk weights. So 2018 looks like adding more pressure on the banks.
So in summary, we think we will see more of the same, with pressure on households, pressure on banks, and a sliding housing market. Despite this, credit is growing at dangerous levels and regulators will need to tighten further. We are not sure they will, but then the current issues we face have been created by years of poor policy.
Households can help to manage their financials by building a budget to identify their commitments and cash flows. Prospective mortgage borrowers should run their own numbers at 3% above current rates, and not rely on the banks assessment of their ability to repay – remember banks are primarily concerned with their risk of loss, not household budgets or financial sustainability per se. Regulators have a lot more to do here in our view.
Many will choose to spruke property in 2018 (we are already seeing claims that the Perth market “is turning”), and the construction sector, real estate firms, and banks all have a vested interest in keeping the ball in the air for as long as possible. Governments also do not want to see prices fall on their watch, and many of the states are totally reliant on income from stamp duty. But we have to look beyond this. If we are very luck, then prices will just drift lower; but it could turn into a rout quite easily, and don’t think the authorities have the ability to calibrate or correct a fall if it goes, they do not.
The bottom line is this. Think of property as a place to live, not an investment play. Do that, and suddenly things can get a whole lot more sensible.
That’s the Property Imperative Weekly to 30th December 2017. We will return in the new year with a fresh weekly set of objective news, analysis and opinion. If you found this useful, do leave a comment, or like the post, and subscribe to receive future updates. Best wishes for 2018, and many thanks for watching.
Startups like Afterpay that allow consumers to “instantly” borrow money for purchases are using a business model that has been around for centuries
It’s called “factoring” of accounts receivables. This is when a company sells its accounts receivables (money owed for a good or service that has already been delivered) to a lender, typically at a discount.
Typically, factoring arrangements are between a business and a lender, with the customer being oblivious to the arrangement. Afterpay’s innovation was to turn this centuries-old, back-office financial arrangement into something customer-facing.
In 2016-17, Afterpay generated about A$23 million in fees from retailers and another A$6.1 million in late fees. It wrote off only A$3.3 million in bad debt.
An example of traditional factoring would be a company selling A$100 in accounts receivables to a lender for A$95. The company gets A$95 cash up front (to spend on wages or ingredients) and eliminates the risk of not being paid. The lender makes a A$5 profit once the A$100 has been collected.
Similarly, if you make a A$100 purchase using Afterpay, the merchant immediately receives A$96. Afterpay then collects four instalments of A$25 from the customer, making a A$4 profit.
The A$4 difference is essentially the interest that Afterpay charges (equivalent to 4.17%). The unusual nature of the transaction is that Afterpay lends to the business and the customer repays Afterpay.
This is because of compounding interest. Suppose a A$1,000 loan is made on January 1 at an interest rate of 4%, for two months. On March 1, A$1,040 is collected – the original A$1,000 plus A$40 interest.
Another loan is made on March 1 – A$1,040 at a 4% rate, for two months. On May 1, A$1,081.60 is collected – the original A$1,040 plus A$41.60 interest.
This can be repeated again and again. By December 31 the initial A$1,000 has grown to A$1,265.32. This equates to a 26.5% annual interest rate.
Except Afterpay doesn’t have to wait two months to collect the entire amount as a lump sum. Instead, it collects the money lent in instalments, which means the the annual interest rate is approximately 30%!
So, what are the risks?
There are three reasons a merchant may enable Afterpay on their site. The merchant could make a sale it would otherwise not make, hence revenue increases. It’s collecting cash upfront, which improves its balance sheet. And the merchant eliminates the risk it won’t be paid if a customer defaults.
However, there is a risk to Afterpay if the customer defaults and does not pay the amount due. Afterpay’s business model is akin to factoring without recourse.
There are two types of factoring of accounts receivable – with and without recourse. In factoring with recourse, the lender will return uncollected debts to the business.
In factoring without recourse, the lender is responsible for the collection of unpaid invoices from the customer and cannot return them. In other words, when factoring with recourse the business retains the risk of non-payment.
To discourage this behaviour, Afterpay charges fines if the customer fails to make payments (a A$10 late fee, and a further A$7 after seven days). If the customer still does not pay, Afterpay writes off both the initial loan and the fines charged. The fines are still counted as revenue in Afterpay’s accounts.
The greater risk that Afterpay faces is not from the customers defaulting on their loans, but from those who aren’t even using the service.
Customers making cash or credit card purchases may soon demand that online merchants give them a 4% cash discount – the same amount they pay Afterpay. If merchants comply and give everyone a 4% cash discount, the uniqueness of Afterpay’s business model will suffer. The cost of its loans would no longer be invisible.
Author: Saurav Dutta, Head of School at the School of Accounting, Curtin University
Banking analysts have raised concerns after the number of home loans being approved despite not meeting serviceability requirements jumped to its highest point since before the global financial crisis.
Digital Finance Analytics Principal, Martin North told Mornings with Gareth Parker, we could be headed for some strife if rates go up.
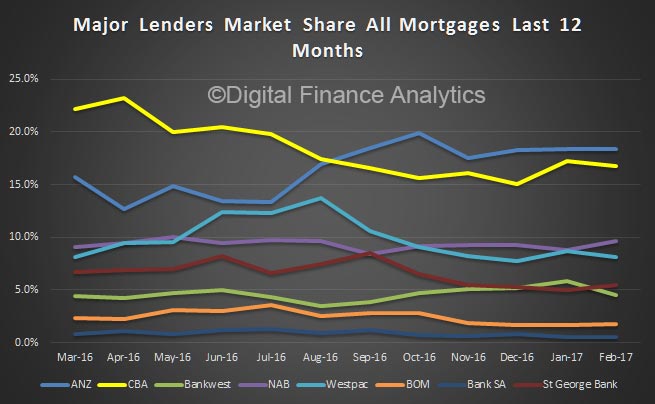
Further evidence of some majors deliberately dialing back their home loan origination via the broker channel is provided by data from AFG who reported in their latest Competition Index that the majors’ share of the market dropped again to 65.25% to continue the trend of the last six months. This is of course based on data though their books, so may not reflect the overall market, but is a fair indicator nevertheless.
Significantly, we see a fall by CBA and a rise by ANZ, both policy directed decisions. Some of the slack is being taken up by smaller lenders.
The major banks dropped their share of fixed rate mortgages at 56.66 per cent, down from 64.98 per cent on the quarter ending January 2017, and a significant 12 per cent down on a year ago.
Also, refinancing through the majors dropped to 54.93 per cent of market share, and investor mortgages to the majors fell to 67.56 per cent of market share, around 7 per cent lower than the same period last year.
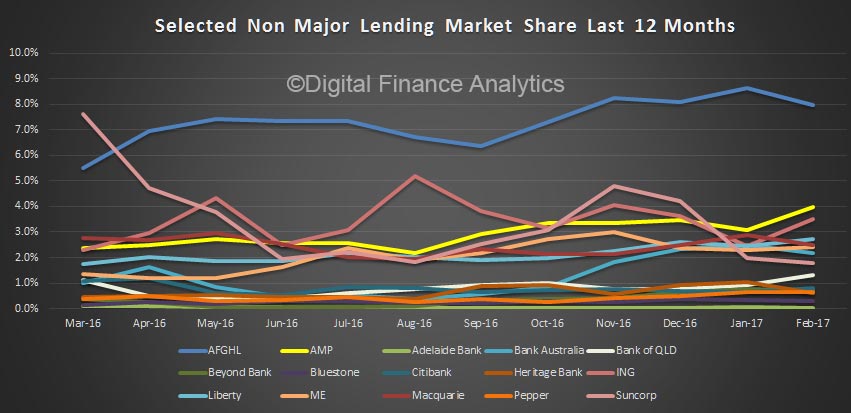
The recent political spotlight on the major lenders may encourage them to assess their competitive position as they once again fall out of favour with consumers. The non-major lenders have increased their market share to a post-GFC high of almost 35% across the quarter.
“The non-majors have continued to take market share from the majors this quarter, particularly among those seeking to refinance. Their share of the refinancing market grew by 6.5% with the big winners being AMP and ING,” said Mr Hewitt.
The non-majors also gained ground with those looking to fix their interest rate. Non-majors recorded an 8% lift in market share for fixed rates with ME Bank and ING leading the way.
First home buyers were also drawn towards the non-majors with a 2% gain in non-major market share evident from this group.
“Recent changes made by the Victorian state government to exempt first home buyers from stamp duty if they are purchasing a property for less than $600,000 will make this segment of the market one to watch,” said Mr Hewitt.
This latest move comes on top of a doubling of the first home buyers grant for regional purchases in that state and news of a $50 million pilot program designed to help people co-purchase a dwelling with the Victorian government set to launch next year.
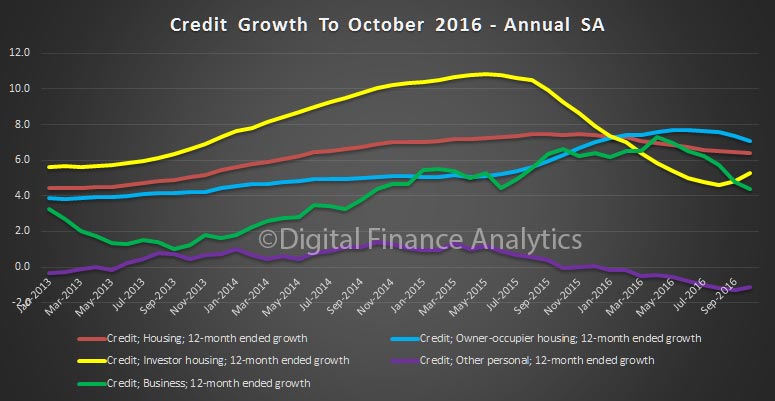
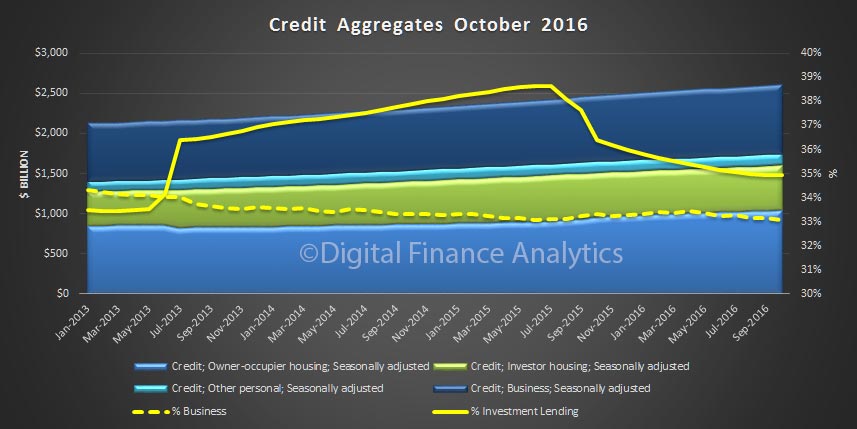
The RBA have released their Financial Aggregates for October 2016. Housing grew 0.6%, making an annual rate of 6.4%, still well above inflation. Personal finance was static, whilst business lending rose 0.5% making an annual rate of 4.4% (in original terms).
Looking at the seasonally adjusted data set, investment lending is growing at 5.3% and rising, owner occupied lending is 7.1% and falling, business lending is growing at 4.4% and falling, and other personal finance is down 1.1%. Investment lending is the only element to rise.
Looking at the detailed data, seasonally adjusted, owner occupied lending rose 0.54% in the month, by $6.6 billion, to $1.04 trillion, investment lending rose 0.59%, by $3.3 billion to $560 billion, and business lending rose 0.27%, by $2.3 billion to $864 billion.
We see therefore a fall in the relative share of lending to business, compared with housing, and the momentum in investment housing stronger than owner occupied housing. Both signs of trouble ahead. Investment lending is 35% of all housing, and business lending 33% of all banking lending.
There were further adjustments to loan classification in the month, just to confuse further. The RBA said:
Following the introduction of an interest rate differential between housing loans to investors and owner-occupiers in mid-2015, a number of borrowers have changed the purpose of their existing loan; the net value of switching of loan purpose from investor to owner-occupier is estimated to have been $46 billion over the period of July 2015 to October 2016, of which $0.8 billion occurred in October 2016. These changes are reflected in the level of owner-occupier and investor credit outstanding. However, growth rates for these series have been adjusted to remove the effect of loan purpose changes.

 Relatively, overall personal credit has grown at around 2.6% in the past 3 years. Within that, credit card debt has been static, ADI personal credit rose 2% but Alternative Lending credit rose 5%.