When Will The “Debt Elastic” Ping Back? – The Property Imperative Weekly 7th July 2018

Welcome to the Property Imperative weekly to 7th July 2018, our digest of the latest finance and property news with a distinctively Australian flavour.  By the way if you value the content we produce please do consider joining our Patreon programme, where you can support our ability to continue to make great content. Here is the link.

Watch the video, listen to the podcast, or read the transcript.

This week the RBA left the cash rate on hold once again at 1.5% and continued the trend of doing nothing. In fact, reading the release from Tuesday, it is worth noting two things. First they are being very gentle in referring to home price falls, saying “Nationwide measures of housing prices are little changed over the past six months. Conditions in the Sydney and Melbourne housing markets have eased, with prices declining in both markets. Housing credit growth has declined, with investor demand having slowed noticeably. Lending standards are tighter than they were a few years ago”. Second, we think they would like to lift rates to more normal levels, but cannot thanks to high debt, and downside risks. They are stuck. I believe the next move will be down as the economy weakens (dragged down by the fading property market, rising interest rates internationally, and concerns about China’ economic dynamo). But not yet.

Now compare this with a BIS report also out this week. The BIS is worried by the current low interest rate environment, and in a new report by a committee chaired by Philip Lowe, warn of the impact on financial stability across the financial services sector, with pressures on banks via net interest margins, and on insurers and super funds.  They warn that especially in competitive markets, risks rise in this scenario.  Low interest rates may trigger a search for yield by banks, partly in response to declining profits, exacerbating financial vulnerabilities. In addition, keeping rates low for longer may create the need to lift rates sharper later with the risks of rising debt costs and the broader economic shock which follows. A salutatory warning! We discussed this in more detail in our post “To “Bail-In” Or To “Bail-Out”, That Is Indeed The Question”.

The contrast between the theoretical macro policy position, and the local situation here in Australia, must at very least be giving Mr Lowe a bit of a headache!

The trajectory of global rates is upwards as we will discuss later. The latest from the FED is that further rate rises are required, and expected. So the FED is doing what the BIS report suggested. But the net result is pressure on Bank funding here, remember that around 30% of bank funding comes from overseas and the BBSW is higher still.

Two points to make here. First as credit availability is the strongest influence of home prices, the easy access to international capital markets the banks have had in recent years meant they could lend more, up to 30% more, hence disastrously higher home prices. Second the weight of evidence is that more banks will lift rates.  Citigroup for example, forecasts that the rising cost of funding will prompt Australia’s four major banks to increase their mortgage interest rates independently of the RBA, with the banks tipped to begin lifting their mortgage rates by an average of eight basis points by September. Citigroup adds that the rise in banks’ short-term funding costs since early 2018 is likely to be sustained.  And in effect the tenor of the RBA minutes signals to the banks they can go ahead and lift rates.

As rates have fallen, households have leveraged up, supported by lose lending policy and driving home prices to massive multiples of household income as data from IFM Investors showed this week.

And even small rate rises will hurt, as we showed in our latest Mortgage Stress release for June, which was out this week. Mortgage stress continues to rise. Across Australia, more than 970,000 households are estimated to be now in mortgage stress (last month 966,000). This equates to 30.3% of owner occupied borrowing households. In addition, more than 22,000 of these are in severe stress. We estimate that more than 57,100 households risk 30-day default in the next 12 months. We expect bank portfolio losses to be around 2.8 basis points, though losses in WA are higher at 5.2 basis points.  We continue to see the impact of flat wages growth, rising living costs and higher real mortgage rates. We discussed this in our post “The Debt Pips Are Squeaking”, in which we also discussed the latest anaemic retail sales figures, and the latest household debt to income ratio from the RBA which are now at a record 190.1. We are literally drowning in debt. And its structural.

The Australian Institute of Health & Welfare released a new report showing that home ownership is out of reach to growing numbers of Australians, thanks to high prices and poor affordability.  They say that over the last 20 or so years Australia has seen a shift from outright ownership to owning with a mortgage, and a shift from overall home ownership to private rental Between 1995 and 2015, the proportion of outright owner-occupied households fell from 41.8% to 30.4%. Comparatively, the proportion of households owning with a mortgage has increased, from 29.6% to 37.1%, over the same period. Overall, the proportion of households in home ownership fell from 71.4% to 67.5%. There has also been an increase in the proportion of households renting privately (from 18.4% to 25.3%), and a decline in the proportion of households renting through state and territory housing programs (from 5.5% to 3.5%). Equally telling is home ownership rates between 1971 and 2016, by selected 5-year age groups. The home ownership rate of 30–34 year olds was 64%, and 50% for 25–29 year olds, in 1971. Forty-five years later these rates have decreased notably, with the home ownership rate of 30–34 year olds falling 14 percentage points to 50%. Similarly, that of 25–29 year olds fell 13 percentage points (to 37%). While declines are evident for other age groups they are much less marked. So fewer Australians are tending to own their home at retirement. For Australians nearing retirement, for example, age groups 50–54, 55–59, and 60–64, home ownership rates peaked in 1996 at 80%, 82% and 83%, respectively Since 1996 however, there has been a gradual decline in home ownership rates, most notably in the 50–54 age group which has seen a 6.6 percentage point fall over these 20 years (from 80.3% to 73.7%). This is one reason why we are watching closely our “Down Trader” segment – people seeking to sell and release capital. There are 1.2 million in this state, compared with around 600,000 up Traders, and 150,000 first time buyers. So on simple supply demand logic, more people selling than buying means prices will fall further.

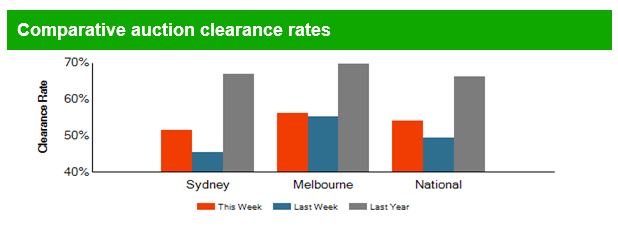
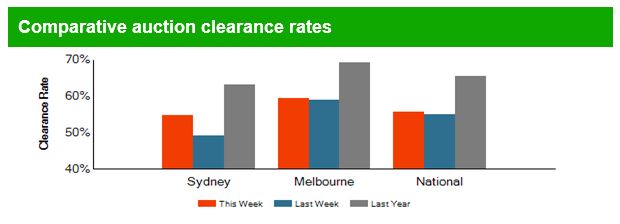
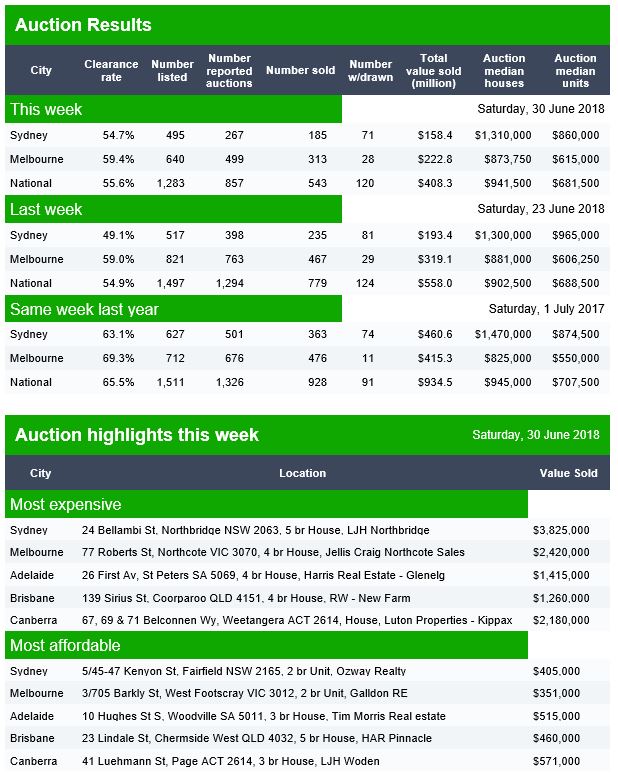
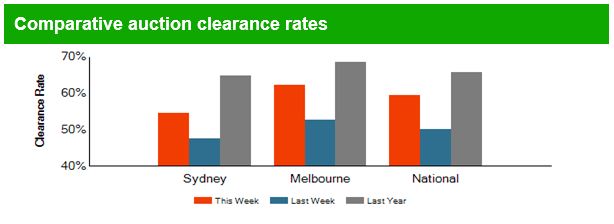
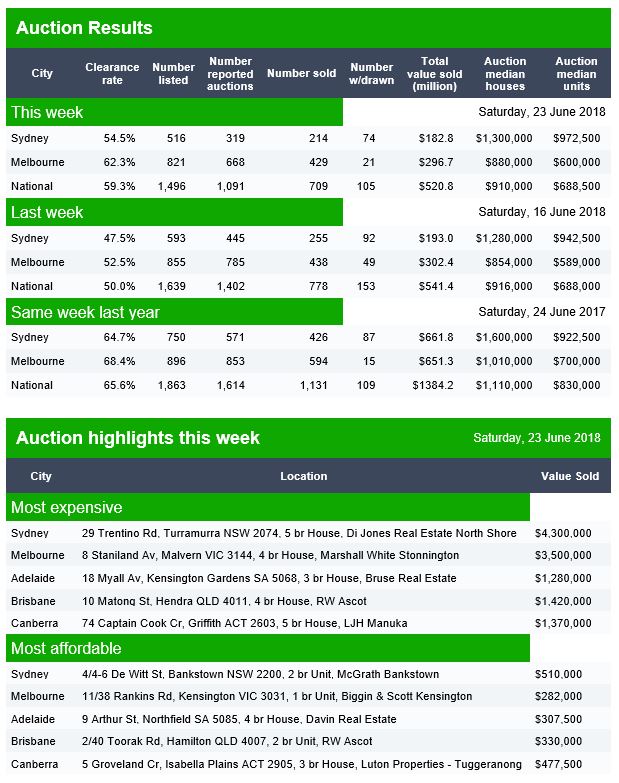
And on that note, CoreLogic said that the weighted average clearance rate has tracked below 60 per cent for 8 consecutive weeks now, while over the same 8-week period last year clearance rates were tracking within the low 70 to high 60 per cent range. Last week Melbourne’s final auction clearance rate fell to 57.2 per cent across a lower volume of auctions week-on-week with 791 held, down on the 941 auctions over the week prior when a higher 59.9 per cent cleared. In Sydney, less than half of the homes taken to auction sold last week. The city returned a final auction clearance rate of 49.7 per cent, down slightly on the 50.1 per cent the previous week, with volumes across the city remaining relatively steady over the week with a total of 634 held. All of the remaining auction markets saw a lower volume of auctions last week, with the final clearance rate across each market also falling week-on-week.  There were also a large number of passed in auctions.

Gerard Minack from Minack Advisors said this week that the housing market looks ‘thin’, hinting that prices may be unusually sensitive to a change in demand. Historically housing market turnover tracked price growth. However, turnover has been soft relative to price gains over the past 3-4 years, and in the March 2018 quarter turnover fell to the lowest level since the 1990 recession.

There are still many economists talking of just a small slide in prices over the next few months, but we suspect they are underestimating the impact of tighter credit. For example, Macquarie suggested from their annual mystery shopping survey mortgage power – the amount people could get when applying for a mortgage had not dropped that much at all. But in fact, it seems the non-banks, those not under so much scrutiny from APRA is where the bigger loans reside.

Whereas UBS, the arch property bears, suggest that credit tightening will continue, as lending flows ease, saying one of the key recommendations of the Royal Commission is likely to be a stricter interpretation of Responsible Lending. In particular “reasonable steps” required to verify customers’ financial positions. This is likely to require credit licensees (banks and non banks) to verify living expenses from customers’ transaction banking and credit card data over a period of around 12 months. They go to say that as ANZ stated in its submission to the Royal Commission, verifying living expenses from transaction accounts and credit cards is operationally complex and will likely require substantial investment in technology to automate this process. So UBS believes that while the major banks will be able to absorb these costs, such technological investments may be prohibitive for many of the smaller players. Therefore, they believe that any potential regulatory mismatch benefiting the smaller banks and non-banks is unlikely to be sustainable. In other words, credit will be tighter soon, driving prices lower.

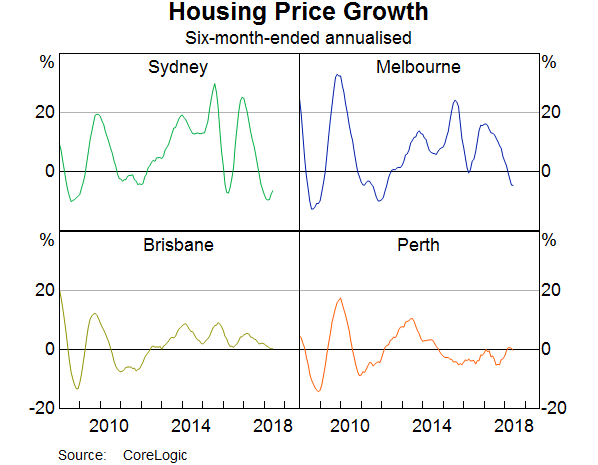
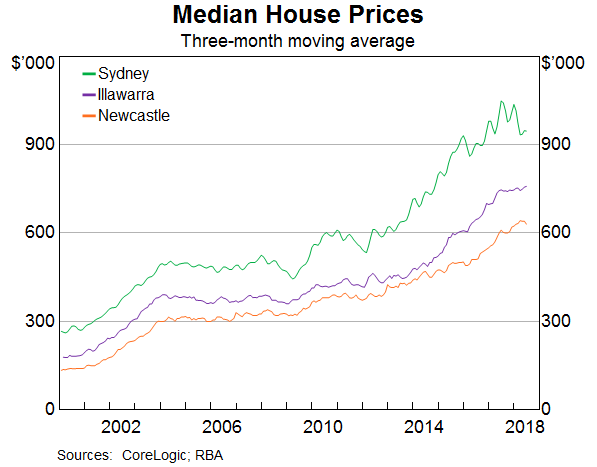
The Corelogic’s Housing Index showed that prices slipped again last week in Sydney, down 0.13%, Melbourne down 0.11%, Adelaide down 0.01% and Perth down 0.07%.  Brisbane rose 0.02%. On a 12 month basis, Sydney on average has dropped 4.69%, while Perth has fallen 2.08%. The other centres have risen just a little. But it is worth remembering that Sydney prices are still 66% from the last trough, Melbourne 56%, Brisbane 21% and Adelaide 19%. Perth is only 0.4% higher, thanks to the prevailing weak economic conditions in the West. This weakness also has translated into rental rates, with Perth seeing just a 3% rise over the past 10 years for houses, and a small fall for units. Compare this with a national rise in rentals over the same period of 25.7%. At the other end of spectrum rentals rose 53.8% for Hobart houses, and 44.7% for units, highlighting the housing cost pressure there.

Despite the falls in property values, and the expected future further falls, the AFR said Labor has shrugged off suggestions from the property industry that its planned changes to negative gearing rules should be scrapped because of market conditions. They reported that Shadow treasurer Chris Bowen told a Property Council of Australia forum in June the changes were about making long-term structural adjustments, rather than addressing the short-term cycle. The policy was a once in a generation reform. We think he is right.

The Royal Commission in Darwin this week heard about the thousands of Aboriginal people who are sold unsuitable financial products and vulnerable consumers are targeted by instant cash loan machines because the financial landscape supports predatory practices. Insurance agents were able to exploit and target Aboriginal people because the industry isn’t fully regulated. An excellent The Conversation Article made the point that the cultural, economic and political arrangements that allow this to happen are called “practice architectures”. They include the complex language used to deceive consumers into buying unsuitable products, incentivised high pressures sales tactics, and a lack of care and concern for vulnerable consumers. All of these aspects are within the scope of financial regulators. The funeral insurance industry can push dodgy products because no one is watching. Predatory financial practices will continue until governments and/or regulators do something about it.

More evidence of regulators not doing their job, and the financial sector simply exploiting their customers to make a quick buck.

We heard this week that ASIC has accepted court enforceable undertakings from the Commonwealth Bank of Australia and Australia and New Zealand Banking Group under which the banks have agreed to change the way they distribute superannuation products to their customers. ASIC investigated CBA’s distribution of its Essential Super product and ANZ’s distribution of its Smart Choice Super and Pension product through bank branches. ASIC found a common practice of offering those products to customers at the conclusion of a fact-finding process about customers’ overall banking arrangements. ASIC was concerned that customers may have thought, due to the proximity of the fact-finding process to the offer of Essential Super or Smart Choice Super, that the CBA branch staff or the ANZ branch staff were considering risks specific to the customer when this was not the case. These court enforceable undertakings prevent CBA from distributing Essential Super in conjunction with a Financial Health Check and ANZ from distributing Smart Choice Super in conjunction with an A-Z Review. They also require CBA and ANZ to each make a $1.25 million community benefit payment. If there is a breach of the undertaking ASIC can, under the ASIC Act, apply for orders from the court to enforce compliance.  But whilst individuals risk being sent to prison as one Perth finance  broker, did this week, or permanently banned from the finance industry for loan fraud, the asymmetric penalties  between the small guys and the big firms is – well shameful.  It seems to me regulators are going for the easy targets who cannot fight back, whilst imposing mild penalties on the big guys, for fear of court proceedings. The balance is just wrong.

Finally, looking across the markets, shares in Australia started the new financial year well, with most banking stocks going higher. Bendigo Bank was up 1.72%, Suncorp up 0.54% and even the languishing Bank of Queensland rose 0.77%. Westpac was up 0.85%, ANZ up 1.97% on its buybacks, NAB up 1.6% and CBA up 1.2%, though still below its peak in 2017 when it was above $82. So risks in the mortgage book are clearly not worrying investors that much just now. This despite the 90-Day mortgage default rates going higher as reported in the S&P Ratings SPIN Index. Macquarie, who has more business offshore than on shore rose 0.42%, at 122.96, just off its all-time highs, The ASX 200 ended higher up 0.91% to 6,272, a solid rise. The Aussie Dollar did a little better too against the US Dollar settling at 74 cents, up 0.57% and against the Chinese Yuan up 0.7% to $4.94.

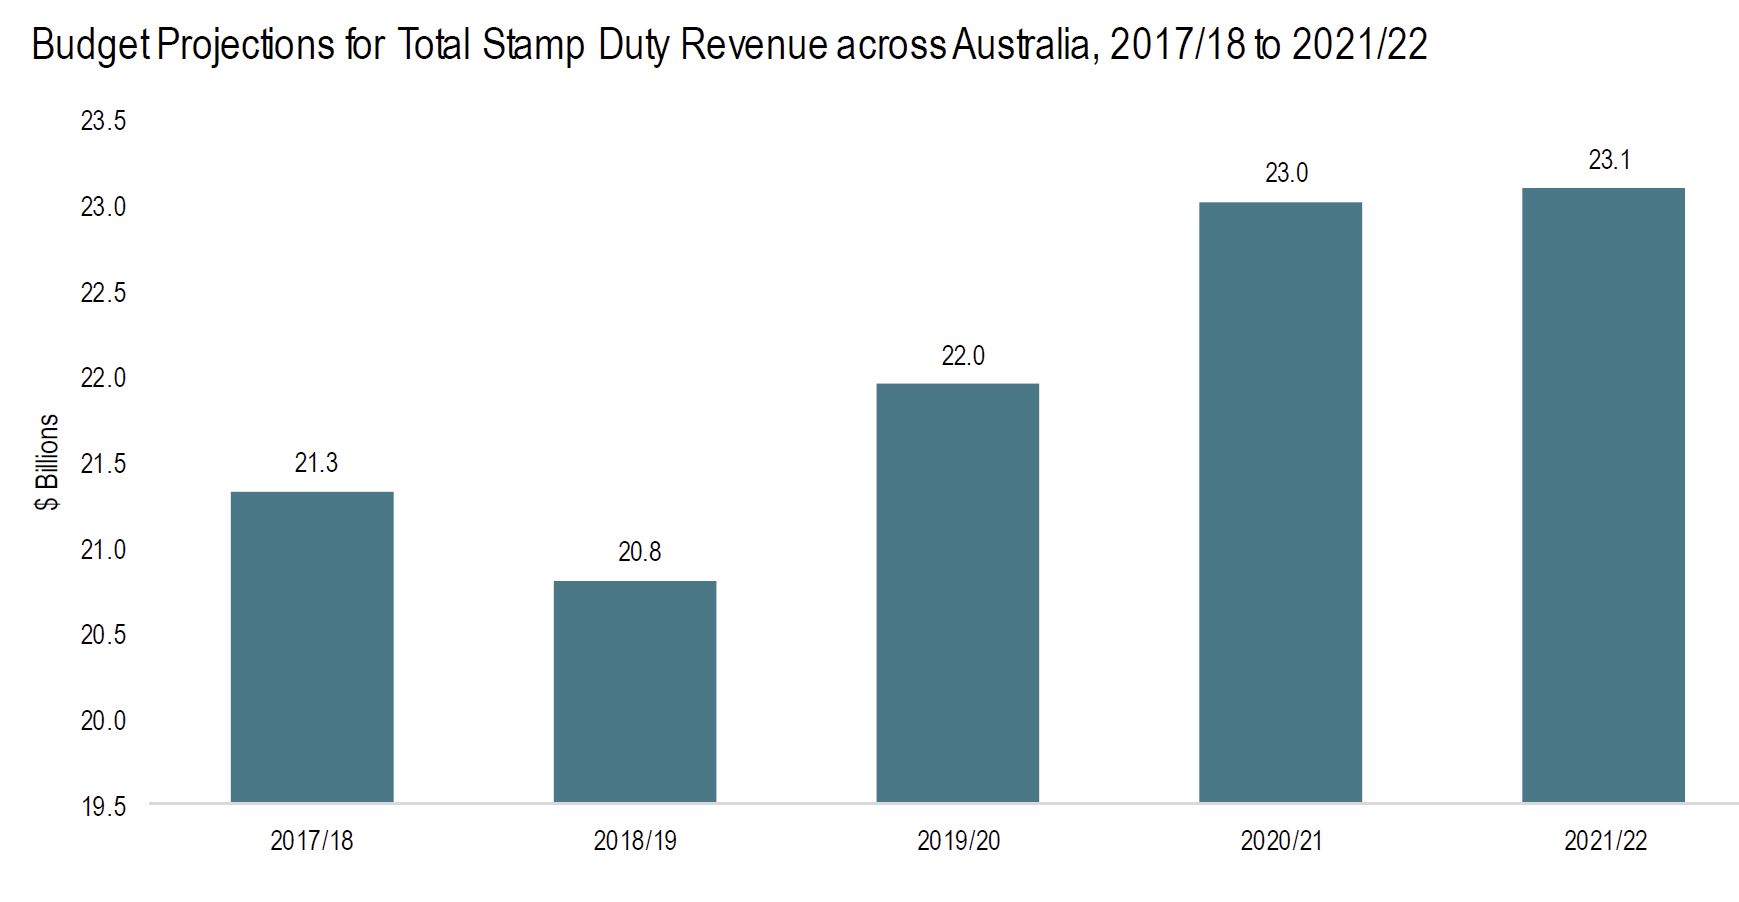
Now back to global debt. Deutsche Bank published a chart which showed that of the $50 trillion global bond market, about $8 Trillion of these bonds are now trading at negative interest rates, thanks to changes in interest rates across the market. Within the $50 trillion, the amount of nonfinancial corporate bonds has increased 2.7 times over the past decade to $11.7 trillion, according to Mckinsey. Debt in China has outgrown that in the USA, based on GDP, with non-financial corporate debt in China sitting at 160% of GDP, compared with 97% in the USA, according to JP Morgan. The China credit boom, is well, booming…

This all signals more trouble ahead, given that the US 3 Month bond rate and LIBOR are sitting at highs, and the 10 Year US Bond Rate remains elevated, reflecting the expectation of more FED rate hikes ahead.  And the latest from the FED is that further rate rises are required, and expected.

U.S. stocks finished the week mostly higher, thanks mainly to low-volumes of buyers on Friday. The S&P 500 finished the week up about 1.5% and the Dow ended about 0.8% higher for the week. The big winner was the tech-heavy NASDAQ Composite, which closed up about 2.4% for the week. The DOW ended the week up 0.41% to 24,456 after light holiday trading.

US employment data showed still-solid growth in payrolls, but lower-than-expected wages, which eased inflation concerns. Nonfarm payrolls rose by 213,000 in June. That was higher than the consensus estimates of 200,000. The jobless rate unexpectedly rose to 4.0% from 3.8%, missing consensus expectations for it to remain unchanged as more people entered the labor force. Average hourly earnings advanced 0.2% month-on-month in June, below expectations. The data still suggests the Federal Reserve will gradually raise interest rates. The markets are still pricing in two more rate hikes this year.

The real unknown though is the U.S, China Trade Battle which is now officially underway. The U.S. has put tariffs in place on $34 billion worth of Chinese goods and the Chinese hit right back with tariffs on $34 billion on U.S. goods going into effect. China said the U.S. had “launched the largest trade war in economic history to date.” And the U.S. administration is already looking at ramping up the amount of tariffed goods, threatening another 16 billion dollars in two weeks, and then more later. No one knows where this will lead. But there are risks for Australia and other countries getting caught in the cross-fire.

The U.S. dollar endured a tough week that was not helped by the mixed jobs numbers that offered little encouragement for traders looking for faster Fed hikes. The dollar index, which compares the greenback to a basket of six currencies, was down about 0.7% for the week. The dollar also faced pressure from the euro during the week. German Chancellor Angela Merkel resolved an immigration battle and with her interior minister that had threatened the future of her coalition government.

Oil continued higher through the week, as supply limits kicked in, up 1.33% to 73.91, and Gold fell again, down 0.23% as risks abated.

And finally, Bitcoin recovered a little to 6,615 but remains volatile, while the broader VIX index sits slightly above the lows seen last year, but below the peak of a few months back.

So it seems that investors are banking on the debt elastic not snapping back anytime soon, but we will be watching for further signs of stress given the massive amount owing out there as rates rise. Meantime banks are making hay, despite the levels of uncertainly out there.  As the BIS report put it “A key takeaway is that, while a low-for-long scenario presents considerable solvency risk for insurance companies and pension funds and limited risk for banks, a snapback would alter the balance of vulnerabilities,”. We have been warned.

Before I sign off, mark your diary. On the 17th July at 8 PM Sydney time I will be running our next live streaming session, where you can discuss in real time the issues in play. Judging by the previous session, it will be a lively event. I will schedule it shortly on our YouTube channel.

Auction Results Continue To Weaken

The preliminary data from Domain is out, and the trends continue lower, with a final rate last week below 50% nationally and continued weakness this time around. Many properties are being withdrawn.

In Sydney, of the 442 listed, 84 were withdrawn, and 179 sold. In Melbourne, 526 were listed, 29 withdrawn and 236 sold. Last year at this time, clearance rates were more than 10% higher, on larger volumes.

Brisbane listed 57, 6 were withdrawn and 17 Sold. Adelaide listed 43, withdrew 1 and sold 13. Canberra listed 47, sold 30 and 3 were withdrawn.


The Outlook for Housing – RBA

RBA’s Head of Economic Analysis Department, Alexandra Heath, spoke at the Urban Development Institute of Australia, Wollongong  and discussed housing, including some data on the Illawarra.

Dwelling investment has gone from making a positive contribution to growth two years ago to being roughly flat over the year to March. In terms of our forecasts, dwelling investment is not expected to contribute much to growth over the next couple of years, but is expected to remain at a high level.

To understand the outlook, it is helpful to recognise that there isn’t a single national housing market. At the state level, there have been some similarities in the evolution of dwelling investment, but there have also been distinct differences (Graph 5).

Graph 5
Graph 5: Real Dwelling Investment


One point of similarity is that the construction of higher-density apartments has been much more important than in the past, especially in the east-coast capitals. We have used our liaison program quite extensively to understand how to adapt our forecasting processes to take into account that the time taken for a building approval to progress to construction and the period of construction is longer and more variable for high-density projects than for detached dwellings. The liaison program, which includes organisations such as the UDIA and its members, has also allowed us to gain deeper insights into specific local factors, such as differences in planning rules and the emergence of capacity constraints in the housing construction sector.

One point of difference across states has been the timing of dwelling investment cycles. For New South Wales and Victoria, the level of dwelling investment has been broadly stable at a high level since 2016. In contrast there has been a decline in higher-density construction in Queensland since early 2017. In Western Australia, residential construction peaked in mid 2015, which was well after the end of the mining boom. These differences highlight the fact that there are different demand and supply forces at work across the states. Given time constraints, I am going to focus my attention on the demand side of the market.

An important driver of housing demand over the long run is the rate at which new households are being formed. This depends on population growth and changes in the average number of people who are living in each household. Household size declined steadily in Australia between 1960 and 2000 before levelling out, alongside declines in marriage and fertility rates and population aging. The natural increase in the Australian population has also declined over time due to demographic factors. In particular, lower fertility rates have offset increased life expectancy (Graph 6). Having said that, the rate of natural increase in Australia’s population remains higher than in most other advanced economies.

Graph 6
Graph 6: Population Growth


Immigration has also been a feature of the population growth story and it has certainly been the dominant influence on the swings in population growth over the past decade. The largest single category of net overseas migration has been people on temporary student visas (Graph 7). Prior to the financial crisis, a large share of these students were coming to Australia for vocational training courses. Following changes to visa requirements, student visa numbers initially dropped, but have picked up again in recent years, mostly due to an increase in students attending university. To put this into perspective, education now accounts for around 10 per cent of Australia’s total exports, which is in the same ball park as our rural exports. From the perspective of demand for housing, the important point is that most of these students have gone to Sydney and Melbourne.

Graph 7
Graph 7: Net Overseas Migration


Another interesting category is skilled workers. The net inflow of people on skill visas increased in response to demand for workers during the mining boom. Most of these workers went to Western Australia and Queensland. At the same time, net migration to Western Australia and Queensland from other states and New Zealand also increased. As the mining sector transitioned from the construction to the production phase of the mining boom, the demand for labour fell. The number of people on skilled visas fell and the inflow of people from New Zealand and other Australian states turned to an outflow.

As a consequence, there have been quite large differences in population growth at the state level, which have had direct effects on the demand for housing (Graph 8). Population growth is expected to remain strong, particularly in Victoria and New South Wales, and the net overseas migration component of this is expected to be driven by people on student visas.

Graph 8
Graph 8: Population Increase and Dwelling Investment


On the supply side, the pipeline of residential construction that has been approved, but not completed remains high in New South Wales and Victoria (Graph 9). There is also a reasonable pipeline of work in Queensland, although it has already started to decline. Based on recent approvals data and expected demand conditions, this suggests that dwelling investment in New South Wales and Victoria will remain at a high level for a number of years. Liaison contacts have suggested to us that capacity constraints in the construction industry, particularly in New South Wales, will make it difficult for construction activity to increase.

Graph 9
Graph 9: Residential Dwelling Pipeline


Of course household formation and population growth are not the only drivers of housing demand. For example, interest rates and changes in lending standards can also influence how much households are willing and able to spend on housing. Another way to gauge the current balance of housing supply and demand is to look at housing price growth.

Over the past five years, housing price growth has been subdued in Brisbane and Perth (Graph 10). This is consistent with the fall in population growth coinciding with an increase in the supply of housing. In contrast, housing price growth has been strong until recently in Sydney and Melbourne, where population growth has been strong. Given that housing accounts for around 55 per cent of total household assets, we are paying close attention to these developments.

Graph 10
Graph 10: Housing Price Growth

The Housing Market in the Illawarra Region

From a demand perspective, the Illawarra region has experienced a pick-up in population growth. Some of this has come from overseas students attending the University of Wollongong, and some has come from people migrating to the Illawarra region from Sydney. Although the Illawarra region is a little older, on average, than the rest of Australia and Sydney, it still has a large working-age population (Graph 11).

Graph 11
Graph 11: Age Distribution


This is partly because its geographic proximity and transport infrastructure allow people living in Wollongong and the Illawarra region to commute to Sydney. Around 20 per cent of Wollongong workers commute at least 50 kilometres to work (Graph 12). This is one of the highest rates in the state. Unsurprisingly, five of the seven areas with higher shares of people commuting more than 50 kilometres are also within commuting distance of Sydney. Illawarra residents are also well placed to benefit from the fact that some of the fastest growing areas of Sydney are in south and south-west, including the proposed “aerotropolis” around the new airport at Badgery’s Creek. Access to these growth areas will be enhanced if some of the recently announced transport infrastructure plans are realised.

Graph 12
Graph 12: Distance to Work 50+ km in NSW


Although people from the Illawarra region can and do commute to Sydney, labour market conditions in the Illawarra region itself have also been strong recently (Graph 13). In combination, these factors mean that there has been strong employment growth for those living in the Illawarra region over the past five years and the unemployment rate is close to the average for New South Wales, which is, in turn, lower than the Australian unemployment rate.

Graph 13
Graph 13: Labour Market


Strong population growth and the economic prosperity associated with strong labour market outcomes have led to higher housing prices in the Illawarra region (Graph 14). Just as in Sydney, developers have responded to the higher prices, and dwelling investment in the region has increased. Also similarly to Sydney, there has been a debate about whether the infrastructure has been growing fast enough to accommodate the needs of an expanding population and the increase in construction that goes with that.

Graph 14
Graph 14: Median House Prices

Conclusion

In summary, over the past couple of years, non-mining business investment has become a more important driver of growth in the Australian economy. This is a good thing because investment of this kind is necessary to ensure future productivity growth, which is ultimately what contributes to the economic prosperity and welfare of the Australian people. Infrastructure investment has been a part of this story.

At the same time, dwelling investment growth has eased off. Although dwelling investment is still expected to remain at a high level, particularly in New South Wales and Victoria, it is not likely to contribute much to growth over the next couple of years. Demand for housing remains strong because population growth is expected to stay strong. However, the housing story is different across states and across regions within states, partly because population trends differ. The effects of the mining investment cycle on population trends and housing markets in Western Australia is a clear-cut illustration of this point.

The data show that population trends and housing market developments in the Illawarra region are closely linked to those in Sydney, partly because the transport infrastructure allows people to live in the Illawarra region and commute to Sydney. Future transport infrastructure plans and the development associated with the Badgery’s Creek airport are likely to strengthen these ties. As always, the key to effective urban development is high-quality, transparent cost-benefit analysis of potential infrastructure projects informed by local knowledge. The UDIA has an important role to play here. The UDIA and its members, in Wollongong and elsewhere, also have an important role to play in macroeconomic policy by informing the Bank’s understanding of the factors at play in different housing markets through our liaison program.

You Can Now Support DFA On Patreon

We have just launched a DFA page on Patreon.

As you know, if you’re after intelligent insight which is independent and data driven on Australian Finance and Property, DFA is the place to come, because whether you own property, are thinking of buying, are a saver, or just a user of financial services, you will find our content immediately relevant. Information is power, data is the lifeblood of insight and we offer objective analysis and balanced insights.

We have been able to release new content most days via our social media channels, including videos on YouTube, podcasts and via this blog, but this is taking significant time and effort, to the point where it is crowding out our other business ventures. So to keep the content coming, and to develop the channel further, (we have some great plans) we need your help.

Using Patreon you can elect to subscribe via various tiers on a monthly basis to either help fund our ongoing production costs or to get access to additional content including behind the scenes and additional interviews, plus polls on future content. In particular, this will help to cover the costs of the interviews we produce.

More importantly, it shows that you value the efforts we are putting in, and the importance of what we are doing.

So please go ahead and subscribe via Patreon, and enjoy the content as it is released. Your contribution will be greatly appreciated and it will ensure the insights keep flowing.

There is a new menu item on the blog: Support DFA On Patreon.

We decided to go down this route, rather than adding adverts across this site. So subscribing via Patreon will keep our blog ad. free!

Dwelling Approvals Fall in May

The number of dwellings approved in Australia fell by 1.5 per cent in May 2018 in trend terms, according to data released by the Australian Bureau of Statistics (ABS) today.  At is all about a fall in unit approvals, with a notable decline in Melbourne.  Expect more falls ahead, a further signs of trouble in the housing sector.

“Dwelling approvals have weakened in May, driven by a 2.6 per cent fall in private dwellings excluding houses,” said Justin Lokhorst, Director of Construction Statistics at the ABS.

Among the states and territories, dwelling approvals in May fell in Queensland (4.2 per cent), Victoria (2.7 per cent), Tasmania (2.0 per cent) and Western Australia (0.8 per cent) in trend terms.


Dwelling approvals rose in trend terms in South Australia (4.3 per cent), Northern Territory (2.8 per cent) and Australian Capital Territory (1.5 per cent), and were flat in New South Wales.

In trend terms, approvals for private sector houses fell 0.5 per cent in May. Private sector house approvals fell in Queensland (1.7 per cent), Western Australia (0.6 per cent), South Australia (0.4 per cent) and New South Wales (0.2 per cent). Private sector house approvals were flat in Victoria.

In seasonally adjusted terms, total dwellings fell by 3.2 per cent in May, driven by a 8.6 per cent decrease in private sector houses. Private sector dwellings excluding houses rose 4.3 per cent in seasonally adjusted terms.

The value of total building approved fell 0.7 per cent in May, in trend terms, and has fallen for seven months. The value of residential building fell 0.8 per cent, while non-residential building fell 0.4 per cent.

The HIA said:

“The market is cooling for a number of reasons including a slowdown in inward migration since July 2017, constraints on investor finance imposed by state and federal governments and falling house prices.

“A slowing in Australia’s population growth since June 2017 coincides with changes to visa requirements announced early last year. Since then Australia has experienced almost a year of slowing population growth.

“Finance has become increasingly difficult to access for home purchasers. Restrictions on lending to investors and rising borrowing costs have seen credit growth squeezed. Falling house prices in metropolitan areas have also contributed to banks tightening their lending conditions which have further constrained the availability of finance.

Auction Results 30 June 2018

Domain have released their preliminary auction results for today, and the anemic results are likely to slide further as the final results come in.

Momentum is significant lower than this time last year.

Brisbane listed 62 properties, 35 went to auction and 12 sold, giving a cleared rate of 24%. 14 were withdrawn.

Adelaide listed 52, 32 went to auction and 20 sold, giving a clearance rate of 61%. 1 was withdrawn.

Canberra listed 34, 24 went to auction and 13 sold, giving a clearance rate of 43%. 6 were withdrawn.


A Year In A Day – The Property Imperative Weekly 30 June 2018

Welcome to the Property Imperative weekly to 30th June 2018, our digest of the latest finance and property news with a distinctively Australian flavour.

Watch the video, listen to the podcast or read the transcript.

On the global stage, U.S. stocks were met with heavy selling pressure this week as the trade war hotted up. While earlier in the week, Donald Trump decided against imposing measures to restrict Chinese investment in U.S. based technology, the market is still reacting to the initial U.S. and Chinese tariffs which are coming into effect next week. In the world of bricks and click, Amazon was back in the headlines after the e-commerce giant announced its entry into the pharmacy sector with the purchase of Pillpoint. This triggering widespread panic, sending shares of brick-and-mortar drug stores sharply lower. Nike, meanwhile, showed improved results after revealing its first positive North America sales number in over a year. The S&P 500 closed 0.08% higher to close 2,718.37.

Boomberg says a leaked report from a Chinese government-backed think tank has warned of a potential “financial panic” in the world’s second-largest economy, a sign that some members of the nation’s policy elite are growing concerned as market turbulence and trade tensions increase.    Bond defaults, liquidity shortages and the recent plunge in financial markets pose particular dangers at a time of rising US interest rates and a trade spat with Washington, according to a study by the National Institution for Finance & Development The think tank warned that leveraged purchases of shares have reached levels last seen in 2015 – when a market crash erased $US5 trillion of value.     “We think China is currently very likely to see a financial panic,” NIFD said in the study, which appeared briefly on the internet on Monday, before being removed. “Preventing its occurrence and spread should be the top priority for our financial and macroeconomic regulators over the next few years.” The Australian dollar fell against the Chinese yuan from March to early May.

The China effect is on top of damming criticism of Central Bank’s policy by the Bank For International Settlements, which we discussed in our post “Red Alert From The Bankers’ Banker”. They say, economies are trapped in a series of boom-bust boom-bust cycles which are driving neutral interest rates ever lower and driving debt higher. The bigger the debt the worse the potential impact will be should rates rise (as they are thanks to the FED). Yet in each cycle “natural” interest rates are driven lower. Implicitly the current settings are wrong. This was in the Bank for International Settlements latest annual report. They also discussed how banks are fudging their ratios using Repo’s  in our post “Are Some Banks Cooking the Books?” Within its 114 pages, the BIS report painted a worrying picture of where the global economy stands. In fact, the risks in the global monetary system remain from the Lehman crisis in 2008 and aggregate debt ratios are almost 40 percentage points of GDP higher than a decade ago.

Crude oil prices were strongly up, their highest since November 2014 extending a rally for a fourth-straight week as focus shifted to the prospect of deeper losses of Iranian crude supplies as the U.S. threatened sanctions on countries that fail to halt Iranian crude imports by Nov. 4. Then there were unexpected disruptions in Canada, Libya and Venezuela, together curbing supply and in addition, U.S. crude supplies fell by 9.9 million barrels. Crude futures settled 65 cents higher on Friday as data showed U.S. oil rigs counts fell for the second straight week, pointing to signs of tightening domestic output.

The US dollar was roughly unchanged for the week as heavy selling pressure on Friday reversed earlier gain after the euro rallied sharply on news of EU members agreeing on measures to tackle the migrant crises in the EU including stepping up border security and setting up holding centers to handle asylum seekers. A signal of easing political uncertainty within the bloc sent the EUR/USD sharply higher, to $1.1677, up 0.94%. The US dollar fell 0.82% to 94.22 against a basket of major currencies on Friday.

Gold tumbled further again this week and suffered its biggest monthly slump since September as investors preferred the US$. This was partly because the FED indicated they were comfortable with inflation running above the inflation target over the near-term, in reaction to the news that inflation hit the Fed’s 2% target for the first time since May 2012, raising the prospect of a faster pace of rate hikes.

And the crypto crunch continues. Bitcoin for example went below $6,000 and it could go lower still. No one is sure where the firm base is, so expect more volatility ahead.

And talking of volatility the COBE VIX index ended the week at 16.09, having been higher earlier in the week, up from the 10-12 range seen earlier in the year, but well below the peaks seen in February. As an indicator of perceived risk, this suggests there are more in the system than last year.

Locally the Australian Dollar ended at 74 cents, and the trend down since February is striking, perhaps mirroring rising UD Bond rates, higher capital market interest rates, and the Financial Services Royal Commission which recommenced this week in Brisbane with a focus on country’s $50 billion farm sector and farm finance, 70% of which resides in Queensland, New South Wales and Victoria. And it was more really bad news for the banks, who again demonstrated poor practice, and in some cases deception. But this is a complex area, with farmers sensitive to weather extremes, global commodity prices, and changing land prices. And players such as liquidators seemed to profit from the failure of farmers, despite selling land and equipment well below value. They are not in scope for the Royal Commission, but we think they should be.  There is clearly a case for ASIC to take a more hands-on role in farm finance as some rural lenders, such as the non-bank ones, are not covered by existing complaints-handling systems. But overall, this is another example of poor culture in the banking industry, and players including ANZ and CBA are under the microscope. The findings were so damming that the Commission decided to spend more time looking at farming case studies.  For bank-originating farm debt, some lenders changed loan contract terms for farm businesses that were late with payments or in default without warning or explanation. More broadly, the Commission heard about declining access to banking services for the 6.9 million Australians in rural areas, the inflexibility of lenders toward farm-specific challenges like weather, trade disputes, and lack of customized regulations for the sector.

The latest credit data from APRA and RBA, out yesterday, showed that May credit slowed sharply to equal a 6-year low of 0.2% m/m, and a 4-year low of 4.8% y/y. We discussed this in our post “May Credit Snapshot Tells the Story”.

As UBS highlights, private credit growth has weakened more quickly than expected to only 0.2% m/m, the equal weakest since 2012; also dragging the y/y to an equal 4-year low of 4.8% (after 5.1%). Also, total deposits growth collapsed in recent months to only 2.4% y/y, the weakest since the last recession in 1991. Meanwhile, the household debt-to-income ratio lifted to a record high of 190% in Q1- 18. However, mainly due to falling house prices, household wealth declined by 0.4% q/q, the largest fall since 2011. While this followed a surge to a record high level of $10.3 trillion in Q4-17, the change in wealth drives the household saving ratio, consistent with a fading ‘household wealth effect’ dragging consumption ahead. They say this will spill over and an ~8-10% fall in new car sales volumes is a strong possibility, Further evidence of the second order impacts.

Housing auction clearance rates slid to a ~6-year low of ~54%, housing credit growth eased to a >4- year low dragged by investors slumping to a record low, while industry data on owner occupier home loans suggests this also started to drop in May; while home prices are falling the most since 2012. Macroprudential policy is reducing borrowing capacity and leading to a clear weakening of housing, which will continue ahead.

CoreLogic says last week, 1,849 auctions were held across the combined capital cities, returning a final clearance rate of 55.5 per cent, increasing from the previous week when 52.4 per cent of the 2,002 auctions held were successful, the lowest clearance rate seen since late 2012. This time last year, the clearance rate was 66.5 per cent across 2,355 auctions.

Melbourne’s final clearance rate was recorded at 59.9 compared with a clearance rate of 70.7 per last year. Sydney’s final auction clearance rate was 50.1 per cent compared with a clearance rate of 68.2 per cent last year. Across the smaller auction markets, clearance rates improved everywhere except Tasmania, however only 3 auctions were held there over the week. Of the non-capital city auction markets, Geelong returned the highest final clearance rate, with a success rate of 71.4 per cent across 26 auctions.

This week they expect to see a lower volume of auctions this week with CoreLogic currently tracking 1,557 auctions, down from 1,849 last week.

Home prices are falling with the CoreLogic 5-city daily dwelling price index, which covers the five major capital city markets, declined another 0.15%. So far in June home values have fallen 0.24%, driven by Melbourne, Sydney and Perth. So far in 2018, home values have declined by 1.72%, with only Brisbane and Adelaide recording a value increase. Over the past 12 months, home values have fallen by 1.72%, driven by Sydney and Perth. Despite the continuing falls. values are now up 36.2% since the 2010 peak at the 5-city level, driven overwhelmingly by exceptionally strong gains in Sydney at 60.2% followed by Melbourne 42.6% and Adelaide 9.8%. Brisbane is 8.3% and Perth is down 11.4% This is before inflation adjustments, which means in real terms only Sydney and Melbourne prices are ahead.

We see more banks lifting rates on the back of the higher BBSW and LIBOR rates. For example, effective Friday 3 July, ING in Australia said it was making changes to variable rates for existing owner occupier home loan customers. This means interest rates for existing residential home loan customers will increase by 0.10%.

Bank of Queensland announced the variable home loan rate for owner occupiers (principal and interest repayments) will increase by 0.09 per cent, per annum; variable home loan rate for owner occupiers (interest only repayments) will increase by 0.15 per cent, per annum; variable home loan rate for investors (principal and interest and interest only repayments) will increase by 0.15 per cent, per annum; and Owner occupier and investor Lines of Credit will increase by 0.10 per cent, per annum. Anthony Rose, Acting Group Executive, Retail Banking said today’s announcement is largely due to the increased cost of funding. “Funding costs have significantly risen since February this year and have primarily been driven by an increase in 30 and 90 day BBSW rates, along with elevated competition for term deposits.

This just extends the list of players lifting rates, and we think more will follow. So it was interesting to see Bendigo Bank chairman Robert Johanson saying that he believes the RBA has waited too long to move rates. “They’ve been trying to do too much work with monetary policy,” he told Banking Day. “I’m concerned that apart from the impact we’ve already seen on asset values, mortgage rates are going to break from the official cycle and will do so in a disruptive way.” The funding pressures on lenders are emerging at an awkward time for the Turnbull Government, which is required to call a federal election within the next 12 months. A series of out-of-cycle increases across the industry could induce a blistering political response from government politicians who are cognizant of the historical links between election outcomes and mortgage rate rises. Even small hikes would create significant pain as a piece on Nine News, using our mortgage stress data explained.

I discussed the current situation with Economist John Adams this week in an extended interview – see Australia’s Debt Bomb. I recommend this post as we go through the critical issues are how it may play out.

Finally, as we hit the end of the financial year, it’s worth reflecting on the highlights and lowlights of the past year. It has been a bit of a roller coaster, but those with shares invested direct, or via superfunds will have done well, again – as in 9 of the past 10 years has proved to be.  We suspect the next 12 months will be less positive, as rising interest rates, trade wars and political tensions all mount. We also have an election ahead, which will also potentially create waves.  Trade wars is the area to watch. Our dollar has been sliding through the year, and this is likely to continue next year as we struggle with GDP growth in this volatile environment.

Corporate profits have been growing fast, as companies cut costs and rationalise their businesses and this has translated to higher dividends – and about half have come from the financial services sector overall.  Banks will be hard pressed to maintain their dividends ahead, as lending growth slows, pressure on their culture continues thanks to the Royal Commission and regulators exercising their muscles. And the greatest of these is mortgage lending growth which we think will continue to languish. Provisions, which were cut this year, may need to rise ahead as 90 days plus default rates are rising, as wages and cost pressure hit home.  Remember also the next round of penalty rate reductions for 700,000 workers in across sectors such as retail will cut pay by 10% comes in 1 July.

Property has done less well, despite being well up over the past year, in that the recent monthly trends are signalling a fall. In some states we will end the year well up, for example Hobart, Adelaide and Melbourne, in others less well. We expect more falls ahead because prices are most strongly linked to credit supply, which is being throttled back. Most centres will be impacted as investors tread water and foreign buyer momentum slows. This might be good news for first time buyers who have been enticed back into the market, partly thanks to recent FTB incentives. We are bearish on the property sector next financial year.

Those needing to get income from savings and deposit accounts have had a torrid time, as banks have cut, and cut again their returns on savings. Many are getting less than inflation, so their hard earned cash has taken a hit. This is likely to continue, despite banks lifting mortgage rates as international funding pressure continues to bite in the months ahead. Households continue to be taxed on their savings at their marginal rate, while those with property get massive tax breaks. If Labor does win the next election, this is set for a shake up!

So overall a mixed year, with some highs and lows, and we think next year will be no different, only more so. Credit trajectory is the one to watch.

Australian Homebuyers Paid Out Over $21 billion In Stamp Duty Last Year

HIA’s Stamp Duty Watch report, released today, reviews the latest developments around stamp duty across Australia’s eight states and territories.

“Australian homebuyers paid out over $21 billion in stamp duty to state governments during the 2017/18 financial year – and the total cost of the tax is expected to get even bigger over the next few years,” explained HIA Senior Economist, Shane Garrett.

“The Report shows that revenue from stamp duty across the states and territories has doubled over the past 8 years. This has added considerably to the cost of buying a home and represents a real setback for affordability.

“The recent set of state Budgets envisage stamp duty revenues increasing by another 11 per cent over the next four years.

“This will involve homebuyers’ having their pockets drained to the tune of $23.1 billion annually by 2021/22 through stamp duty.

“State governments are more dependent on stamp duty than at any time in the last decade. Stamp duty is notoriously unstable and Australia’s largest states are heavily exposed to any downturn in duty receipts should economic conditions change.

“Housing affordability and the sustainability of government finances would both be winners if stamp duty was replaced by better revenue-raising designs. Australian governments really need to tackle this issue once and for all,” concluded Shane Garrett.

Auction Results Higher On Lower Volumes

CoreLogic says the preliminary clearance rate increased to 58.7 per cent this week, after last week saw the final clearance rate revise down to just 52.4 per cent.

Auction volumes were lower over the week with 1,842 homes taken to auction across the combined capital cities, down from 2,002 last week. While the preliminary clearance rate tends to revise lower over the week as the remaining results are captured, the final clearance rate should still show an improvement week-on-week.

Auction statistics

Melbourne was host to 946 auctions over the week, returning a preliminary clearance rate of 62.3 per cent, compared to last week when 56.2 per cent of the 992 auctions were successful. Over the same week last year, there were 1,047 auctions held in Melbourne, returning a clearance rate of 70.7 per cent.

Auction clearance rate

There were 635 auctions held in Sydney this week returning a preliminary auction clearance rate of 55.3 per cent. In comparison, last week there were 708 auctions held and a final clearance rate of 49.4 per cent was recorded, while this time last year, 68.2 per cent of the 939 auctions held were successful.

Auction Results 23 June 2018

Domain has released their preliminary results for today, and volumes look like they are way down. Final results will of course settle lower.

Last weeks final result was a clearance rate of 50%, 15% lower than a year ago. So more evidence of the slowing market.

Today, Sydney reported 516 listed, but 214 sold an 74 withdrawn.  Melbourne listed 821, sold 429 and 21 were withdrawn. Brisbane listed 69, sold 20 and 6 were withdrawn. Adelaide listed 51, sold 24 and 1 was withdrawn. Canberra listed39, sold 22 and 3 were withdrawn.