Auction Results 28 Oct 2017

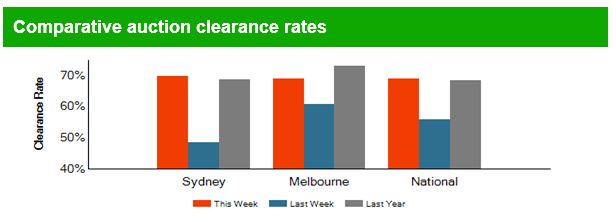
We have the preliminary results from Domain, which underscores the gap between the momentum in Sydney and Melbourne. Total listings and clearance rates were significantly higher down south.

In addition, while Brisbane achieved 39% on 135 scheduled auctions, Adelaide, reached 69% of 96 scheduled (at a clearance rate HIGHER than Sydney!) and Canberra cleared 82% of 100 scheduled, the highest in the country. This chimes with our surveys, which shows significant numbers of property investor switching away from Sydney and towards both Canberra and Adelaide, where property is more reasonable, and where tenants are paying, on a net rental basis, higher rates.

So the question is, will Sydney continue to stall, as prices continue to slide, and will the same falling trends begin to spread to the more buoyant states?

We are on a knife edge…!

Asleep At The Wheel? – The Property Imperative Weekly 28 Oct 2017

Another big week of finance and property news, so we pick over the bones and try to make sense of what’s going on. And we ask were the Regulators asleep at the wheel?

Welcome to the Property Imperative weekly to 28th October 2017. Watch the video or read the transcript.

We start this week’s review with a look at the latest economic data. The latest GDP read from the US, at 3.1% annualised, in Q2 and 3.0% in Q3, provides more support to the view the FED will lift their benchmark rate again before the end of the year. This is likely to have a flow on effect by rising rates in the international capital markets, which will mean higher bank funding costs here, as well as putting downward pressure on the toppy stock market. To confirm this view, we saw the benchmark 10-year Treasury Bond Yield in the USA rose to its highest rate in several months.

In Australia, the ABS said the CPI was 0.6 per cent in the September quarter 2017 following a rise of 0.2 per cent in June. The most significant price rises were electricity (+8.9%), tobacco (+4.1%), international holiday travel and accommodation (+4.1%) and new dwelling purchase by owner-occupiers (+0.8%). These rises were partially offset by falls in vegetables (-10.9%), automotive fuel (-2.3%) and telecommunication equipment and services (-1.5%). The CPI rose 1.8 per cent through the year to September quarter 2017 having increased to 1.9 per cent in the June quarter 2017, below the RBA’s 2-3% target band.

The RBA’s Guy Debelle spoke about some of the uncertainties in taking the economic temperature in Australia. He homed in on the CPI data from the ABS, making the point that our belated quarterly CPI reports are out of kilter with the monthly data now provided in many other western countries. In addition, the ABS will be revising their expenditure weightings in the CPI series, which means that CPI may currently be over stated by perhaps a quarter of a percent. These revisions are made every 5 or 6 years, although there are plans afoot to make them more frequently. The ABS is under tremendous funding pressure, and there are risks their critical data series may be compromised.

The National Accounts data from the ABS for the year 2016-17 really brought home how much of the growth in the economy was thanks to household consumption, as opposed on business or government investment. This helps to explain why the RBA was willing to let household debt escalate to their current astronomical levels, why rates are so low, and why the property sector is so important.  In summary, overall growth was 2%, the lowest since 2008-9; wages rose 2.1%, the weakest since 1991-2; growth in household expenditure as measured in current price terms was 3.0%, the lowest on record; the household saving ratio was at its lowest point (4.6%) in nine years and yet household consumption was the strongest growth driver at 1.22 percentage points.

This was because households borrowed an additional $990 billion over the 10 year period from 2006-07, mainly in mortgages. The value of land and dwellings owned by households increased by $2.9 trillion over the same period and increased by $621 billion through 2016-17 and despite slow wage growth, household gross disposable income plus other changes in real net wealth increased $456.6 billion, or 32.6%, in 2016-17, largely due to a $306.5 billion appreciation in the value of land held by households.

But of course, such high debt and high property prices are now creating fault lines in the property market and household finances.

We are seeing more risks in the property investment sector. Traditionally, in the Australian context, loans to property investors have tended to perform better than loans to owner occupiers. This is because investors receive rental income streams to help pay for the mortgage costs, they are willing to carry the costs of the property against future capital gains, and many will be able to offset costs against tax, especially when negatively geared. In addition, occupancy rates in most states have been stellar.

But things are changing, as the costs of borrowing for investment purposes have risen (thanks to the banks’ out of cycle rises), while rental returns are flat, or falling and the costs of managing the property are rising. In addition, the supply of investment property is rising, and occupancy rates are declining in a number of key markets. As a result, more investors are seeing net rental yields – after mortgage payments and other costs drifting into negative territory, especially in VIC and NSW.  Our Core Market Model, and recent data from ANZ suggests defaults from the property investment sector are now running at similar levels to owner occupied borrowers, and are set to rise further.

In fact, the ANZ full year result, which superficially looked strong – up 18% on the prior comparable period – contained a number of negative trends, as they focus more on the retail business in Australia and New Zealand.  Yes, they have a strong balance sheet, as capital is released from their assets sales, and provisions were down; but the underlying net interest margin fell, down 8 basis points on last year to 1.99%, with a fall of 2 basis points in 2H, despite the mortgage book repricing and loan switching. In addition, 90-Day mortgage defaults overall remained similar to last year, but with a spike in WA and a fall in VIC/TAS. Investment loan delinquencies are rising, whereas they have traditionally been lower than OO loans. They have recently tightened underwriting standards, but of course loans already on their books have looser standards. They warn “household debt and savings have both increased, however the ability for households to withstand economic shocks has diminished a little”. “In 2018 we expect the revenue growth environment for banking will continue to be constrained as a result of intense competition and the effect of regulation including a full year of impact of the Australian bank tax.”

Our own analysis of default probability, from our Core Market Model, now includes 90-day default risk modelling.  We measure mortgage stress on a cash flow basis – the October data will be out next week – and we also overlay economic data at a post code level to estimate the 30-day risk of default (PD30). But now we have added in 90-day default estimates (PD90) and the potential value which might be written off, measured in basis points against the mortgage portfolio. We also calibrated these measures against lender portfolios. Granular analysis can provide a rich understanding of the real risks in the portfolio. Risks though are not where you may expect them! If we look at the results by state, WA leads the way with the highest measurement, then followed by VIC, SA and QLD. The ACT is the least risky area. In WA, we estimate the 30-day probability of default in the next 12 months will be 2.5%, 90-day default will be 0.75% and the risk of loss will be around 4 basis points. This is about twice the current national portfolio loss, which is sitting circa 2 basis points.

Banks are cracking down on loans to borrowers buying into Brisbane’s over-supplied apartment market, with a number of risky postcodes identified, which require bigger deposits. The four major banks – Westpac, Suncorp, Australia and New Zealand Banking Group (ANZ), and National Australia Bank (NAB) – are restricting lending for certain Brisbane postcodes, where apartment buyers will now be required to have a deposit of up to 20% to qualify for a home loan. Suncorp has blacklisted nearly 40 postcodes in the Queensland capital, including Inner Brisbane, Teneriffe, Fortitude Valley, Bowen Hills, and Herston. The banks are refusing to loan more than 80% of the cost of a unit due to “[weaknesses] in the investment market” as well as the current oversupply in inner-city apartments. Prices for apartments in Inner-Brisbane have dropped to their lowest level in three years.

QBE’s Housing Outlook, published this week, suggests home price growth will slow further in the years ahead. We continue to see appetite from property investors easing, as property price growth stalls or in some states reverse. Banks on the other hand are chasing new business with deep discounts on new loans. For example, Teachers Mutual cut their rate for new loans by 30 basis point, to 3.84%.  Westpac, St George, BankSA and Bank of Melbourne all introduced promotional discount rates, with rates down by up to 20 basis points. Bank West also offered discounts to both new owner occupied and investor borrowers. So, the war chests created by the back book repricing earlier in the year – especially investor and interest loans are being used to target new business. As a result, we expect to see a hike in refinancing, especially in the lower LVR owner-occupied sector, as borrowers seek to reduce their monthly outgoings.

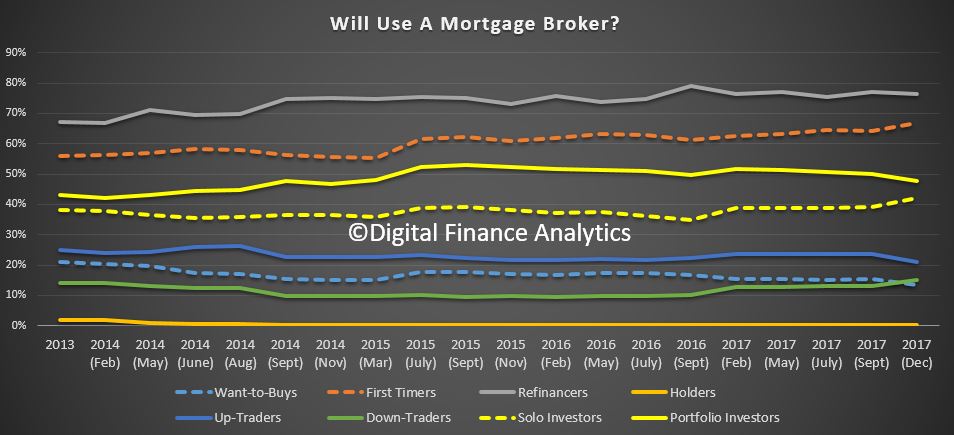
We also showed that more households seeking a mortgage are generating multiple applications, sometimes direct to a bank, and sometimes via mortgage brokers, as they seek to find the best deals. More applications are made via online systems, which make the process easier, but the net result of all this is that mortgage conversation rates have fallen from around 80% to 50%, creating more noise, and costs in the system. We think this is a direct results of the banks’ so called omni-channel approach to distribution, which will turn out to be quite costly.

Following the concerns expressed recently by RBA and ASIC on the risks to household finances, finally, we got an admission from APRA that mortgage lending standards have decayed over the last decade, and that they needed to take action to reverse the trend. And now they are looking at debt-to-income. Poor lending standards, they say are systemic, driven by completion, and poor bank practices. They recently intervened (a little). And late to the piece (now) debt-to-income is important. Did you hear the door slamming after the horse has bolted?

The Treasury added their voice this week, when John Fraser, Secretary to the Treasury, gave an update on household finances and housing as part of his opening statement to the October 2017 Senate Estimates.  He expressed the view that debt is born by those with the greater capacity to repay but this belies the leverage effect of larger loans in a rising interest rate environment. He said that “while banks’ progress against these measures has been positive, regulators will need to think carefully about whether future efforts to maintain financial stability should lean against cyclical excesses or address structural risks within the financial system”.

So, we have the full Monty, with all four members of the shadowy “Council of Financial Regulators” expressing concerns about household debt and home price risks. A completed change of tune from the declarations of 2015 when everything was said to be just dandy!

Now those following this blog over the past few years will know we have been flagging these concerns, especially as the cash rate was brought to its all-time low.  We said DTI was critical, that standards should be tightened, and the growth of debt to income was unsustainable.

All members of the “Council of Financial Regulators” which is chaired by the RBA are culpable.  This body, which works behind the scenes, is referred to when hard decisions need to be take. If you look back at recent APRA and RBA statements, the Council gets a Guernsey! The problem is there has been group-think for year, driven by the need to use households as a growth proxy for the failing mining and resource sector. And no clear accountability. But too little has been done, too late.  And it is poor old households who, one way or the other will pick up the pieces – not the banks who have enjoyed massive profit and balance sheet growth. Even now, lending for housing is growing three time faster than incomes or cpi. Regulators are now lining up to call out the problems. Managing the risk going forwards is a real challenge. It’s time to review the regulatory structure and remember that the Financial System Inquiry recommended the creation of a new Financial Regulator Assessment Board to assess the performance of the regulatory framework, but this was rejected by the Government! That could prove to be a costly mistake.

And that’s the Property Imperative Weekly to 28th October 2017. If you found this useful, do leave a comment below, subscribe to receive future updates and check back next week for the next installment.

QBE Housing Outlook Forecasts Slowing Price Growth

The annual report produced by BIS Oxford Economics for QBE Lenders’ Mortgage Insurance says that the outlook for house and unit prices is likely to become more subdued over the next year or two. Many markets are now building too much stock, particularly units, after new dwelling starts peaked at a record 233,600 dwellings in 2015/16.

Restrictions on bank lending to investors are expected to be an increasingly prominent feature of the outlook for the market over 2017/18. This will most likely reduce investor purchaser activity and slow price growth. Owner occupier demand is also expected to weaken, as the emerging downturn in new dwelling commencements translates into lower building activity over 2017/18 and 2018/19 and negatively affects the economy.

Low affordability in Sydney and Melbourne should begin to impact on the potential for purchasers to take on a larger mortgages.

Demand and supply

Population growth has been strong. Net overseas migration inflows rose from 178,600 in 2014/15, to an estimated 215,000 in 2016/17. Slowing economic growth is expected to cause net overseas migration to ease to 175,000 by 2019/20. While lower than recent cycles, this figure is up compared to the long-term, 20-year trend of 171,100 per annum and is higher than most years through the 1990s and early 2000s. This will continue to fuel underlying demand for dwellings. New dwelling commencements rose to record levels in 2014/15 and 2015/16, and are still well above underlying demand. Only New South Wales, Victoria and Tasmania are expected to be in dwelling deficiency over the next three years. However, the excess stock in markets is more likely to be for units, which have accounted for the larger share of the upturn in new dwelling supply.

Lending environment

Low interest rates have helped drive up prices and investors have been a key source of demand. Successive initiatives by the financial regulators to dampen speculative investment has resulted in banks lowering loan-to-value ratios to investors, as well as charging higher interest rates to investors and for interest only lending. The latest restrictions on interest only loans are expected to cause a slowdown in investor lending over 2017/18. This is likely to have a negative effect on dwelling prices, with price falls expected in some cities.

Median prices

Median house price growth in Sydney and Melbourne is expected to weaken in 2017/18 due to lower investor activity in the market. This is expected to have a greater affect in Sydney, given its greater recent influence from investors. The emerging momentum in house price growth in Canberra and Hobart is forecast to continue in 2017/18. Modest house price rises are expected in Brisbane and Adelaide; with these markets being dampened by weak local economic conditions. The downturns
in Perth and Darwin are forecast to bottom out in 2017/18 although any recovery is likely to be drawn out. Unit price growth is forecast to underperform house price growth. A disproportionately higher number of units being built in most markets will result in an excess supply in units. Restrictions on investor lending will also have a negative effect, given units are more favoured by investors.

Affordability

While the demand and supply balance is important in determining pressure on prices and whether rents rise or fall, there is an upper limit on how much of a household’s income can be spent on mortgage repayments. As it becomes more difficult to service a mortgage on a property, further price growth becomes less possible unless incomes rise or interest rates reduce by a sufficient enough margin to make purchasing more affordable.

Affordability has deteriorated considerably in Sydney and Melbourne since 2012/13 due to strong house price growth. The ratio of mortgage repayments on a median priced house to average household disposable income is 39.7% in Sydney and 36.2% in Melbourne at June 2017. This is close to each city’s previous highs, indicating limited scope for continuing solid price growth.

Affordability has also become more difficult in Adelaide, Hobart and Canberra over the past 12 months, again due to rising prices.

Nevertheless, affordability is at levels similar to that seen in the early 2000s. In contrast, price reductions in Perth and Darwin have made purchasing a dwelling more affordable. Brisbane has remained at around the mid‑point of its historical range.Low affordability in Sydney and Melbourne should begin to impact on the potential for purchasers to take on a larger mortgage and bid up prices too much further. Moreover, it makes these markets vulnerable to rises in interest rates, as the most recent purchasers may have stretched themselves to buy their dwelling.

Notably, the better affordability in other cities is having a limited impact on prices. Weaker economic conditions and little growth in household incomes has made buyers more reluctant to overcommit on a loan. The better relative affordability should mitigate some of the downward pressure on prices in oversupplied markets and in resource‑sector exposed markets such as Perth, Darwin and to a lesser extent Brisbane.


Preliminary Auction Clearance Rate Remains Below 70%

From CoreLogic.

The combined capital cities returned a preliminary auction clearance rate of 69.4 per cent this week, marking the 21st consecutive week where the clearance rate has held below 70 per cent.  The trend towards softer auction market conditions has been led by the Sydney market where the final auction clearance rate has remained below 65% since the first week of October.

Auction volumes were similar week-on-week, with 2,471 properties taken to auction, compared to 2,525 last week. This time last year, 2,680 homes were taken to auction and a clearance rate of 78.1 per cent was recorded. Tasmania, the smallest auction market, recorded the highest preliminary clearance rate with 80.0 per cent of the 5 reported auctions recording a successful result, followed by Melbourne with a preliminary clearance rate of 73.3 per cent across 1,030 results.

2017-10-23--auctionresultscapitalcities

Auction Results 21 Oct 2017

The preliminary auction clearance results are in from Domain.  Looks like the volume of sales has fallen compared with last week (even though the clearance rate is higher) and last year – all subject to final results later of course. Melbourne is still hotter than Sydney, where our leading indicator research suggests appetite for property is cooling the fastest.

Brisbane achieved 49% clearance on 102 scheduled auctions, Adelaide 70% on 103 scheduled, and Canberra 70% on 49 scheduled auctions.

The Property Imperative Volume 9 Report Released

The latest and updated edition of our flagship report “The Property Imperative” is now available on request with data to mid October 2017.

This Property Imperative Report is a distillation of our research into the finance and property market, using data from our household surveys and other public data. Whilst we provide weekly updates via our blog, twice a year we publish this report. This is volume 9. It offers, in one place, a unique summary of the finance and property markets, from a household perspective.

Residential property, and the mortgage industry is currently under the microscope, as never before. Around two thirds of all households have interests in residential property, and about half of these have mortgages. More households are excluded completely and are forced to rent, or live with family or friends.

We believe we are at a significant inflection point and the market risks are rising. Many recent studies appear to support this view. There are a number of concerning trends. While household incomes are flat in real terms, the size of the average mortgage has grown significantly in the past few year, thanks to rising home prices (in some states), changed lending standards, and consumer appetite for debt. In fact, consumer debt has never been higher in Australia. As a result, households are getting loans later, holding mortgages for longer, even in to retirement, so household finances are being severely impacted, and more recent changes in underwriting standards are making finance less available to many.

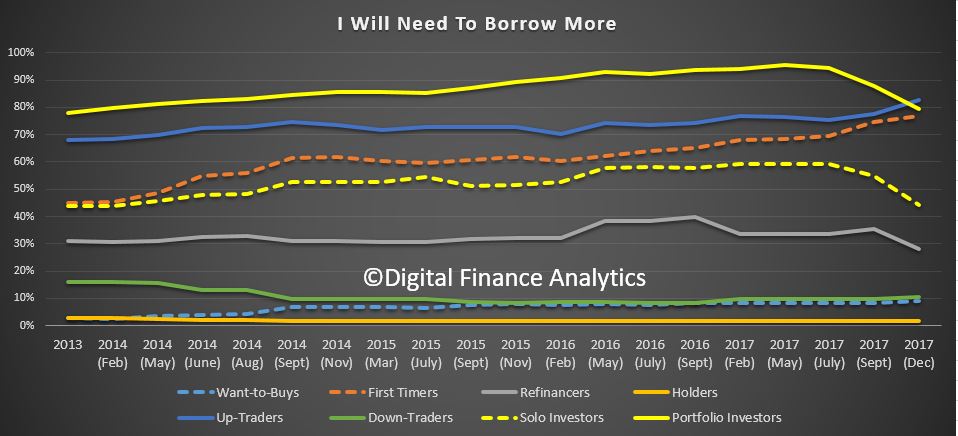
Property Investors still make up a significant share of total borrowing, and experience around the world shows it is these households who are more fickle in a downturn. Many use interest only loans, which create risks downstream, and regulators have recently been applying pressure to lenders to curtail their growth.

Mortgage rates are now higher for Investors and those holding Interest Only loans, while low-risk customers with a Principal and Interest loan should be able to find some amazingly low rates. While mortgage underwriting standards are now tighter, there is an overhang of existing loans which would now fall outside existing underwriting standards. Interest Only loans are especially at risk, not least because rental incomes are being compressed.

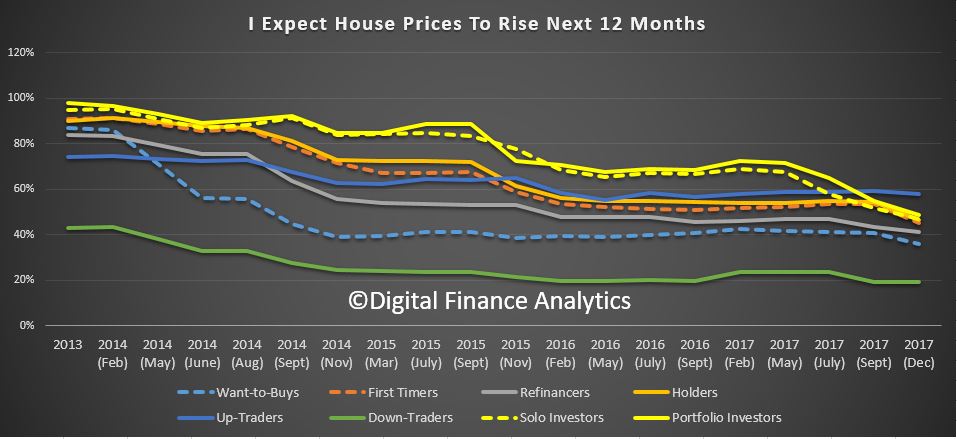
We hold the view that home prices are set to ease in coming months, as already foreshadowed in Sydney. We think mortgage rates are more likely to rise than fall as we move on into 2018.

Finally, lenders have been able to repair their margins, under the umbrella of supervisory intervention, and their back book repricing has created a war chest to fund attractor offers.

We will continue to track market developments in our weekly Property Imperative weekly video blogs, and publish a further consolidated update in about six months’ time.

Here is the table of contents.

1 EXECUTIVE SUMMARY
 2 TABLE OF CONTENTS
 3. OUR RESEARCH APPROACH
 4. THE DFA SEGMENTATION MODEL
 3 PROFILING THE PROPERTY MARKET
 3.1 Current Property Prices
 4 MORTGAGE LENDING TRENDS
 4.1 Total Housing Credit Is Up
 4.2 ADI Lending Trends Are Suspect
 4.3 Housing Finance Flows
 4.4 The Rise of the Bank of Mum and Dad
 5 HOUSEHOLD FINANCES AND RISKS
 5.1 RBA Financial Stability at Risk
 5.2 IMF Warnings On Growth and Debt
 5.3 Household Ratios Under Pressure
 5.4 Housing Occupancy Costs Are High
 5.5 Households Are Spending More On Basics
 5.6 Savings Are Shrinking
 5.7 DFA Mortgage Stress Rises Again
 5.8 Top Ten Stressed Post Codes
 5.9 More Households Have No Equity
 5.10 Greater Risks from Interest Only Loans
 5.11 The Consumption Crunch
 5.12 A Fall in Household Financial Security
 5.13 Mortgage Rates Will Rise – Sometime
 5.14 Defaults Are Down a Little, But Risks Remain
 5.15 Observations
 6 HOUSEHOLDS’ DEMAND FOR PROPERTY
 6.1 Property Active and Inactive Households
 6.2 Cross Segment Comparisons
 6.3 Property Investors
 6.4 How Many Properties Do Investors Have?
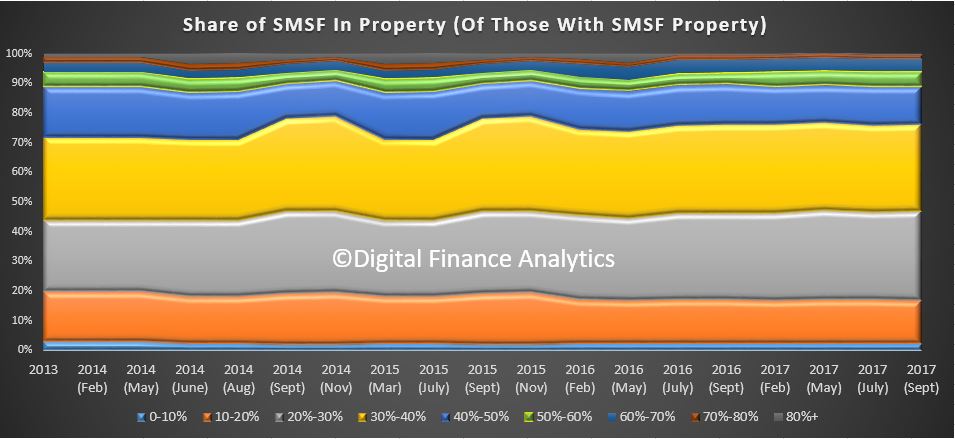
 6.5 SMSF Property Investors
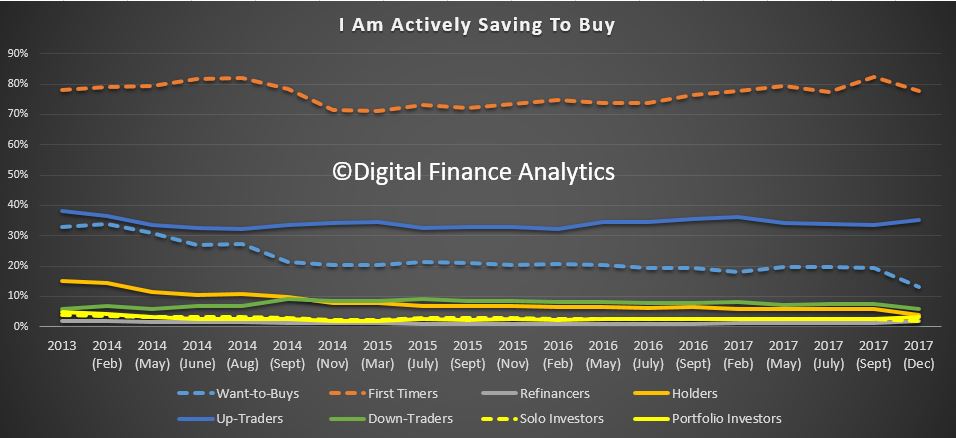
 6.6 First Time Buyers.
 6.7 Up Traders and Down Traders
 6.8 Auction Clearances Remain Quite Strong
 7 MORTGAGE UNDERWRITING STANDARDS
 7.1 ASIC Looks at Interest Only Loans
 7.2 APRA Lifts Capital
 7.3 APRA Lifts Underwriting Standards
 7.4 APRA to Regulate Non-Bank Lenders
 7.5 APRA Delays Mortgage Reporting Standards
 7.6 The Impact On Interest Only Loans
 7.7 Standards Are Tighter Now
 7.8 Risks Are Increasing; Standards Still Too Lose
 8 MORTGAGE PRICING
 8.1 It Pays to Haggle
 9 FINAL OBSERVATIONS
 10 ABOUT DFA
 11 COPYRIGHT AND TERMS OF USE

Request the free report [72 pages] using the form below. You should get confirmation your message was sent immediately and you will receive an email with the report attached after a short delay.

Note this will NOT automatically send you our ongoing research updates, for that register here.

[contact-form to=’mnorth@digitalfinanceanalytics.com’ subject=’Request for The Property Imperative Report 9′][contact-field label=’Name’ type=’name’ required=’1’/][contact-field label=’Email’ type=’email’ required=’1’/][contact-field label=’Email Me The Report’ type=’radio’ options=’Yes Please’ required=’1′ /][contact-field label=’Comment If You Like’ type=’textarea’/][/contact-form]

Auction Clearance Rates Holding Firm

From CoreLogic.

There were 2,497 auctions held across the combined capital cities this week, up from 2,318 last week. So far, 2,007 results have been reported to CoreLogic, returning a preliminary clearance rate of 70.6 per cent, increasing from last week when the final clearance rate slipped to 64.4 per cent, the lowest clearance rate since January 2016. While we expect the clearance rate to revise over the next few days as the remaining results are collected, it will be interesting to see how the clearance rate holds up on Thursday when the final figures are released.

Over the corresponding week last year, auction volumes were similar, with 2,443 properties taken to auction, while the clearance rate was stronger (76.2 per cent). The highest preliminary clearance rate was recorded in Melbourne this week (74.8 per cent), followed closely by Canberra (74.5 per cent).

2017-10-16--auctionresultscapitalcities

Too Little Too Late? – The Property Imperative Weekly 14th October 2017

Another massive week of finance and property news, much of it centred on households and their finances, as the regulators home in on the risks in the mortgage market. But is it too little too late?

Welcome to the Property Imperative weekly to the 14th October 2017. Watch the video, or read the transcript.

We start our review of this week’s finance and property news with the RBA’s Financial Stability report.  This quarterly report, which ran to 62 pages said that International economic conditions, and local business confidence are on the improve while banks now hold more capital, have tightened lending standards, and shadow banking is under control. But, they say, Australian household balance sheets and the housing market remain a core area of interest, and from a financial stability perspective, this is the key risk. They showed that one third of mortgage holders have less than one months’ buffer, and their key concern is the negative impact on future growth as households hunker down;  so nothing new really, apart from some new “Top Down” stress testing.

And nothing to answer the IMF’s downgraded Australian growth forecast. Given the first half result in 2017 was 1.2% a second half forecast at circa 1% is hardly stellar; and the sudden rebound to 3% next year, some might say, appears courageous. The IMF also revised up the unemployment rate, suggesting it will remain at 5.6%, rather than falling to 5.3% as estimated last time. This plus slow wage growth highlights the issues underlying the economy. They also warned about risks from high debt saying growth in household debt relative to GDP is associated with a greater probability of a banking crisis. And Australia is right up there!

On the same day, the ABS released their latest Housing and Occupancy Costs data. The average household with an owner occupied mortgage is paying around $450 a week, slightly lower than the peak a couple of years ago.  This equates to around 16% of gross household income. But of course, the true story is interest rates have fallen to all-time lows, allowing people to borrow more, as prices rise. As a result, should interest rates start to bite, this will cause real pain. Plus, we have recent flat wage growth, in real terms, in the past couple of years. Finally, households have a bigger mortgage held for longer, which is great for the banks, but not helpful from a household perspective, as it erodes savings into retirement and means that more older Australians are still borrowing as they transition from the work force.

Earlier in the week, the ABS also released their latest housing finance data which showed that ADI lending rose 0.6% in trend terms in August, or 2.1% seasonally adjusted. Within that, lending for owner occupied housing rose 0.9%, or 2.1% seasonally adjusted and investor loans rose 0.2% in trend terms, or a massive 4.3% in seasonally adjusted terms. So lending growth is apparent, and signals more household debt ahead. First time buyers continue to extend their reach, despite the fact we are seeing “Peak Price” for property at the moment. In original terms, the number of first home buyer commitments as a percentage of total owner occupied housing finance commitments rose to 17.2% in August 2017 from 16.6% in July.

AFG’s latest mortgage index, shows that property investor appetite is falling, while first time buyers, and property upgraders are more active. First time buyers are reacting to the recent incentives put in place in VIC and NSW, they said.

Citi published a 54-page report on the highly topical subject of interest only (IO) loans, and we provided data from our Core Market Model to assist their research. Even after recent regulatory tightening, they say that underwriting standards in Australia are still more generous than some other countries, at 5.3 times income, compared with 3.7 times in the UK, 4.4 times in Canada and 4.9 times in New Zealand. They conclude that there are vulnerabilities in the IO sector, both from property investors and owner occupied IO loan holders. Overall this is, we estimate, more than $680 billion of the $1.6 trillion mortgage book. They say that tighter lending criteria and rising house prices has meant investors increasingly face net negative cash flows and investors face a growing household cash flow gap and reducing capital gains expectations. The large levels of debt outstanding by borrowers aged in their 50’s and 60’s means many investors will need to sell property to discharge their debts. Owner Occupied IO borrowers are more susceptible to interest rate rises given higher average borrowing levels and higher average loan to value ratios. They concluded “Given the widespread use of IO finance and the reduced prospects of discharging debt via means other than liquidation of portfolio holdings, banks must face an increased risk of mis-selling claims in future years. Mining towns serve as a microcosm of this threat”.

ASIC updated their work on IO loans finding that Australia’s major banks have cut back their interest-only lending by $4.5 billion over the past year. However, other lenders have partially offset this decline by increasing their share of interest-only lending. They say that borrowers who used brokers were more likely to obtain an interest-only loan compared to those who went directly to a lender and borrowers approaching retirement age continue to be provided with a significant number of interest-only owner-occupier loans. Now ASIC will examine individual loan files to ensure that lenders are providing interest-only home loans in appropriate circumstances, to ensure that consumers are not paying for more expensive products that are unsuitable, under the responsible lending provisions.

In this light, it was interesting to listen to some of the Big Bank’s CEO’s in front of the House of Representatives Standing Committee on Economics. Westpac CEO said half of his $400 billion mortgage portfolio was interest only. The other banks were closer to 40%. While both Westpac and ANZ said “we don’t lend to people who can’t pay it back. It doesn’t make sense for us to do so”, the underwriting standards are, we think, way too lose, as the recent regulatory tightening highlights, but it’s probably too late, especially for IO loans which now would fail even the current still generous standards. In an excellent The Conversation article, Richard Holden, Professor of Economics, UNSW rightly highlighted the “Spooky” parallels between our current situation, and the US mortgage market prior to the GFC.  “Australia’s large proportion of five-year interest-only loans – turbocharged by an out-of-control negative-gearing regime – looks spookily similar. It’s one thing for borrowers to do silly things. When it becomes dangerous is when lenders not only facilitate that stupidity, but encourage it. That seems to be what has happened in Australia”.

Smaller lenders are still feeling the pressure, as illustrated by the Bank of Queensland results, which came out this week. While the headline profit was up, underlying growth was lower, and mortgage lending was the key. Net interest margin fell to 1.87%, but was better in 2H. Interest only loans were 40% in 2H16, and 39% in 1H17, but trending down, they say! 8% of loans are higher than 90% LVR on a portfolio basis, and 19% in the 81-90% band.

During their hearing, the big banks also confirmed they had repriced their mortgage back book, especially for interest only and investment loans, but weirdly denied this was to increase profitability.  The quote of the week for me was one CEO saying that people should switch from IO loans to P&I loans “because they were cheaper” – which may be true from a headline interest rate perspective, but the monthly repayments when switching are significantly higher, so in reality, it is not cheaper in cash flow terms!

There was conflicting data relating to Foreign Property Investors, especially from China, with Credit Suisse saying they estimate, based on stamp duty records, that foreign buyers are acquiring the equivalent of 25% of new housing supply in NSW, 17% in Victoria and 8% in Queensland.  If they are correct, this may put a floor on home prices, and they suggest that crackdowns on capital outflows by Chinese authorities appear not have slowed China’s appetite for Australian property.

On the other hand, while the NAB Residential Property Index rose 6 points in Q3, they highlighted lower foreign buying activity in new property markets, VIC saw the share fall to 14.4% (from 20.8% in Q2) and NSW down to 7.8% from 12% in Q2. In contrast, QLD saw a rise to 11.4%, up from 8.6% last quarter. NAB also revised its national house price forecasts, predicting an increase of 3.4% in 2018 (previously 4.3%) and easing to 2.5% in 2019. Unit prices are forecast to rise 0.5% in 2018 (-0.3% previously), with a modest fall expected in 2019.

Our data suggests that Chinese buyers are indeed still active, with a focus on certain postcodes where high-rise units are being built, and often offered direct to overseas buyers. We also see evidence of some high rollers buying larger houses. But overall this is not enough to support home prices into next year.

We published the September update of the Digital Finance Analytics Household Finance Security Index, which underscored the growing gap between employment, which remains relatively strong, and the Financial Security of households. The Index fell from 98.6 in August to 97.5 in September. The state by state view highlights a fall in NSW, while VIC holds higher, and there was a rise in WA from February 2017 lows. This highlights the fact the households across the national are under different levels of pressure. Tracking by age bands we find younger households are significantly less confident, compared with those aged 50-60 years.  But across the board, the general trend is lower.

Similar findings were contained in the latest AlphaWise survey conducted by Morgan Stanley. Income growth has not recovered, ‘cost of living’ inflation is re-accelerating and ‘macro-prudential’-related tightening of credit conditions is extending from housing into consumer finance. They say Australian households are in a vulnerable financial position, especially those who have taken out a mortgage. And in an era of weak incomes growth, soaring energy prices and high levels of indebtedness, with the prospect of higher interest rates on the way, many intend to cut discretionary spending in anticipation of even tighter household budgets. That’s bad news, not only Australia’s retail sector, but also the broader economy. They forecast discretionary consumption volumes will slow to just 0.2% in 2018, dragging overall consumption growth down to 1.1% and well below consensus of 2.5%.

So, in summary the evidence is building that we are entering a concerning episode where growth is likely to be lower, households will remain under pressure, and risks in the system are considerably higher than the RBA is willing to concede. The mystery though is why the regulators are still allowing mortgage lending to grow way faster than inflation, and wages. This surely must be slowed, and soon. Once again, too little too late.

So that’s the Property Imperative Weekly to 14th October. If you found this useful, do leave a comment below, subscribe to receive future updates and check back next week.

Auction Results 14 Oct 2017

The preliminary auction results are in from Domain. The trend continues with lower volumes but still strong clearance rates in the main centres, and with Melbourne leading the charge.

Away from the Sydney/Melbourne axis, Brisbane cleared 48% of 121 scheduled auctions, Adelaide achieved a 79% result on 72 scheduled auctions and Canberra 68% of 47 scheduled.

Australian investors may be heading towards the ‘cliff edge’ on loan repayments

From Business Insider.

Recent restrictions on interest-only lending have increased concerns around Australian housing stability, if investors are forced to start paying down principal in addition to the interest on their loan.

In a note titled “Cliff edge”, housing expert Pete Wargent said those stricter lending standards have led to speculation an increasing number of borrowers could topple over a “principal and interest cliff” when their interest-only loan expires and they’re unable to roll it over.

Most interest-only loans have a five-year term, at which point it’s rolled over or converts to principal & interest repayments.

“The repayments might be up to 40% or more higher when the principal payments kick in, so household cashflows need to be carefully managed,” Wargent said.

Interest-only lending peaked in 2015 before APRA’s first round of macro-prudential restrictions. In view of that, Wargent expects the highest number of interest-only loan terms will be due to roll over in 2020.

This chart shows Wargent’s estimate of the dollar value of interest-only loans for which borrowers will be forced to convert to principal & interest repayments:

Source: Pete Wargent Daily Blog


As part of macro-prudential measures introduced in March to try and curb property market speculation, APRA put a cap on interest-only lending at 30% of all new loans.

Australian banks also offered no-cost switches into principal & interest repayment plans, and enforced stricter loan to value (LVR) requirements for interest-only borrowers.

Based on those changes, “it’s possible to make a rough assessment or estimate of the value of IO loans falling due approved under conditions that would likely fail today’s underwriting standards”, Wargent said.

The estimates suggest that around $40-55 billion in interest-only loans will come up for renewal between 2018 and 2020.

“By 2016, the share of new interest-only loans in the market had been pared back, and therefore the P&I cliff will also begin to taper off by 2021,” he added.

This chart from Citi provides a good measures of how rampant interest-only lending was in 2015, to borrowers now facing revised loan-terms in 2020.

In the March quarter of 2015, interest-only lending made up almost half of new loan flow:

In a research report released this morning, Citi also calculated that the total value of interest-only loans in Australia currently amounts to approximately $643 billion.

The bulk of interest-only loans are taken up by investment professional for tax benefits. However, Citi also reported a sharp rise in interest only loans taken out between 2011 and 2017 by the “suburban mainstream” — middle income workers and younger families.

Based on those figures, if income growth remains low a number of Australian households could be facing increased pressure from a sharp rise in mortgage costs over the next three years as interest-only loan terms expire.

Wargent expects the changes to suck some “hot air” out of Australia’s property market. “I don’t know if it’s a doomsday scenario, but it will most likely make property less attractive as an asset class”, he told Business Insider.

“In the wash-up, one can’t help but feel that investors that opted for quantity over quality of investment properties might be left staring down the barrel of some unenviable decisions.”