First Time Buyers Keep The Property Market Afloat – The Property Imperative Weekly – 9th Dec 2017

First Time Buyers are keeping the property ship afloat for now, but what are the consequences?

Welcome to the Property Imperative weekly to 9th December 2017. Watch the video, or read the transcript.

In our weekly digest of property and finance news, we start this week with the latest housing lending finance from the ABS. The monthly flows show that owner occupied lending fell $23m compared with the previous month, down 0.15%, while investment lending flows fell 0.5%, down $60m in trend terms. Refinanced loans slipped 0.13% down $7.5 million. The proportion of loans excluding refinanced loans for investment purposes slipped from a recent high of 53.4% in January 2015, down to 44.6% (so investment property lending is far from dead!)

While overall lending was pretty flat, first time buyers lifted in response to the increased incentives in some states, by 4.5% in original terms to 10,061 new loans nationally. At a state level, FTB’s accounted for a 19% per cent share in Victoria and 13.7% in New South Wales, where in both states, a more favourable stamp duty regime and enhanced grants were introduced this year. But, other states showed a higher FTB share, with NT at 24.8%, WA at 24.6%, ACT at 20.1% and QLD 19.7%. SA stood at 13% and TAS at 13.3%. There was an upward shift in the relative numbers of first time buyers compared with other buyers (17.6% compared with 17.4% last month), still small beer compared with the record 31.4% in 2009. These are original numbers, so they move around each month. The number of first time buyer property investors slipped a little, using data from our household surveys, down 0.8% this past month. Together with the OO lift, total first time buyer participation has helped support the market.

The APRA Quarterly data to September 2017 shows that bank profitability rose 29.5% on 2016 and the return on equity was 12.3% compared with 9.9% last year. Loans grew 4.1%, thanks to mortgage growth, provisions were down although past due items were $14.3 billion as at 30 September 2017. This is an increase of $1.5 billion (11.8 per cent) on 30 September 2016. The major banks remain highly leveraged.

The property statistics showed that third party origination rose with origination to foreign banks sitting at 70% of new loans, mutuals around 20% and other banks around the 50% mark. Investment loan volumes have fallen, though major banks still have the largest relative share, above 30%.  Mutuals are sitting around 10%.  Interest only loans have fallen from around 40% in total value to 35%, but this represents a fall from around 30% of the loan count, to 27%. This reflects the higher average loan values for IO borrowers. The average loan balance for interest only loans currently stands at $347,000 against the average balance of $264,000.  No surprise of course, as these loans do not contain any capital repayments (hence the inherent risks involved, especially in a falling market).

But there has been a spike in loans being approved outside serviceability, with major banks reporting 5% or so in September. This may well reflect a tightening of standard serviceability criteria and the wish to continue to grow their loan books. We discussed this on Perth 6PR Radio.  So overall, we see the impact of regulatory intervention. The net impact is to slow lending momentum. As lenders tighten their lending standards, new borrowers will find their ability to access larger loans will diminish. But the loose standards we have had for several years will take up to a decade to work through, and with low income growth, high living costs and the risk of an interest rate rise, the risks in the system remain.

On the economic front, GDP from the ABS National Accounts was 0.6%. This was below the 0.7% expected. This gives an annual read of 2.3%, in trend terms, well short of the hoped for 3%+. Seasonally adjusted, growth was 2.8%. Business investment apart, this is a weak and concerning result.  The terms of trade fell. GDP per capita and net disposable income per capita both fell, which highlights the basic problem the economy faces.  The dollar fell on the news. Households savings also fell. No surprise then that according to the ABS, retail turnover remained stagnant in October. The trend estimate for Australian retail turnover fell 0.1 per cent in October 2017 following a relatively unchanged estimate (0.0 per cent) in September 2017. Compared to October 2016 the trend estimate rose 1.8 per cent. Trend estimates smooth the statistical noise.

So no surprise the RBA held the cash rate once again for the 16th month in a row.

The latest BIS data on Debt Servicing ratios shows Australia is second highest after the Netherlands. We are above Norway and Denmark, and the trajectory continues higher. Further evidence that current regulatory settings in Australia are not correct. As the BIS said, such high debt is a significant structural risk to future prosperity. They published a special feature on household debt, in the December 2017 Quarterly Review. They call out the risks from high mortgage lending, high debt servicing ratios, and the risks to financial stability and economic growth.  All themes we have already explored on the DFA Blog, but it is a well-argued summary. Also note Australia figures as a higher risk case study.  They say Central banks are increasingly concerned that high household debt may pose a threat to macroeconomic and financial stability and highlighted some of the mechanisms through which household debt may threaten both. Australia is put in the “high and rising” category.  The debt ratio now exceeds 120% in both Australia and Switzerland.  Mortgages make up the lion’s share of debt.  In Australia mortgage debt has risen from 86% of household debt in 2007 to 92% in 2017.

Basel III was finally agreed this week by the Central Bankers Banker – the Bank for International Settlements – many months later than expected and somewhat watered down. Banks will have to 2022 to adopt the new more complex framework, though APRA said that in Australia, they will be releasing a paper in the new year, and banks here should be planning to become “unquestionably strong” by 1 January 2020.  We note that banks using standard capital weights will need to add different risk weights for loans depending on their loan to value ratio, advanced banks will have some floors raised, and investor category mortgages (now redefined as loans secured again income generating property) will need higher weights. Net, net, there will be two effects. Overall capital will probably lift a little, and the gap between banks on the standard and internal methods narrowed. Those caught transitioning from standard to advanced will need to think carefully about the impact. This if anything will put some upwards pressure on mortgage rates.

The Treasury issues a report “Analysis of Wages Growth” which paints a gloomy story. Wage growth, they say, is low, across all regions and sectors of the economy, subdued wage growth has been experienced by the majority of employees, regardless of income or occupation, and this mirrors similar developments in other developed western economies. Whilst the underlying causes are far from clear, it looks like a set of structural issues are driving this outcome, which means we probably cannot expect a return to “more normal” conditions anytime some. This despite Treasury forecasts of higher wage growth later (in line with many other countries). We think this has profound implications for economic growth, tax take, household finances and even mortgage underwriting standards, which all need to be adjusted to this low income growth world.

Mortgage Underwriting standards are very much in focus, and rightly, given flat income growth.  There was a good piece on this from Sam Richardson at Mortgage Professional Australia which featured DFA. He said that over four days in late September two major banks added extra checks to an already-extensive application process. ANZ introduced a Customer Interview Guide requiring brokers to ask questions about everything from a customer’s Netflix subscription to whether they were planning to start a family. Three days later CBA introduced a simulator that would show interest-only borrowers how their repayments would change and affect their lifestyle. Customers would be required to fill in an ‘acknowledgement form’ to proceed with an interest-only application.

Getting good information from customers is hard work, not least because as we point out, only half of households have formal budgeting. So, when complete the mortgage application, households may be stating their financial position to the best of their ability, or they may be elaborating to help get the loan. It is hard to know. Certainly banks are looking for more evidence now, which is a good thing, but this may make the loan underwriting processes longer and harder. Improvements in technology could improve underwriting standards for banks while pre-populating interactive application forms for consumers and offering time-saving solutions to brokers and Open Banking may help, but while Applications can be made easier, this does not necessarily mean shorter.

More data this week on households, with a survey showing Australians have become more cautious of interest only loans with online panel research revealing that 46 per cent of Australians are Adamant Decliners of interest-only home loans according to research from the  Gateway Credit Union. In addition, a further quarter of respondents are Resistant Approvers, acknowledging the benefits of interest-only loans yet choosing not to utilise them. Of the generations, Baby Boomers are most likely to be Adamant Decliners and therefore, less likely to use interest-only products. While Gen Y are most likely to be Enthusiastic Users.

Banks continue to offer attractive rates for new home loans, seeking to pull borrows from competitors. Westpac for example, announced a series of mortgage rate cuts to attract new borrowers, as it seeks to continue to grow its portfolio, leveraging lower funding costs, and the war chest it accumulated earlier in the year from back book repricing, following APRA’s tightening of underwriting standards and restrictions on interest only loans. Rates for both new fixed rate loans and variable rate loans were reduced.  For example, the bank has also increased the two-year offer discount on its flexi first option home for principal and interest repayments from 0.84% p.a. to 1.00% p.a. putting the current two-year introductory rate at 3.59% p.a.

The RBA released their latest Bulletin  and it contained an interesting section on Housing Accessibility For First Time Buyers.  They suggest that in many centers, new buyers are able to access the market, thanks to the current low interest rates. But the barriers are significantly higher in Melbourne, Sydney and Perth. They also highlight that FHBs (generally being the most financially constrained buyers) are not always able to increase their loan size in response to lower interest rates because of lenders’ policies. Indeed, the average FHB loan size has been little changed over recent years while the gap between repeat buyers and FHBs’ average loan sizes has widened. They also showed that in aggregate, rents have grown broadly in line with household incomes, although rent-to-income ratios suggest housing costs for lower-income households have increased over the past decade.

Housing affordability has improved somewhat  across all states and territories, allowing for a large increase in the number of loans to first-home buyers, according to the September quarter edition of the Adelaide Bank/REIA Housing Affordability Report. The report showed the proportion of median family income required to meet average loan repayments decreased by 1.2 percentage points over the quarter to 30.3 per cent. The result was decrease of 0.6 percentage points compared with the same quarter in 2016. However, Housing affordability is still a major issue in Sydney and Melbourne they said.  In addition, over the quarter, the proportion of median family income required to meet rent payments increased by 0.3 percentage points to 24.6 per cent.

Our own Financial Confidence Index for November fell to 96.1, which is below the 100 neutral metric, down from 96.9 in October 2017. This is the sixth month in succession the index has been below the neutral point. Owner Occupied households are the most positive, scoring 102, whilst those with investment property are at 94.3, as they react to higher mortgage repayments (rate rises and switching from interest only mortgages), while rental yields fall, and capital growth is stalling – especially in Sydney.  Households who are not holding property – our Property Inactive segment – will be renting or living with friends or family, and they scored 81.2. So those with property are still more positive overall. Looking at the FCI score card, job security is on the improve, reflecting rising employment participation, and the lower unemployment rate.  Around 20% of households feel less secure, especially those with multiple part time jobs. Savings are being depleted to fill the gap between income and expenditure – as we see in the falling savings ratio. As a result, nearly 40% of households are less comfortable with the amount they are saving. This is reinforced by the lower returns on deposit accounts as banks seek to protect margins. More households are uncomfortable with the amount of debt they hold with 40% of households concerned. The pressure of higher interest rates on loans, tighter lending conditions, and low income growth all adds to the discomfort. More households reported their real incomes had fallen in the past year, with 50% seeing a fall, while 40% see no change.  Only those on very high incomes reported real income growth.

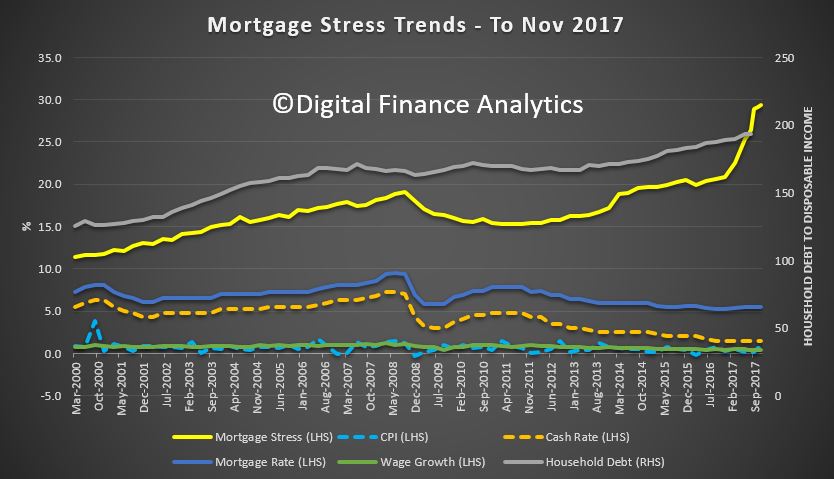
Finally, we also released the November mortgage stress and default analysis update. You can watch our video counting down the most stressed postcodes in the country. But in summary, across Australia, more than 913,000 households are estimated to be now in mortgage stress (last month 910,000) and more than 21,000 of these in severe stress, the same as last month. Stress is sitting on a high plateau. This equates to 29.4% of households. We see continued default pressure building in Western Australia, as well as among more affluent household, beyond the traditional mortgage belts across the country. Stress eased a little in Queensland, thanks to better employment prospects. We estimate that more than 52,000 households risk 30-day default in the next 12 months, similar to last month. We expect bank portfolio losses to be around 2.8 basis points, though with losses in WA rising to 4.9 basis points.

So, the housing market is being supported by first time buyers seeking to gain a foothold in the market, but despite record low interest rates, and special offer attractor rates, many will be committing a large share of their income to repay the mortgage, at a time when income growth looks like it will remain static, costs of living are rising, and mortgage rates will rise at some point. All the recent data suggests that underwriting standards are still pretty loose, and household debt overall is still climbing. This still looks like a high risk recipe, and we think households should do their own financial assessments if they are considering buying at the moment – for home prices are likely to slide, and the affordability equation may well be worse than expected. Just because a lender is willing to offer a large mortgage, do not take this a confirmation of your ability to repay. The reality is much more complex than that. Getting mortgage underwriting standards calibrated right has perhaps never been more important than in the current environment!

And that’s the Property Imperative to 9th December 2017. If you found this useful, do leave a comment, sign up to receive future research and check back next week for the latest update. Many thanks for taking the time to watch.

ATO to Scrutinise Rental Property Market

From The Real Estate Conversation.

The Australian Tax Office is ramping up scrutiny of the rental property market in a bid to stamp out tax rorts, reports The Australian.

In one of a series of interviews with The Australian about ATO priorities, tax commissioner Chris Jordan said the ATO will be looking closely at the practise of declaring rented properties vacant. He said the tax office will go so far as to monitor real estate agent, electricity and gas records to identify fraudulent claims.

Over the last few months, the Australian Taxation Office has already investigated 100,000 rental properties to ensure they are not involved in black-market activity or misclaiming of negative gearing.

The size of the rental market in Australia means it must be watched extremely closely for rorts, said Jordan.

Jordan told The Australian that ATO data shows deductions claimed for rental property exceed the rental income earned for privately owned rental properties in Australia.

“In the rental income space, there’s $40.1 billion of income and $43.6 billion of expenses,” he said.

With the 2016 census showing that 11 per cent of Australian properties, or 1.1 million homes, were unoccupied, rental income in Australia should be much higher, said Jordan.

Jordan said he is concerned about the growing amount of rental income disappearing into the cash economy.

“It appears that many landlords are not declaring their rental income, and many more are overstating their deductions,” he told The Australian.

The ATO is already using data-matching to check if properties are unoccupied. For example, Jordan said the ATO can match utility records, such as for electricity and gas, against the addresses of properties that owners claim are unoccupied.

The Australian reports that from next year, auditors will begin approaching real estate agents to request information about landlords.

The RBA On Housing Affordability

The RBA released their latest Bulletin today  and it contained an interesting section on Housing Accessibility For First Time Buyers.  They suggest that in many centers, new buyers are able to access the market, at the current low interest rates. But the barriers are significantly higher in Melbourne, Sydney and Perth.

They also highlight that FHBs (generally being the most financially constrained buyers) are not always able to increase their loan size in response to lower interest rates because of lenders’ policies. Indeed, the average FHB loan size has been little changed over recent years while the gap between repeat buyers and FHBs’ average loan sizes has widened.

The article starts with an analysis of housing price-to-income ratios.

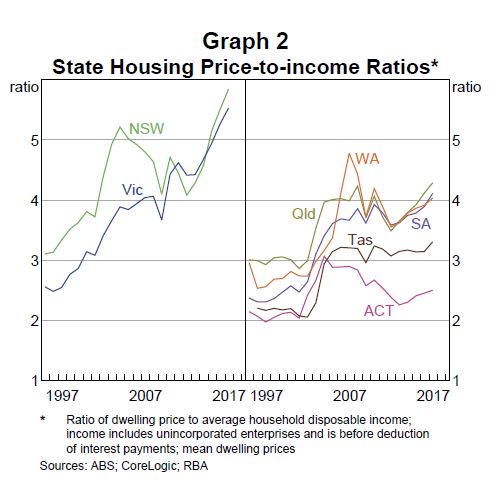
In Australia, the housing price-to-income ratio has increased since the early 1990s, and has increased particularly rapidly over the past five years to reach its highest level on record. At face value, this suggests that housing affordability is at a record low. However, this masks significant differences across states. The recent trend increase in the housing price-to-income ratio is largely due to increases in the ratios in New South Wales and Victoria (Graph 2). The housing price-to-income ratios have increased by less in other states in recent years and suggest that housing affordability in those states is at a similar level to the mid 2000s.

This housing affordability measure accounts for changes in average housing prices and household income. However, it ignores the effect of changes in interest rates on borrowing costs and other financial factors that may affect a household’s purchasing capacity and therefore their ability to purchase a home.

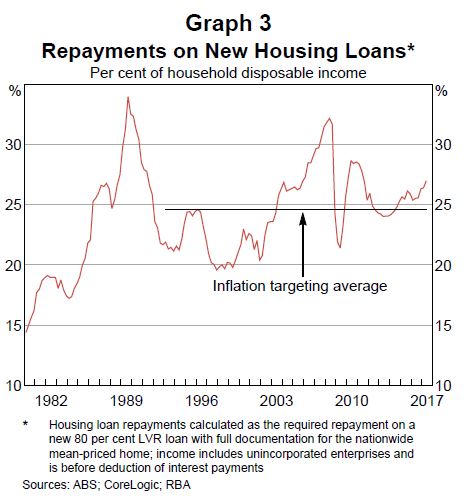
If interest rates fall, households can afford to repay a larger mortgage, all other things being equal. This would be reflected in a lower mortgage debt-servicing ratio, and would imply greater affordability. There is no role for changes to the deposit burden in the mortgage debt-servicing ratio, as the LVR is considered to be fixed. Looking at the trends over time, the aggregate mortgage debt-servicing ratio has risen over the
past year or so and is currently above the average of the inflation-targeting period but below historical peaks

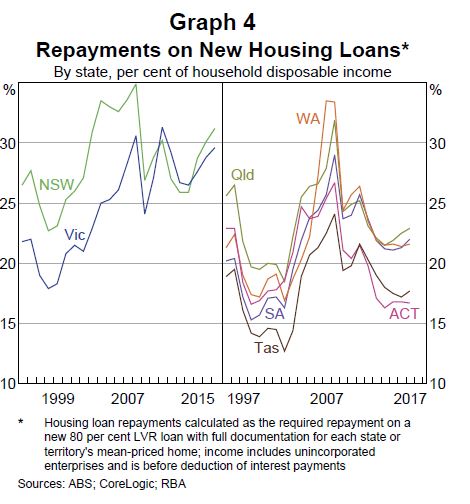
There are significant state variations.

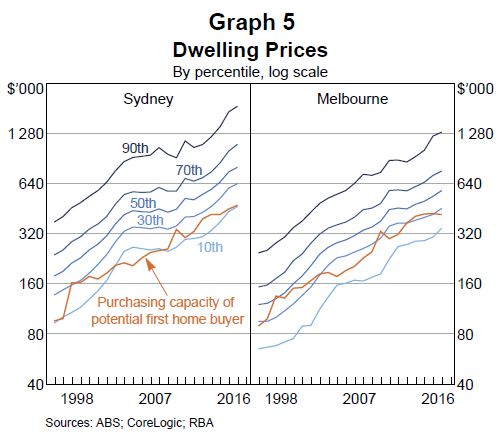
A shortcoming of the conventional estimates of housing affordability is that, by focussing on the average home price and average household income, they measure affordability for the average household. But the typical FHB is not the same as the average household – they tend to be younger and less wealthy. Also, if most FHBs buy homes that are cheaper than the average, then measures that focus on the average home will provide a poor guide to the ability of FHBs to purchase their first home (i.e. housing accessibility). To address these shortcomings, we construct a housing accessibility index that specifically focuses on the purchasing capacity of potential FHBs

This measure combines information from household surveys with data on all housing sale transactions in Australia. It shows housing accessibility is around the long-run average in aggregate in Australia, with the median potential FHB being able to afford around one-third of all homes sold in 2016, although this share is significantly lower in Sydney, Melbourne and Perth. Moreover, the quality of homes that potential FHBs can afford has fallen over time, as measured by location and the number of bedrooms. This measure also shows accessibility is lower in capital cities, particularly in areas close to the CBD.

The cost of renting is also an important component of housing affordability and the number of households renting has trended up over the past few decades. In aggregate, rents have grown broadly in line with household incomes, although rent-to-income ratios suggest housing costs for lower-income households have increased over the past decade.

Housing Affordability Improves For Some

From The Real Estate Conversation.

Housing affordability has improved across all states and territories, allowing for a large increase in the number of loans to first-home buyers, according to the September quarter edition of the Adelaide Bank/REIA Housing Affordability Report.

The report shows the proportion of median family income required to meet average loan repayments decreased by 1.2 percentage points over the quarter to 30.3 per cent. The result was decrease of 0.6 percentage points compared with the same quarter in 2016.

REIA president Malcolm Gunning said first-home buyers now make up 24.5 per cent of the total owner occupied housing market, excluding refinancing.

“This is the highest rate since September 2013,” he said, noting the rate had been dropping steadily for the last five years until this latest rise.

Gunning said the number of first home buyers increased by 22.8 per cent over the quarter and 32.6 per cent over the year.

Darren Kasehagen, Head of Business Development, Adelaide Bank said, “The increase in housing affordability across all states and territories is to be welcomed and is reflected by heightened activity in the number of first home buyers coming back into the market.

“Housing affordability is still a major issue in Sydney and Melbourne, but there are some bright spots in the latest report from the other capitals that are also worthy of note.

The largest increases in first-home buyers were New South Wales (up 57.7 per cent), Victoria (up 32.2 per cent), the Northern Territory (up 14.3 per cent) and the Australian Capital Territory (up 20.0 per cent).

“Nationally, the average loan size to first home buyers increased to $319,500, or by 0.6 per cent over the September quarter – but decreased by 0.1 per cent over the past twelve months,” said Kasehagen.

For all borrowers, the average loan size decreased to $380,900 with the total number of loans increasing by 4.2 per cent for the quarter or 12.5 per cent year on year.

Rental market affordability

The report shows varied affordability across rental markets.

“Over the quarter, the proportion of median family income required to meet rent payments increased by 0.3 percentage points to 24.6 per cent,” said Gunning.

Rental affordability improved in Queensland, South Australia, Western Australia and the Northern Territory, he said, and remained steady in Victoria but declined in New South Wales, Tasmania and the Australian Capital Territory.

Western Australia recorded a “standout” result, said Kasehagen.

Western Australia knocked the ACT from their position of being the state or territory with the lowest proportion of family income devoted to meeting median rents. Western Australians only contribute 17.4 per cent of their family income to rent, according to the report. The figure for Canberra was 18.1 per cent.

“This bides well for future first home buyers in the West seeking to build a deposit and take the step toward eventual home ownership,” said Kasehagen.

In Canberra, 18.5 per cent of family income in Canberra was devoted to meeting average loan repayments – the lowest percentage in the country. The gap between renting and buying in Canberra is now only 0.4 per cent, said Kasehagen.

“An equation that may see more people now renting in the ACT deciding to take the step towards home ownership,” he said.

Adelaide Bank/REIA Housing Affordability Report: State by State

New South Wales

Over the September quarter, housing affordability in New South Wales improved with the proportion of income required to meet loan repayments decreasing to 36.1 per cent, a fall of 1.9 percentage points over the quarter and a decrease of 1.0 percentage points compared with the corresponding quarter 2016. With the proportion of income required to meet loan repayments 5.8 percentage points higher than the nation’s average, New South Wales remained the least affordable state or territory in which to buy a home.

In New South Wales, the number of loans to first home buyers increased to 6,775, an increase of 57.7 per cent over the quarter and a rise of 70.9 per cent compared to the September quarter 2016. Of the total number of first home buyers that purchased during the September quarter, 23.4 per cent were from New South Wales while first home buyers make up 19.0 per cent of the State’s owner-occupier market. The average loan to first home buyers decreased to $361,333, a decrease of 1.2 per cent over the quarter and a decrease of 1.0 per cent compared to the same quarter last year.

Rental affordability, declined in New South Wales over the September quarter with the proportion of income required to meet median rent payments increasing to 29.8 per cent, an increase of 1.2 percentage points over the September quarter and an increase of 1.7 percentage points compared to the same quarter last year.

Victoria

Over the September quarter, housing affordability improved in Victoria with the proportion of income required to meet loan repayments decreasing to 32.2 per cent, a decrease of 1.2 percentage points over the quarter and a decrease of 0.2 percentage points compared to the same quarter of the previous year.

The number of loans to first home buyers in Victoria increased to 8,786, an increase of 32.2 per cent over the quarter and an increase of 33.0 per cent compared to the September quarter 2016. Of the total number of first home buyers that purchased during the September quarter, 30.4 per cent were from Victoria while first home buyers make up 26.2 per cent of the State’s owner-occupier market.

Rental affordability in Victoria has remained steady over the quarter with the proportion of income required to meet median rent remaining at 23.1 per cent. Compared to the September quarter 2016, rental affordability has declined with the proportion of income required to median rent increasing by 0.2 percentage points.

Queensland

Housing affordability in Queensland improved over the September quarter with the proportion of income required to meet home loan repayments decreasing to 26.8 per cent, a decrease of 0.5 percentage points over the quarter and a decrease of 1.0 percentage points compared to the same quarter last year.

Over the September quarter, the number of loans to first home buyers in Queensland increased to 6,271, an increase of 4.5 per cent over the quarter and an increase of 18.5 per cent compared to the same quarter of 2016. Of all Australian first home buyers over the quarter, 21.7 per cent were from Queensland while the proportion of first home buyers of the State’s owner-occupier market was 26.1 per cent.

Rental affordability in Queensland improved over the quarter with the proportion of the median family income required to meet the median rent decreasing to 22.8 per cent, a decrease of 0.2 percentage points over the quarter and a decrease of 0.6 percentage points compared to the same quarter 2016.

South Australia

Over the September quarter, housing affordability in South Australia improved with the proportion of income required to meet monthly loan repayments decreasing to 25.3 per cent, a decrease of 1.5 percentage points over the quarter and a decrease 1.1 percentage points compared to the September quarter 2016.

Over the September quarter, the number of loans to first home buyers in South Australia increased to 1,385, an increase of 2.0 per cent over the quarter and an increase of 12.6 per cent compared to the September quarter 2016. Of all Australian first home buyers over the quarter, 4.8 per cent were from South Australia while the proportion of first home buyers in the state’s owner-occupier market was 19.2 per cent.

Rental affordability in South Australia also improved over the quarter with the proportion of income required to meet rent payments decreasing to 21.7 per cent, a decrease of 0.2 percentage points over the quarter and a decrease of 0.7 percentage points compared to the September quarter 2016.

Western Australia

Over the September quarter, housing affordability in Western Australia improved with the proportion of income required to meet loan repayments decreasing to 22.4 per cent, a decrease of 1.2 percentage points over the quarter and a decrease of 1.4 percentage points compared to the September quarter 2016.

The number of first home buyers in Western Australia increased to 4,432 in the September quarter, an increase of 7.4 per cent over the quarter and an increase of 17.9 per cent compared to the same time last year. Of all Australian first home buyers over the quarter, 15.3 per cent were from Western Australia while the proportion of first home buyers in the state’s owner-occupier market was 36.2 per cent.

Rental affordability in Western Australia also improved during the September quarter with the proportion of family income required to meet the median rent decreasing to 17.4 per cent, a decrease of 0.7 percentage points over the quarter and a decrease of 1.8 percentage points compared to the year before.

Tasmania

Housing affordability in Tasmania improved over the September quarter with the proportion of income required to meet home loan repayments decreasing to 23.3 per cent, a decrease of 0.6 percentage points over the quarter and a decrease of 0.5 percentage points from the September quarter 2016.

The number of first home buyers in Tasmania increased to 386, an increase of 1.6 per cent over the quarter but a decrease of 3.3 per cent compared to the same quarter of the previous year. Of all Australian first home buyers over the quarter, 1.3 per cent were from Tasmania while the proportion of first home buyers in the state’s owner-occupier market was 17.5 per cent.

Rental affordability in Tasmania, however, declined over the quarter with the proportion of income required to meet median rents increasing to 26.3 per cent, an increase of 0.5 percentage points over the quarter and an increase of 2.3 percentage from the same quarter 2016.

Northern Territory

Housing affordability in the Northern Territory improved with the proportion of income required to meet loan repayments decreasing to 19.4 per cent in the September quarter, a decrease of 0.9 percentage points over the quarter and a decrease of 1.1 percentage points when compared to the September quarter 2016.

The number of loans to first home buyers in the Northern Territory increased to 200, an increase of 14.3 per cent over the September quarter and an increase of 37.9 per cent compared to the September quarter 2016. Of all Australian first home buyers over the quarter, 0.7 per cent were from the Northern Territory while the proportion of first home buyers in the Territory’s owner-occupier market was 28.8 per cent.

Rental affordability in the Northern Territory also improved over the quarter with the proportion of income required to meet the median rent decreasing to 22.7 per cent, a decrease of 0.4 percentage points over the quarter and a decrease of 2.0 percentage points compared to the September quarter 2016.

Australian Capital Territory

Housing affordability in the Australian Capital Territory improved over the September quarter with the proportion of income required to meet home loan repayments decreasing to 18.5 per cent, a decrease of 1.3 percentage points over the quarter and a decrease of 1.5 percentage points compared to the same quarter last year.

The number of loans to first home buyers in the Australian Capital Territory increased to 684, an increase of 20.0 per cent over the quarter and an increase of 64.4 per cent compared to the September quarter 2016. Of all Australian first home buyers over the quarter, 2.4 per cent were from the Australian Capital Territory while the proportion of first home buyers in the Territory’s owner-occupier market was 26.8 per cent.

Rental affordability in the Australian Capital Territory, however, declined over the September quarter with the proportion of income required to meet the median rent increasing to 18.1 per cent, an increase 0.2 percentage points over the quarter and an increase of 0.8 percentage points compared to the September quarter 2016.

ABC Radio Does Housing

I had the chance to discuss at some length the latest dynamics of the housing and property markets with ABC’s Jules Schiller on ABC Radio last night.

You can listen to the discussion.

We discussed the concept of affordability to first-time house buyers and the latest Bankwest study which shows how budget-friendly the Australian housing market is today. North says that the country has an existing dilemma to repair in able for younger people to buy houses easily.

North says that giving incentives to first-time buyers will only lessen the interest of the house they are set to buy, adding that it might not help those people. He believes that reforms in the housing sector are needed to solve this issue of unaffordable housing among new buyers. He talks about the different housing prices in the East coast where Sydney resides and the West Coast where Perth is located. He gives advice to first-time buyers when is the right time to buy houses in capital cities in Australia.

He believes that there are several uncertainties concerning the current set-up of the housing market. He says that a Housing Royal Commission is more needed than a Banking one, though this inquiry can affect the housing industry but he is not sure whether first-time buyers will feel the effect once the inquiry is finished. He says that the inquiry should look into how banks are dealing with mortgage payments and other transactions.

He cannot say whether foreign ownership of some houses and lands in the country are largely affecting the first-time buyers but it is a factor. He says that there are many markets where first-time buyers can invest like Adelaide, Hobart and Brisbane.

Auction Volumes Lower Slightly

From CoreLogic.

There were 3,276 auctions held across the combined capital cities this week, returning a preliminary auction clearance rate of 63.5 per cent, increasing on last week’s final auction clearance rate of 61.1 per cent when the combined capitals recorded the third busiest week for auctions so far this year (3,438). Over the same week last year, auction volumes were similar to this week (3,207), although the clearance rate was considerably higher at 72.3 per cent.

Across the two largest auction markets, Melbourne and Sydney, both cities saw an increase in the rate of clearance over the week, however the 66.0 per cent preliminary clearance rate across Melbourne is only slightly higher than last week’s final; this is likely to revise lower as final results are collected and potentially surpass last week as the lowest seen since June 2016. While the performance across the smaller markets was varied this week, with Canberra recording the highest preliminary clearance rate of 75.6 per cent, while only 44.9 per cent of homes sold across Brisbane.

2017-12-04--auctionresultscombinedcapitalcities

Mortgage Stress Continues On a High Plateau In November

Digital Finance Analytics has released the November mortgage stress and default analysis update. Across Australia, more than 913,000 households are estimated to be now in mortgage stress (last month 910,000) and more than 21,000 of these in severe stress, the same as last month. Stress is sitting on a high plateau. This equates to 29.4% of households. We see continued default pressure building in Western Australia, as well as among more affluent household, beyond the traditional mortgage belts across the country. Stress eased a little in Queensland, thanks to better employment prospects.

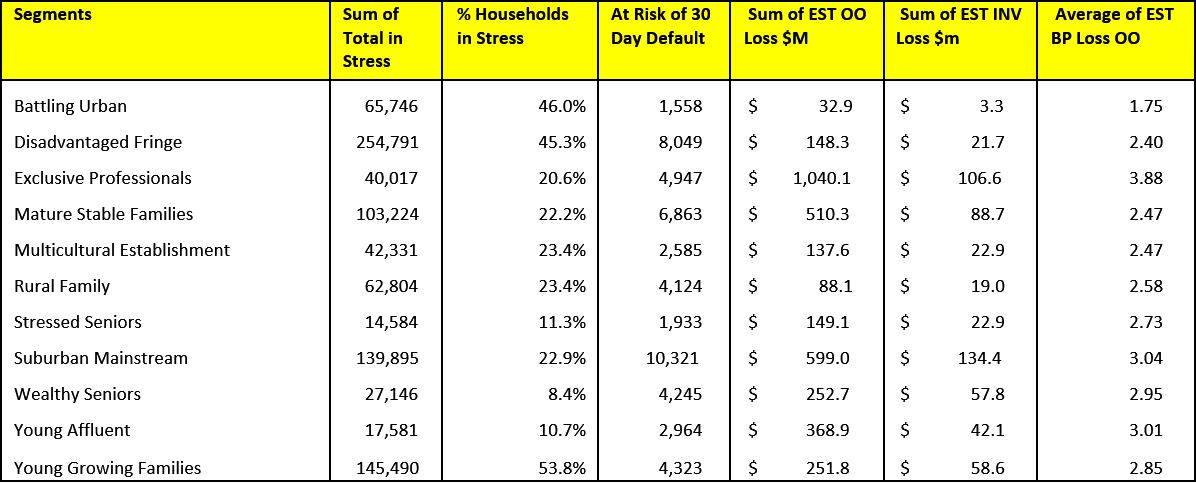
We estimate that more than 52,000 households risk 30-day default in the next 12 months, similar to last month. We expect bank portfolio losses to be around 2.8 basis points, though with losses in WA rising to 4.9 basis points.

We discuss the findings from our analysis and count down the top 10 post codes, to identify the most highly stressed post code currently in the country.

As continued pressure from low wage growth and rising costs bites, those with larger mortgages are having more difficulty balancing the family budget. As a result, risks in the system continue to rise, and while recent strengthening of lending standards will help protect new borrowers, there are many households currently holding loans which would not now be approved. These stressed households are less likely to spend at the shops, which will act as a further drag anchor on future growth, one reason why retail spending is muted. The number of households impacted are economically significant, especially as household debt continues to climb to new record levels. Mortgage lending is still growing at three times income. This is not sustainable. The latest household debt to income ratio is now at a record 193.7.[1]

Our analysis uses the DFA core market model which combines information from our 52,000 household surveys, public data from the RBA, ABS and APRA; and private data from lenders and aggregators. The data is current to end November 2017. We analyse household cash flow based on real incomes, outgoings and mortgage repayments, rather than using an arbitrary 30% of income.

Households are defined as “stressed” when net income (or cash flow) does not cover ongoing costs. Households in mild stress have little leeway in their cash flows, whereas those in severe stress are unable to meet repayments from current income. In both cases, households manage this deficit by cutting back on spending, putting more on credit cards and seeking to refinance, restructure or sell their home.  Those in severe stress are more likely to be seeking hardship assistance and are often forced to sell.

The forces which are lifting mortgage stress levels remain largely the same. In cash flow terms, we see households having to cope with rising living costs whilst real incomes continue to fall and underemployment remains high. Households have larger mortgages, thanks to the strong rise in home prices, especially in the main eastern state centres. While mortgage rates remain quite low for owner occupied borrowers, those with interest only loans or investment loans have seen significant rises.  We expect some upward pressure on real mortgage rates in the next year as international funding pressures mount, a potential for local rate rises and margin pressure on the banks. We revised our expectation of potential interest rate rises, given the stronger data on the global economy and the recently announced Finance Sector  Royal Commission.

Probability of default extends our mortgage stress analysis by overlaying economic indicators such as employment, future wage growth and cpi changes.  We have also extended our Core Market Model to examine the potential of portfolio risk of loss in basis point and value terms. Losses are likely to be higher among more affluent households.

Gill North, Joint DFA Principal and Professorial Research Fellow in the law school at Deakin University, said “the numbers of households in mortgage and financial stress in Australia are at record levels and the consequential risks and likely adverse impacts are difficult to overstate. When external events and or the personal circumstances of these highly indebted households deteriorate, the number of people who cannot afford to rent or purchase a home is likely to increase exponentially, leaving many more households without adequate accommodation. In extreme instances, other households may lose the residential property they presently live in due to rental defaults or a forced sale or foreclosure.”

While there have been numerous inquiries into housing affordability and homelessness in Australia, the issues involved are complex, and real progress has been limited (at best). For policy options to make any meaningful difference to the nature and scale of housing affordability and homelessness, policy makers and others need to acknowledge the sheer magnitude of the problem, and respond accordingly.

One of the options that policy makers have considered to address affordable housing issues and to provide housing for the most vulnerable sections of the community is the use of social impact investment.  Gill North was part of a team that reviewed the potential for impact investment models to provide housing for the vulnerable and reported to the Australian Housing and Urban Research Institute (AHURI). The report on “Supporting Vulnerable Households To Achieve Their Housing Goals: The Role Of Impact Investment” is available from https://ssrn.com/author=905894. The report authors acknowledge and thank AHURI for the funding that allowed this important research”.

By the Numbers

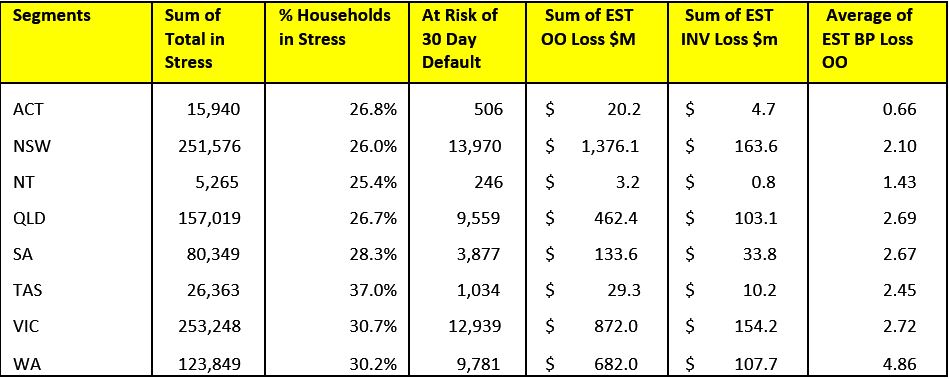
Regional analysis shows that NSW has 251,576 households in stress (242,399 last month), VIC 253,248 (250,259 last month), QLD 157,019 (162,726 last month) and WA 123,849 (121,393 last month). The probability of default rose, with around 9,800 in WA, around 9,600 in QLD, 13,000 in VIC and 13,900 in NSW.

The largest financial losses relating to bank write-offs reside in NSW ($1.3 billion from Owner Occupied borrowers) and VIC ($870 million from Owner Occupied Borrowers, which equates to 2.1 and 2.7 basis points respectively. Losses are likely to be highest in WA at 4.9 basis points, which equates to $682 million from Owner Occupied borrowers and $108 million from Property Investors over the next 12 months.

You can request our media release. Note this will NOT automatically send you our research updates, for that register here.

[contact-form to=’mnorth@digitalfinanceanalytics.com’ subject=’Request The Nov 2017 Stress Release’][contact-field label=’Name’ type=’name’ required=’1’/][contact-field label=’Email’ type=’email’ required=’1’/][contact-field label=’Email Me The Nov 2017 Media Release’ type=’radio’ required=’1′ options=’Yes Please’/][contact-field label=”Comment If You Like” type=”textarea”/][/contact-form]

Note that the detailed results from our surveys and analysis are made available to our paying clients.

[1] RBA E2 Household Finances – Selected Ratios June 2017

Auction Volumes Fall This Week

The latest results from Domain show that the volume of auctions this week was lower, and last week the clearance rate ended up at a weak 58.7% nationally.  More evidence that momentum is easing, especially in Sydney.

Brisbane cleared 45% of 131 scheduled, Adelaide 58% of 87 and Canberra 77% of 81 auctions scheduled, so the strongest result.


What The Royal Commission Means For Home Prices – The Property Imperative Weekly 2nd December 2017

The Banking Royal Commission is on, Housing credit is still growing strongly, and home prices in Sydney are slipping. So plenty to discuss in this week’s Property Imperative weekly to 2nd December 2017.

Watch the video, or read the transcript.

In this week’s review of finance and property news we start with the announced $75 million Royal Commission into Financial Services, which after lots of wrangling was announced this week. I will leave the politics alone, but as Fitch Ratings said, the inquiry into alleged misconduct adds challenges to the financial system and the findings could weaken the reputation of individual players, or possibly expose wider structural weaknesses.

So we think uncertainty about whether there will be an inquiry, and what scope it would cover, has been replaced by potential uncertainty of outcome. OK, the scope has been crafted to include a wide gamut of players, from banks, insurers and superannuation funds, but it is narrow because it will only look at misconduct against community expectations. It will touch on culture and governance (and this poses the question of the relationship between misconduct and culture) and it is tasked to make recommendations (but steering around other parallel work including the vertical integration which the Productivity Commission is looking at, and ACCC’s work on pricing).  So it will likely focus on the well-trod paths of poor financial advice, bad insurance policy outcomes and inappropriate handling of SME’s when they get into financial difficulty. We hope the inquiry will specifically look at the various conflicts of interest which currently exist across the sector.

Credit and lending policies appear to be in scope, but we will have to wait and see whether they are explored, along with the role of financial advisers and mortgage brokers.  The scope does not touch on broader policy or regulatory issues (such as macroprudential) but could conceivably cover lending standards and “liar loans”. One potential outcome could be to lift the lid on “not unsuitable” lending.  It will not consider the disruptive intrusion from digital or Fintech.

What we can say is the banks and the Government clearly decided to cut their losses in the light of a potentially broader and more detailed scope which was being discussed on the back bench. This way they are controlling the agenda, at least to some extent. An interim report is expected next September.

Lots of economic news came out this week. The ABS Dwelling approvals for October were stronger than expected, reaching more than 19,000, the highest since August 2016. Growth in Victoria drove approvals higher up 3.8% – whilst there was a fall in New South Wales, down 0.3%.  We are still seeing the strongest demand for property in VIC, thanks to strong migration, though supply and demand is patchy as the recent ANU study highlighted. Overall this suggest more property will continue to come on the market for sale, putting further downward pressure on prices.

The RBA’s Credit Data for October showed that lending for housing rose 0.5% in the month, and 6.5% for the past year (three times inflation!).  Lending to business rose 0.3% to 4% over the past year and personal credit was flat, and fell 0.9% over the past year. Another $1.2 billion of housing loans were reclassified in the month, making $60 billion in total, this is more than 10% of the total investment loan book! The proportion of investor loans fell slightly again, down to 34.2% of portfolio. Total mortgage lending is now above $1.7 trillion, with owner occupied loans up 0.6% or $6.6 billion to $1.12 trillion, and investor loans up 0.2% or $1.2 billion to $584 billion. Comparing this with the APRA data, we see continued relative growth in the non-bank sector.

The parallel ADI data from APRA to end October 2017 shows that banks continue to lend strongly to households. The overall value of their mortgage portfolios grew 0.5% in the month to $1.57 trillion, up $7.3 billion. Owner occupied loans grew 0.6% to $1.03 trillion, up $6.4 billion and investment loans rose 0.15% to $816 million. The proportion of investment loans continues to drift lower, but is still at 34.8% of all lending (too high!!). CBA reduced their investment portfolio this month, whilst Westpac grew theirs. Investor lending market growth is sitting at around 3% over the past year, though some smaller lenders are well above the APRA 10% speed limit.

There is simply no excuse to allow home lending to be running at more than three times inflation or wage growth at the current dizzy price and leverage levels. There is still too much focus on home lending and not enough on productive growth enabling business lending. This is something which the Royal Commission is unlikely to touch, as it is a policy, not a behavioural issue.

The OECD report on Australia said things are looking better. As a result, they recommend rate hikes next year to help cool the housing market. But they call out a number of risks to economic growth and says macro-prudential measures should be maintained. Also their growth rates are lower than latest from the RBA! They also said Australia is vulnerable to “too big to fail” risks, due to its highly concentrated banking sector.

The Reserve Bank NZ has been more proactive on managing risks in the housing sector. They announced a slight reduction in tight loan to value lending controls, in response to slowing housing demand and new Government policies.  The loan-to-value ratio (LVR) policy was first introduced in October 2013, with progressively tighter restrictions for investors introduced in November 2015 and October 2016. From 1 January 2018, the LVR restrictions will require that:

  • No more than 15 percent (currently 10 percent) of each bank’s new mortgage lending to owner occupiers can be at LVRs of more than 80 percent.
  • No more than 5 percent of each bank’s new mortgage lending to residential property investors can be at LVRs of more than 65 percent (currently 60 percent).

They had previously parked their Loan to Income initiative, in the light of easing momentum.

The Gratton Institute published a report which showed rising housing costs are hurting low-income Australians the most. Those at the bottom end of the income spectrum are much less likely to own their own home than in the past, are often spending more of their income on rent, and are more likely to be living a long way from where most jobs are being created. in 1981 home ownership rates were pretty similar among 25-34 year old’s no matter what their income. Since then, home ownership rates for the poorest 20% have fallen from 63% to 23%. Home ownership rates also declined more for poorer households among older age groups. Home ownership now depends on income much more than in the past.

They say that reducing demand – such as by cutting the capital gains tax discount and abolishing negative gearing – would reduce prices a little. But in the long term, boosting the supply of housing will have the biggest impact on affordability. To achieve this, state governments need to change planning rules to allow more housing to be built in inner and middle-ring suburbs.

So now to home prices. According to ME Bank, in a study of 1500 Australian adults, 43% of respondents said they were reliant on future house prices to achieve future life / financial goals, with 10% completely reliant. But it’s a tug-of-war as to which way we want prices to go: 38% want prices to increase while 37% want them to fall. Where you sit largely comes down to your property ownership status: 39% of those who own the home they live in and 47% who own an investment property indicated they are ‘reliant’ on future prices, presumably increasing, while 48% of those who don’t own a property also say they are reliant, presumably wanting prices to fall. Most tellingly, the survey indicates more Australians would benefit from property prices falling than rising, with only 28% indicating they’d benefit by selling if prices continued to rise compared to 47% who said they’d benefit by buying in if property prices fell.

But then again, according to CANSTAR nearly four out of five Australians don’t see house prices falling in their state over the next two years. CANSTAR surveyed 2,026 consumers on their views on property prices and home buying. Nationally, 47% of respondents expected steady growth in house prices, with a further 8% predicting prices would ‘skyrocket at some point’. Just 11% of respondents thought prices could fall in the next two years. Sydney was the most pessimistic city, with 16% predicting values would fall.

CoreLogic’s home price index reported a 0.1% fall nationally in November, with Sydney recording a 0.7% falls, along with falls across Darwin and regional Northern Territory, down 0.4% over the month. For the remaining broad regions of Australia, dwelling values were relatively steady, or experienced a subtle rise, over the month. However, the averages hide significant variations, with for example more expensive homes sliding further relative to cheaper ones.  National dwelling values tracked 0.2% higher over the past three months and have increased 5.2% over the twelve months ending November. The national annual growth rate has now halved since reaching a recent peak in May 2017, when dwelling values rose 10.4%.

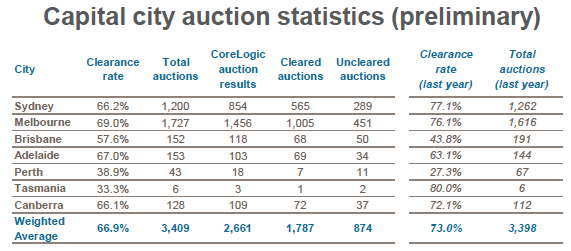
CoreLogic also says there were 3,409 homes taken to auction across the combined capital cities last week, returning a preliminary auction clearance rate of 66.9 per cent, overtaking the previous week as the third busiest for auctions so far this year. Last week, based on final results, 60.9 per cent of the 3,390 auctions held recorded a successful result, the lowest clearance rate since late 2015/early 2016.

But auction clearance rates may be lower than the CoreLogic figures suggest according to John Cunningham, president of the REINSW. Cunningham said that 40 per cent of results have not been reported, and if those results represent a no sale, then the clearance rate for Sydney could be a lot lower than the 66 per cent being reported by CoreLogic. With an initial clearance rate again in the mid 60 per cent range, the lack of clear data from the 40 per cent of unreported results fails to provide us with the real picture of the market,” he said.

More evidence of tighter lending standards, with CBA revealing a raft of changes including LVR caps and restrictions to rental income for serviceability that will impact mortgage brokers and their clients from next week. CBA will be introducing a new Home Loan Written Assessment document called the Credit Assessment Summary (CAS) for all owner occupied and investment home loan and line of credit applications solely involving personal borrowers. Meanwhile, CBA confirmed that it will introduce credit policy changes for certain property types in selected postcodes from Monday 4 December. They will reduce the maximum LVR without LMI from 80 per cent to 70 per cent, reducing the amount of rental income and negative gearing eligible for servicing and changing eligibility for LMI waivers including all Professional Packages and LMI offers for customers financing security types in some postcodes. “We continue to lend in all postcodes across Australia,” CBA said.

More rate cuts were announced this week, with Heritage Bank cutting the rate on new owner occupied loans by up to 50 basis points, and 30 basis points on new investment loans.  They want to build and keep attracting new customers to the bank as part of a nationwide growth strategy. This will put more pressure on margins.

KPMG released their 2017 Mutuals Industry Review. Under the hood, the sector is under pressure, despite asset growth. COBA said they welcome the backing from KPMG, which highlighted strong financial performance. We are not so sure.  Sure, assets are growing, but at what cost? KPMG says: profits before tax declined by 4.3 percent to $605.7 million. This compares to the major banks which saw profits grow by 7.6 percent. The net interest margin (NIM) continued to tighten and decreased to 2.03 percent, down 11 basis points.  The increasing pressures on net interest margin is a result of historically low interest rates and increasing competition in the marketplace. Mutuals have sacrificed margins to maintain and grow the membership base. The average capital adequacy ratio dropped 30 basis points to 17.2 percent in 2017, representing a decline in capital levels for the fourth consecutive year. This reflects the increasing prioritisation of effective capital use by mutuals. As limited equity funding is inherent within the mutuals’ current business model and capital growth through new profits have been constrained this year, mutuals have looked to existing capital bases to fund balance sheet growth.

We think the Royal Commission will tend to drive international funding costs higher (they were already going higher), and as banks have around 30% of their books funded offshore, this will put more pressure on margins and local mortgage rates. In addition, we are still forecasting a cash rate hike next year, so more pressure on mortgage rates there. At the same time lending standards continue to be tightened, so borrowers will need a larger deposit especially in some higher risk areas. Mortgages are set to become more expensive and harder to get. Also, more new property is set to come onto the market, and as home price momentum eases, this will tend to push prices lower.  So we can suggest several reasons why prices will go lower, but non to make them rise. So on that basis, the 80% of households expecting prices to keep rising are in for a rude awakening.

And that’s the Property Imperative weekly to 2nd December 2017. If you found this useful, do leave a comment or subscribe to receive future updates. Check back next week for our latest update, which will include November Mortgage Stress results. Many thanks for taking the time to watch.

Sydney’s true clearance rate could be 40%

From The Real Estate Conversation.

The current state of the property market in Sydney is still unclear following on from another weekend of auction results,” John Cunningham, president of the REINSW, told SCHWARTZWILLIAMS.

Cunningham said that 40 per cent of results have not been reported, and if those results represent a no sale, then the clearance rate for Sydney could be a lot lower than the 66.2 per cent being reported by CoreLogic.

Source: CoreLogic.

“With an initial clearance rate again in the mid 60 per cent range, the lack of clear data from the 40 per cent of unreported results fails to provide us with the real picture of the market,” he said.

“How many were withdrawn, how many were passed in, how many had no bids, needs to be known to get a clear picture,” said Cunningham.

“If we consider the worst case scenario that this missing 40 per cent did not sell, then the true clearance rate is 65 per cent of 60 per cent being 40 per cent,” said Cunningham.

“The reality from the word in the street is more like over 50 per cent of properties listed for auction at present are either selling at or before auction,” clarified Cunningham.

With so much uncertainty about auction clearance rates, Cunningham said the days on market “becomes the true test of what is really happening”. In the past year, days on market has risen from 33 days to 49 days, he said.

“It is sometimes taking longer to get vendors and buyers aligned on price,” said Cunningham.

Agent Nigel Mukhi from McGrath Lower North Shore Neutral Bay told SCHWARTZWILLIAMS he agrees with Cunningham’s assessment.

Though Mukhi said that the trend doesn’t apply to his office, when his competitors withdraw a property from auction or if they don’t sell, they don’t report the result.

Mukhi said that his office is achieving a clearance rate of 82 per cent, and that Sydney has to be analysed area by area.

Higher volumes weighing on Melbourne’s clearance rate

REIV President Richard Simpson told SCHWARTZWILLIAMS that the latest REIV data shows that 1,305 homes went to auction last weekend, recording a preliminary clearance rate of 69 per cent.

“Victoria’s weekly clearance rate has dipped below 70 per cent for the first time since June last year, as high auction volumes start to meet buyer demand.”

High auction volumes are set to continue, said Simpson, with around 1,300 auctions scheduled this coming weekend and a further 1,450 the following week.

“The city’s strong auction market is set to continue well into December with more than 3,600 auctions scheduled throughout the month,” said Simpson.

Regional areas experiencing strong clearance rates, said Simpson, especially Greater Geelong which achieved a clearance rate of 82 per cent.

Soft Northern Territory clearance rate

The Northern Territory recorded soft auction clearance rates last week, according to Karl Secondis of One Real Estate.

“Overall our market had a soft clearance rate of just 27 per cent,” he wrote in his report ‘The Auctioneer’.

“A large number of new listings have just hit the market this week which has strengthened auctions numbers in the final weeks leading into Christmas with a bumper week of over 30 auctions set to take place in week 49,” he wrote.

Five properties will go to auction in Gove on Wednesday night