The ABS And Productivity Commission Both Downplayed Growing Inequality

From The Conversation.

We now know the Bureau of Statistics did quite a bit of soul-searching before producing the bland and ultimately misleading press release headed “Inequality Stable Since 2013-14” last month.

Late last week we pointed to the odd way in which the release included no data to back up the claim, and how journalists from the ABC and Sydney Morning Herald and Age quickly discovered the statistics it purported to summarise actually showed wealth inequality climbing.

Sydney Morning Herald

On Wednesday in The Guardian, Paul Karp revealed the contents of documents released under freedom of information laws that shed light on the creation of the press release.

An earlier draft had pointed to a “significant increase” in wealth inequality compared with 2011–12 and 2003–04.

Australian Bureau of Statistics disclosure log

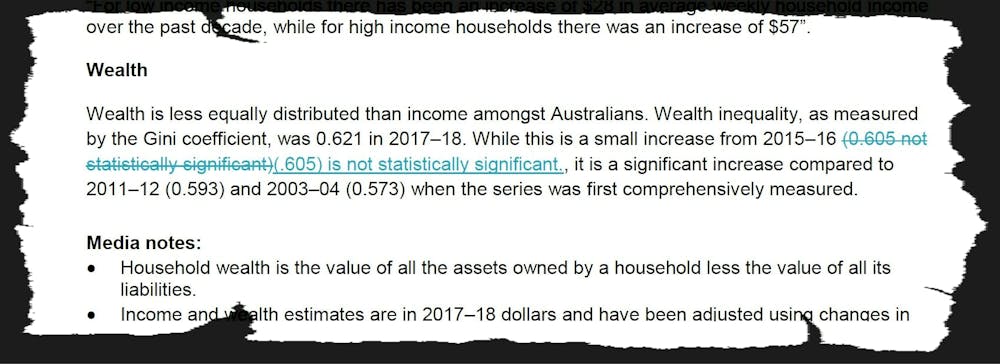
The phrase “significant increase” didn’t survive the editing process.

A reference to a measure of wealth inequality being “at its peak” since it was first comprehensively measured in 2003-04 was also removed after a direction to “focus on income over wealth”.

Australian Bureau of Statistics disclosure log

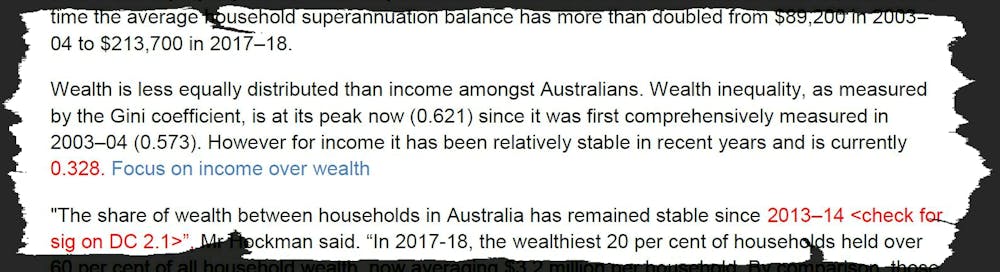
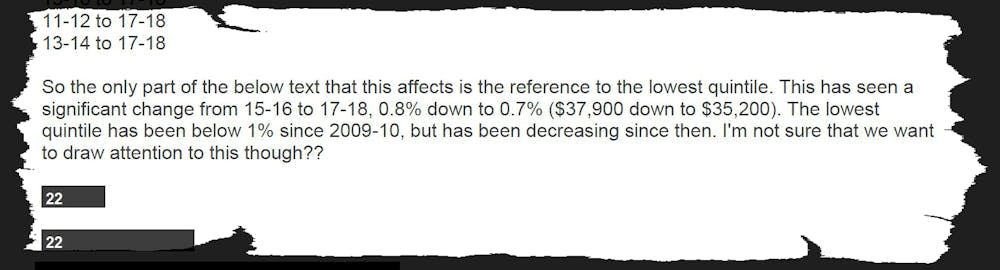
Another email noted there has been “a significant (downward) change” in the wealth share of the bottom fifth of households, but added: “I’m not sure that we want to draw attention to this though??”

Australian Bureau of Statistics disclosure log

The Bureau responded to the Guardian article on Wednesday, saying it had not attempted to misrepresent the data, and that it prepared the press releases “internally with no external influence”.

It’s not just the ABS

It’s not only the Bureau of Statistics that has found it difficult to draw attention to increasing wealth inequality.

In August last year the Productivity Commission released what it called a stocktake of the evidence on inequality, titled “Rising Inequality?”.

It wasn’t so much a “stocktake of the evidence” as a showcase of new specially assembled evidence that conflicted with a wider body of evidence that shows wealth inequality increasing.

The Commission’s contribution presented the wealth shares for the top 10% of Australian households only.

These came not from publicly available data, but from “confidential unit record files” made available to approved users by the Australian Bureau of Statistics.

We have presented the microdata in its raw form below, alongside four other well-established and widely published series.


For notes, see full paper: Inequality stocktake … or snowjob? Evatt Journal, November 2018

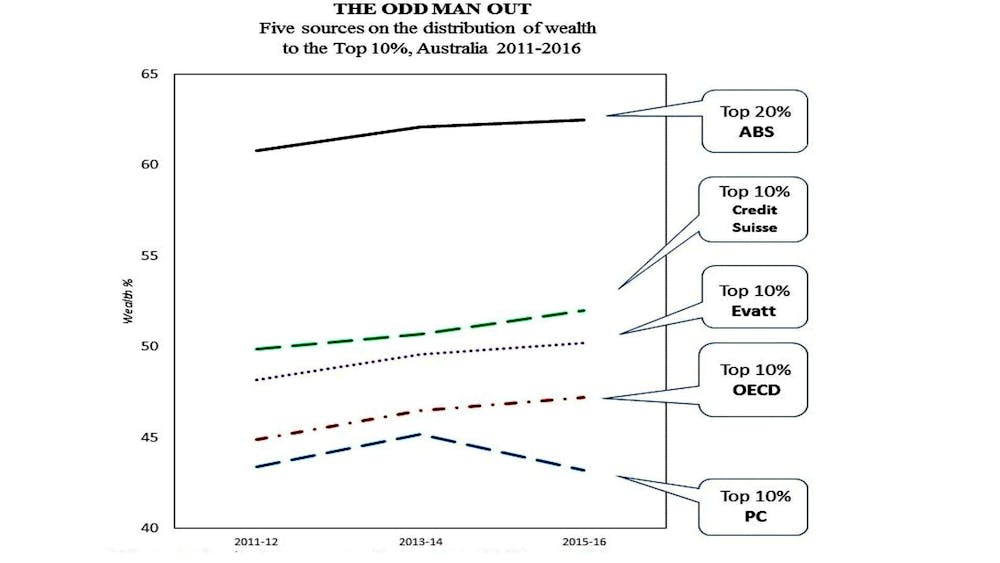
The striking feature is that every line except the Productivity Commission’s shows inequality increasing since 2011.

The data from both Credit Suisse (on which Oxfam bases its research) and the Evatt Foundation suggest that the top 10% now own more than half the nation’s household wealth, and the Organisation for Economic Co-operation and Development’s 47.2% is just a little less.

The Productivity Commission is an outlier in finding the top 10% own closer to 40%. Its finding that the share has been falling between 2013-14 and 2015-16 makes it even more of an outlier.

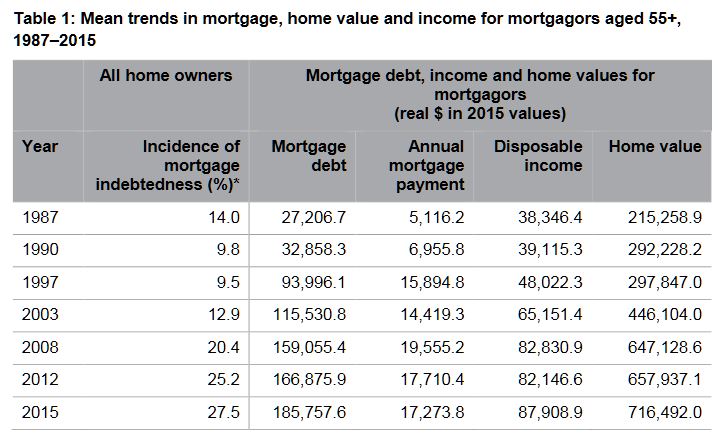
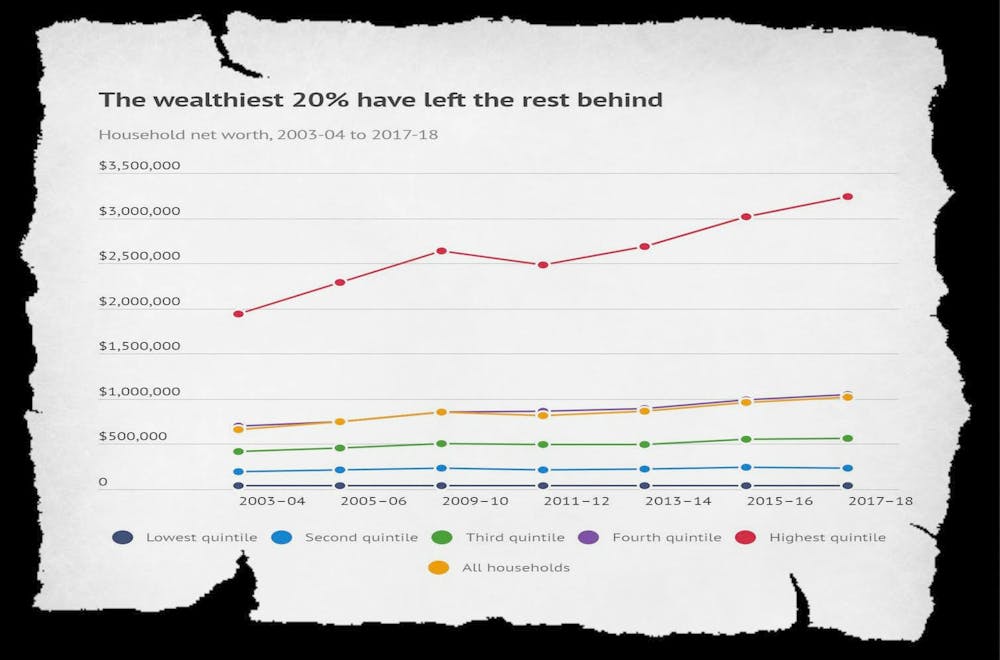
Beyond the bland headline, the latest statistics from the Bureau confirm our analysis of growing wealth inequality.

The Commission’s results are implausible

Our suspicions were aroused when the Productivity Commission’s results appeared to be incompatible with the Bureau’s published findings, of which they were a subset.

The Bureau’s data showed the share of wealth held by the top 20% climbing, while the Commission’s series showed the share held by the top 10% falling – implying that the share of the next top 10% must have been climbing quite a lot.

The divergence strained credulity. There are no advantages in accumulating wealth that apply to households in the second top decile that do not apply with at least equal force to those in the top decile.

Without an outside explanation (such as an extra tax applying only to the top 10%) the result is so improbable as to seem impossible.

Other data available from the Bureau at the time showed that the ratio of the wealth of households 10% from the top to the wealth of those 10% from the bottom had climbed, while at the same time the Commission found the wealth share of the top 10% overall had fallen.

Unfortunately, the Commission gave pride of place to its own findings over and above more conventional findings, and used a question mark in the title of its paper “Rising Inequality?” to imply that it might not be.

As we wrote here last week, wealth inequality and its effects matter. Australians need the truth about how much it is growing.

Authors: Christopher Sheil, Visiting Senior Fellow in History, UNSW; Frank Stilwell, Emeritus Professor, Department of Political Economy, University of Sydney

The Property Supply Demand Disequilibrium

Digital Finance Analytics will be releasing the results from our rolling household surveys over the next few days. This is the first in the series.

These are the results from our 52,000 households looking at property buying propensity, price expectations and a range of other factors.

We use a segmented approach to the market for this analysis, and in our surveys place households in one of a number of potential segments.

Want To Buys: households who would like to buy, but have no immediate path to to purchase. There are more than 1.5 million households currently in this group.

First Timers: first time buyers with active plans to purchase. There are around 350,000 households in this segment.

Up-Traders: households with plans to buy a larger property (and sell their current one to facilitate the up-sizing. There are around 1 million households in this group.

Down Traders: households wishing to sell and down size, sometimes buying a smaller property at the same time. There are around 1.2 million households in this group.

Some of these households will hold investment property as well. We categorise investors into one of two groups.

Solo Investors: households with one or two investment properties. There are about 940,000 of these.

Portfolio Investors: households with more than two investment properties. There are around 170,000 of these.

Finally we also identify those who are planning in refinance existing loans, but are not intending to buy or sell property – flagged as Refinancers, and those with no plans to buy, sell or refinance – flagged as Holders.

It is the interplay of all these segments which drives the property market and demand for mortgages.

Around 72% of households are property active – meaning they want to buy, sell, or own property. More than 28% are property inactive, meaning they rent, live with parents or in other arrangements. Our surveys track all household cohorts. A greater proportion are falling into the inactive category.

Intention To Transact Is Rising (From A Low Base)

We ask about households intentions to transact in the next 12 months, and whether they will be buy-led (seeking to purchase a property first) or sell-led (seeking to sell a property first). (Click on Image To See Full Size).

Property investors are still coy (hardly surprising given the fall in capital values, the switch to P&I loans and receding rentals. But Down Traders, First Time Buyers and Refinancers are showing more intent.

We will look at the drivers by segment in a later post.

But the Buy Side and Sell Side Analysis is telling

Those seeking to buy are being led by First Time Buyers and Down Traders.

Those looking to sell are being led by the Down Traders, and Property Investors. In fact this suggests we will see a spike in listings as we move into spring.

Our equilibrium model suggests that currently supply is not meeting demand (adjusted for property types and locations) in a number of prime Sydney and Melbourne locations, within 30 minutes of the CBD. But beyond that demand is below current supply, and more is coming.

On this basis, we expect to see some local price uplifts, but not a return to the rises a couple of years back. What is clear, is that the property investment sector continues to slumber, and Down Traders are getting more desperate to sell.

Finally, today demand for more credit is coming from Up-Traders, First Time Buyers and Refinancers. Not Investors.

And price expectations seem to be on the improve, driven by investors. But it is still lower than a couple of years ago.

Next time we will dive into the segment specific drivers.

Older Australians Mortgage Debt Up 600 per cent; Impacting Mental Health

Between 1987 and 2015, average real mortgage debt among older Australians (aged 55+ years) blew out by 600 per cent (from $27,000 to over $185,000 in $2015), while their average mortgage debt to income ratios tripled from 71 to 211 per cent over the same period, according to new AHURI research.

The research, Mortgage stress and precarious home ownership: implications for older Australians, undertaken for AHURI by researchers from Curtin University and RMIT University, investigates the growing numbers of older Australians who are carrying high levels of mortgage debt into retirement, and considers the significant consequences for their wellbeing and for the retirement incomes system.

‘Our research finds that back in 1987 only 14 per cent of older Australian home owners were still paying off the mortgage on their home; that share doubled to 28 per cent in 2015’, says the report’s lead author, Professor Rachel ViforJ of Curtin University.

‘We’re also seeing these older Australians’ mortgage debt burden increase from 13 per cent of the value of the average home in the late 1980s to around 30 per cent in the late 1990’s when the property boom took off, and it has remained at that level ever since. Over that time period, average annual mortgage repayments have more than tripled from $5,000 to $17,000 in real terms.’

When older mortgagors experience difficulty in meeting mortgage payments, wellbeing declines and stress levels increase, according to the report. Psychological surveys measuring mental health on a scale of 0 to 100 reveal that mortgage difficulties reduce mental health scores for older men by around 2 points and an even greater 3.7 points for older women. Older female mortgagors’ mental health is more sensitive to personal circumstances than older male mortgagors. Marital breakdown, ill health and poor labour market engagement all adversely affect older female mortgagors’ mental health scores more than men’s.

‘These mental health effects are comparable to those resulting from long-term health conditions,’ says Professor ViforJ. ‘As growing numbers of older Australians carry mortgages into retirement the rising trend in mortgage indebtedness will have negative impacts on the wellbeing of an increasing percentage of the Australian population.’

High mortgage debts later in life also present significant challenges for housing assistance programs. The combination of tenure change and demographic change is expected to increase the number of seniors aged 55 years and over eligible for Commonwealth Rent Assistance from 414,000 in 2016 to 664,000 in 2031, a 60 per cent increase. As a consequence the real cost (at $2016) of CRA payments to the Federal budget is expected to soar from $972 million in 2016, to $1.55 billion in 2031. The unmet demand for public housing from private renters aged 55+ years is also expected to climb from roughly 200,000 households in 2016, to 440,000 households in 2031, a 78 per cent increase.

There are also challenges for Government retirement incomes policy. The burden of indebtedness in later life is growing; longer working lives and the use of superannuation benefits to pay down mortgages are increasingly likely outcomes.

Confusion around credit reports rife among Aussie consumers

Australians are still confused about what goes into their credit report, despite it being an important record of their credit health, according to research by consumer education website, CreditSmart.

The CreditSmart survey found that nearly three quarters of Australians assume their credit score is included in their credit report. One in five mistakenly believe that marital status, income, insurance claims and even traffic fines form part of their credit report.

Commenting on the findings, Geri Cremin, Credit Reporting Expert at CreditSmart, said: “If you are applying for a credit card, a personal loan or even applying to change your mobile phone provider, your credit report can make or break your application.

Your credit report is a snapshot of your credit history and current credit health – so lenders do look at your credit report, and you should too.”  

“Your credit report is a way for lenders to see how you handle the credit you currently have and assess whether the credit you’re applying for is right for you. Better still, a good credit report might open the door to better deals.”

Who’s accessing your credit report?

How credit reports are used is also unclear to many Australians. The majority of consumers know their credit report can be checked when they apply for a home loan, however:

  • Less than 50% are aware that it can also be checked when taking out a new mobile phone contract or opening a new gas or electricity account.
  • Four in ten also wrongly believe their credit report is checked when applying to rent a property.
  • 30% believe that their credit report is checked when they take out home insurance.
  • 13% also think that a future employer checks their credit report when they apply for a job.

“By law, your credit report can only be accessed by others in limited circumstances. For example, your credit report can’t be accessed by a real estate agent when you apply to rent a house, an insurer when you apply for car or home insurance or by a potential employer when you apply for a job,” added Ms Cremin. 

Aussies love credit, but feel it’s getting harder to access

CreditSmart’s research showed that Australians are enthusiastic users of credit, with three quarters (76%) currently using some form of credit product.

Credit cards (56%), home loans (29%), vehicle finance (12%), Buy Now Pay Later services (12%) and personal loans (12%) were the most popular types of products used by Australian consumers who responded to the CreditSmart survey.

The survey also found that four in 10 Australians think it is harder to get credit now than it was 12 months ago. They say the reasons are:

  • lenders doing tighter credit checks (57%)
  • tougher regulation around credit (54%) and
  • lenders looking at bank statements and daily expenses more closely (41%)
  • declining property market (22%)

“As Australians feel credit is getting harder to access, it’s important to take charge of your individual credit health. A great first step is to check your credit report – understand what’s on it and get on top of your monthly repayments. Lenders look to your credit health to determine your attractiveness as a customer, so it is important to know where your credit health stands,” Ms Cremin said.

“We recommend checking your credit report annually and really treat it as an asset that will help you access the right credit if and when you need it.”

So, what is included in my credit report?

At a minimum, your credit report will include identifying information about you, such as your name, birth date, address and employment history.

More importantly, it includes:

  • A list of any applications you’ve made for credit over the last five years – regardless of whether your application was approved or not. This information is listed as an “enquiry” by the credit provider you applied to and it includes the type of credit you applied for.
  • A breakdown of your current credit accounts such as your home loan or credit card.
  • Up to 24 months of repayment history – which shows your monthly repayment behaviour on financial credit accounts (phone or utility companies do not report repayment history, so your telco and utility repayments won’t be on your credit report).
  • Any defaults listed by a credit provider on financial loans as well as telco and utility accounts. A default can occur if you miss your payment of at least $150 by at least 60 days. A default stays on your credit report for 5 years.

The Mandurah Establishment Attacks Adams and North

WA state and federal politicians react to our earlier show. We react in turn.

Our earlier post:

https://www.theaustralian.com.au/nation/politics/buyers-told-to-chance-the-market-by-minister-sukkar/news-story/d1726505fbb127c5cc959382bd76b495

http://epaper.communitynews.com.au/mandurah-coastal-times/20190717

https://cecaust.com.au/

The Perth Disaster Is Heading East

Economist John Adams and analyst Martin North discuss the state of WA with State MP Charles Smith MLC

He was elected at the 2017 Western Australian election to represent the East Metropolitan Region in the Western Australian Legislative Council from 22 May 2017 for the Pauline Hanson’s One Nation party. He was elected for four years, with Legislative Council terms beginning on 22 May 2017. In June 2019, Smith resigned from One Nation to sit as an independent.

We discuss the underlying issues facing the state, after our recent post on Mandurah, and underlying causes of the social issues apparent in many suburbs.

Household Finance Confidence Tanks Some More

After the slight twitch of positive sentiment following the election in May, the DFA Household Finance Confidence Index fell again, to a new low of 85.54.

Whilst the RBA rate cut may offer some borrowers the prospect of improved cash flow (when the changes propagate through to the regular repayment), just as many households bemoan the continued cuts in savings rates. So, net, net there is no improvement in financial outcomes, and in fact more are concerned that lower RBA rates signals more trouble ahead.

Across the states, WA showed a significant slide in confidence thanks in part to rising mortgage default and delinquencies, and very high underemployment. Most other states are bunched together, whereas a year or two back, VIC and NSW were streets ahead.

By age, younger households with mortgage debt registered a small improvement, while older households with savings went the other way on lower bank term deposit rates. Many of these will simply hunker down, and spend less, and will not largely benefit from the upcoming tax cuts. Older households resist the temptation to move to higher risk alternative savings vehicles, they too just spend less.

The property segmentation reveals that property inactive and investor households both reported lower levels of confidence, while owner occupied home owners were slightly more positive on the rate cuts news.

All three of our wealth segments remain below neutral on the index, indicating a significant deterioration over the past couple of years. Even those with property and no mortgage remain below the neutral 100 setting.

Within the moving parts of the index, job insecurity increased, with 37.4% reported as less secure than a year back, up 0.64% on the previous month. Around half of households saw no change, though underemployment continues to push higher.

Savings continue to take a battering with more households dipping into them to secure their budgets, and lower returns on bank deposits – especially term deposits. On the other hand, share portfolio holders are fairing a little better – though with higher risks of course. Over 52% are less comfortable than a year ago.

In terms of the debt burden nearly half are less comfortable, despite the rate cuts, while 48% are about the same as a year ago – down 1.46% on last month.

In terms of costs of living, the pain continues, with 91% saying their costs, in real terms are higher than a year ago. Only 1.33% said their costs of living had fallen. Households specifically mentioned higher council rates, fuel costs, electricity, school fees and child care costs.

Income remains under pressure, with 4% saying their incomes had increased in real terms in the past year, compared with 50% saying their real incomes had fallen. 41% said their incomes were about the same.

And overall net worth (assets less loans) rose for 23% of households – thanks to higher share prices mainly, while 47% reported a fall in net worth – thanks to property price falls, and reduced savings. 27% reported no change. As yet any recovery in home prices has not fed through into more positive results.

So, more evidence of the pressure on households, and so far the measures taken by the RBA and the Government have had no net positive impact on household confidence. As noted above, even those with property and no mortgage remain below the neutral 100 setting.

As a reminder this data comes from our rolling 52,000 household surveys, with 1,000 new added each week. This is data up to Monday 8th July.

ASIC consults on proposal to intervene to stop consumer harm in short term credit

ASIC has released a consultation paper (CP 316) on the first proposed use of its new product intervention power. On this inaugural occasion, ASIC is looking to address significant consumer detriment in the short term credit industry.

Under their recommended Option 1: ASIC would use their product intervention power to:(a)make an industry-wide product intervention order by legislative instrument under s1023D(3) of the Corporations Act to prohibit credit providers and their associates from providing short term credit and collateral services except in accordance with a condition which limits the total fees that can be charged; and(b)if a new model, which seeks to circumvent the industry-wide product intervention order, evolves in response to the prohibition, amend the existing order or introduce a new order to address that model. 71

In ASIC’s view, Option 1 is preferable because:(a) the product intervention order will prevent the use of the short term lending model which is causing significant consumer detriment; (b) it will prevent other credit and collateral services providers from adopting this model; (c) it promotes protection for consumers who require small amount credit contracts but who are provided with short term credit (and services agreements) in reliance on the short term credit exemption; and (d) it is a more comprehensive and timely response than the other options.

The product intervention power allows ASIC to intervene where financial and credit products have resulted in or are likely to result in, significant consumer detriment. The new product intervention power is an important addition to ASIC’s regulatory toolkit. It reinforces ASIC’s ability to directly confront, and respond to, harms in the financial sector.

ASIC considers that significant consumer detriment may arise in relation to a particular model designed to provide short term credit at high cost to vulnerable consumers. These consumers include those on low incomes or in financial difficulty.

In its first proposed deployment of this power, ASIC is targeting a model involving a short term credit provider and its associate who charge fees under separate contracts. When combined, these fees can add up to around 990% of the loan amount.   

While ASIC is presently aware of two firms currently using this model – Cigno Pty Ltd and Gold-Silver Standard Finance Pty Ltd – the proposed product intervention order would apply to any firm using this type of business model.

Announcing the consultation ASIC Commissioner Sean Hughes said, ‘Sadly we have already seen too many examples of significant harm affecting particularly vulnerable members of our community through the use of this short term lending model. Consumers and their representatives have brought many instances of the impacts of this type of lending model to us. Given we only recently received this additional power, then it is both timely and vital that we consult on our use of this tool to protect consumers from significant harms which arise from this type of product.’

‘Before we exercise our powers, we must consult with affected and interested parties. This is an opportunity for us to receive comments and further information, including details of any other firms providing similar products, before we make a decision’.

ASIC seeks the public’s input on the proposed intervention order by 30 July 2019. Submissions should be sent to: product.regulation@asic.gov.au.

ASIC anticipates making a decision on whether to make a product intervention order in relation to short term credit during the course of August 2019.

All intervention orders subsequently made must be published on ASIC’s website, and a public notice issued in relation to the intervention.

Download

CP 316 and draft instrument 

Background

On 4 April 2019 ASIC published a media release welcoming the approval of new laws to protect financial service consumers (refer: 19-079MR).

ASIC also published a media release on 26 June 2019 confirming that it initiated consultation on the administration of its new product intervention power (refer: 19-157MR).

ASIC was unsuccessful in civil proceedings in the Federal Court in 2014 involving an earlier use of this short term lending model by two entities Teleloans Pty Ltd and Finance & Loans Direct Pty Ltd (refer: 15-165MR).

ASIC’s MoneySmart website has information about payday loans and alternatives and where to find free help with managing debt.

Aussies’ awareness of changes impacting credit health still a work in progress

Research from credit information website, CreditSmart.org.au, has revealed that one year on from the adoption of Comprehensive Credit Reporting (CCR), most Australian consumers are still unaware of the changes that are impacting their credit health, and may not know how it can impact their future credit applications.

The research found that in the last 12 months, only one in four consumers checked their credit report. More worryingly, consumers who are struggling with their credit health said they were just as likely to seek advice from credit repair or debt management services as they would from their lender or free financial counsellor.

“Consumers are still largely unaware of credit reporting, what information is contained in their credit report, and what that means about their borrowing behaviour and overall credit health,” said Mike Laing, CEO of the Australian Retail Credit Association (ARCA), which founded CreditSmart.

“Our research has found that while awareness has actually increased 11% from last year, less than 1 in 3 consumers are aware that credit reporting has changed. Importantly however, awareness is higher among those with a real need to know – with one in two consumers who are planning to make a significant purchase in the next 12 months being aware of the changes,” added Mr Laing.

The rollout of comprehensive credit reporting has accelerated rapidly in Australia since last year, with more data shared than ever before. By September this year, comprehensive credit information for 80% of consumer loan accounts will be available.

“CCR allows lenders to share and view more detailed credit information about consumers to provide a clearer view of a consumers’ credit history. This is a positive move for consumers who have a strong history of making payments on time.” added Mr Laing.

Consumer awareness highest for users of riskier credit products

According to CreditSmart, credit cards make up the majority of accounts currently in the CCR system at around 87%, followed by mortgages at 9%.

Yet, people who hold these mainstream types of accounts are the least aware of the changes to credit reporting and may not be aware of the value it adds to their credit history, if they have a strong record of making payments on time.

It was also found that those consumers with products that are sometimes seen as riskier, such as leases for household goods (61%), cash loans (54%) and payday loans (79%), plus personal loans (55%), are all far more aware of the changes to credit reporting[1] This could indicate the users of those products have been given more information about the changes, or that they have taken more time to understand the changes.

Consumers using these riskier products also rated their credit health as significantly worse than users of home loans and credit cards.

Interestingly, Buy Now Pay Later (BNPL) users have relatively low awareness of credit reporting changes despite significant numbers rating their credit health as poor.[2]

Consumer awareness a work in progress

Awareness of credit reporting changes is not the same as understanding the detail behind their credit report, according to Mr Laing.

“It is easy to understand how consumers may become confused about what’s important when it comes to credit reporting and their credit health. There’s a lot of information out there and it’s important to bring it back to a simple, straightforward message.

“We want consumers to be aware of the importance of their credit history to their credit health – and how that history may impact their financial future. The steps are to understand how the credit reporting system has changed, to get your credit report to see your credit history and to manage the credit that you have responsibly” added Mr Laing. For more information on the changes to credit reporting and where to get your free credit reports you should go to www.creditsmart.org.au, which provides clear information on the credit reporting system to assist consumers to optimise their credit health.    

Revised Banking Code Of Conduct A Small Win, But…

The ABA made a big splash when relaunching the revised Banking Code of Conduct which starts today, and yes it is a small win for consumers and SME’s. However, we must ask this: since when are such financial service basic hygiene issues as not charging for no service, advising before charging, considering credit card repayment capacity, speaking in plain English and offering suitable low-fee products, seen as so revolutionary?

Frankly put, these are issues which an industry which truly focused on the well-being of its customers would have long ago addressed. They did not, and were dragged towards better outcomes by the Royal Commission and public pressure.

So, yes, important baby steps, but still a massive leap is required to the desired level of customer-centricity. There is nothing bold or innovative here.

Australia’s banks will comply with a strong new code of practice that significantly increases and enshrines customer protections and introduces tough new penalties for breaches from tomorrow.

The ASIC-approved Banking Code of Practice represents the most significant increase to customer protections under a code in the industry’s history.

From 1 July, under the new Banking Code of Practice, banks will no longer:

– Offer unsolicited credit card limit increases
– Charge commissions on Lenders Mortgage Insurance
– Sell insurance with credit cards and personal loans at the point of sale.

Under the code banks must:

– Offer low-fee or no-fee accounts to low income customers
– Have a 3 day grace period on all guarantees to give guarantors enough time to make sure it’s the right option for them
– Actively promote low-fee or no-fee accounts to low income customers
– Provide reminders when introductory offers on credit cards end
– Simpler and fairer loan contracts for small business using plain English that avoids legal jargon
– Provide customers a list of direct debits and recurring payments to make it easier to switch banks.

Australian Banking Association Chief Executive Officer Anna Bligh said customers can expect to see a change to banking products and services immediately.

“We’ve completely rewritten the rule book for Australia’s banks. The Banking Code of Practice has strong protections for customers, serious consequences for breaches and strong independent enforcement,” Ms Bligh said.

“Banks understand they need to change their behaviour and this new rule book represents an important step in earning back the trust of the Australian public.

“The new Code will form part of every customer’s relationship with their bank and will be strongly enforced both by an independent body, the Banking Code Compliance Committee, and the Australian Financial Complaints Authority.

“Whether it’s through your credit card, home loan, small business loan or just day to day banking, Australian customers will see tangible benefits from this new Code,” she said

Financial Counselling Australia Chief Executive Officer Fiona Guthrie said the new Code was a major step up in the protections for customers, particularly the most vulnerable, and was an important milestone in restoring community trust in Australia’s banks.

“Codes like this really can make a difference because they go beyond black letter law and instead reflect the standards that an industry voluntarily commits to,” Ms Guthrie said.

“The banking industry released its first version of the banking code over 25 years ago and it is really pleasing to see that each version – and this is the fourth major revision – contains advances in consumer protection.

“Financial counsellors in particular welcome provisions around family violence, stronger protections for guarantors, better promotion of free or low fee accounts and more proactive approaches to people experiencing financial hardship,” she said.

Banks have trained more than 130,000 staff on the new requirements in the code so it can begin operating from tomorrow (1st July 2019). Information about the Code has been translated into Mandarin (simplified Chinese), Arabic, Vietnamese, Tagalog/Filipino, Hindi, Spanish and Punjabi.

The Financial Services Royal Commission asked for further changes to the Code which will be implemented by March 2020.

For more information on the new Banking Code of Practice visit ausbanking.org.au/code.