Ironic really, that on the day ASIC released its updated lending guidance, BOQ have lowered their interest rate floors for home loan serviceability assessments.
BOQ has reduced its floor rate for mortgage serviceability assessments from 5.65 per cent to 5.35 per cent, with the changes also applicable to its subsidiary Virgin Money. Via The Adviser.
The changes will apply for all new home loan applications submitted from Monday, 9 December.
The interest rate buffer will remain unchanged at 2.50 per cent.
BOQ noted that serviceability rates will
vary depending on the credit product under assessment, with the interest
rate applicable determined as follows:
For variable principal and interest home loans, the actual rate will be applied as the interest rate for serviceability.
For interest-only and fixed rate home loans, the revert rate will be applied as the interest rate for serviceability.
BOQ added that applications submitted
prior to Monday, 9 December, that have not been approved will be
assessed using the new serviceability rates.
In early July, the prudential regulator
scrapped its requirement for a 7 per cent interest rate floor and raised
its recommended buffer rate from a minimum of 2 per cent to 2.5 per
cent.
APRA chair Wayne Byres said the
regulator’s amendments were “appropriately calibrated”, stating that a
serviceability floor of more than 7 per cent was “higher than necessary
for ADIs to maintain sound lending standards”.
Analysts have partly attributed the rebound in home lending activity over the past few months to APRA’s changes.
According to the latest data released
by the Australian Bureau of Statistics, the value of new home lending
commitments rose 1.1 per cent (in seasonally adjusted terms) in
September, following on from a 3.8 per cent rise in August.
New lending commitments are now up 5.6 per
cent (seasonally adjusted) when compared with September 2018, the first
positive year-on-year result seen since mid-2018.
Something is late, very late this month. After the stock loans data from the RBA and APRA, both of which arrived for October on the last day of November, we would have expected to see the credit flow data from the ABS, about a week or so later.
Yet, digging into the upcoming releases, it looks like something will land on the 17th December. In addition, we are expecting significant revisions and changes as they continue to tweak the new reports.
They said:
From December 2019, this publication will be based on a new, improved data collection, called the Economic and Financial Statistics (EFS) collection. To better reflect the new content, the publication will be renamed Lending Indicators, Australia (cat. no. 5601.0). The first issue of the new publication will contain October 2019 data and will be released on 17 December 2019.
We know the October loan stock growth slowed to the lowest in many years, so the current theory doing the rounds is that households are repaying existing loans, and significant volumes of new loans are being written. Industry sources suggest to me that the refinance sector is buoyant thanks to the lower rates, but that is a net sum game. It is the new loans which we need to watch (after all if home prices are really taking off, per some of the indices, we would expect to see this trend), something which was pretty anemic last month.
And they also warn:
The changes to the concepts and classifications are significant. There is a high likelihood of revisions in future reporting periods as APRA, the ABS and the RBA continue to work with ADIs and other reporting institutions to ensure consistent reporting that aligns with instructions and definitions, and the impacts on seasonality can be measured. It is expected data quality will continue to improve over time.
We look at insights from the latest BIS Quarterly Report, and examine the U.S. Repo issue. They reveal it was structural – an insight which is significant.
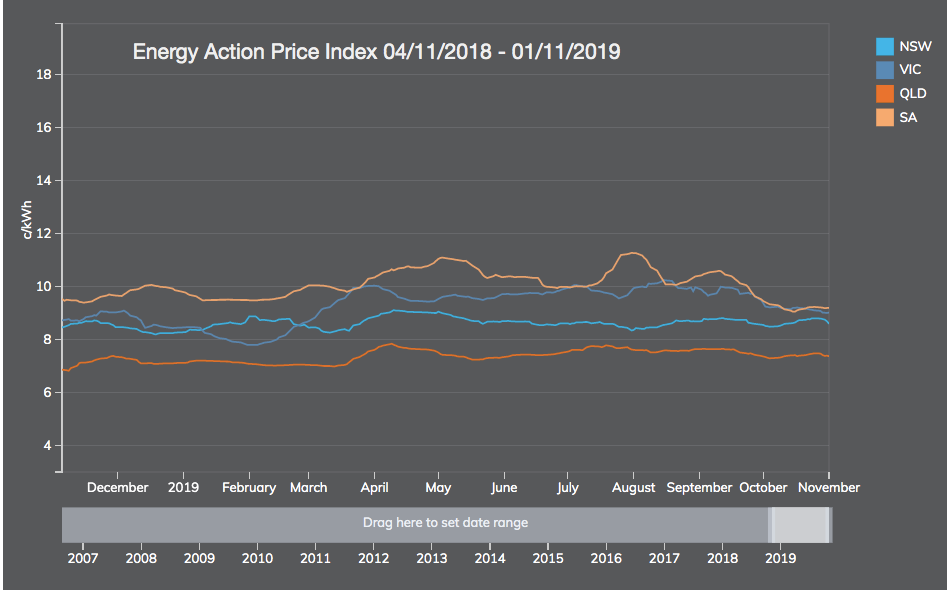
Following our recent update on household mortgage stress, it’s important to broaden our scope into other areas of household financial stress. Just as mortgage defaults rise, power disconnections rise too.
In this report Mitch Grande examines the evidence. Mitchell is a recent Graduate of Politics, Philosophy, Economics (Honours) at the University of Wollongong and is concerned with Australian public policy, and especially energy policy.
Disconnections:
The ABC recently published an article on Western Australia’s record number of
households having their power shut off. For measure, WA’s mortgage stress has
reached 34.3% (145,000), as local economic conditions continue to deteriorate. We
suspect mortgage stress is well correlated with households being disconnected
from their power supply and compounding cost of living pressures through power
bills.
The
article spoke of one 1 in 60 WA households being cut off following unpaid
bills. WA’s state-corporations and largest retailers, Synergy and Horizon
Power, stated that over 22,000 customers had their power shut off in the past
year. This is a two-fold increase in state disconnections in the last three
years. The article cites year-on-year increases to the average WA electricity
bill of +11% (2017), +7% (2018), and +1.75% (2019); while salaries at best
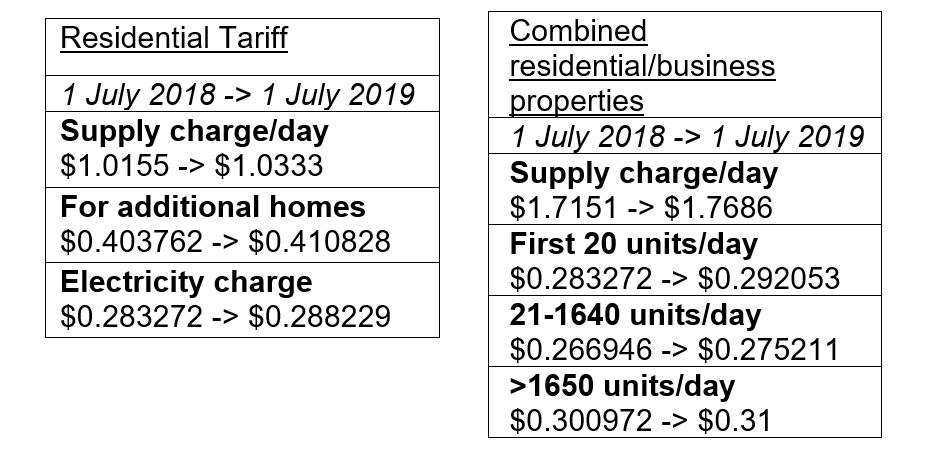
increased +1%. It is important to note that WA is not included in National
Energy Market operations and trading, and as such, the government regulates
Synergy and Horizon Power’s prices of residential and larger customers, setting
the fees and charges annually in the budget. Most recent changes are as follows:
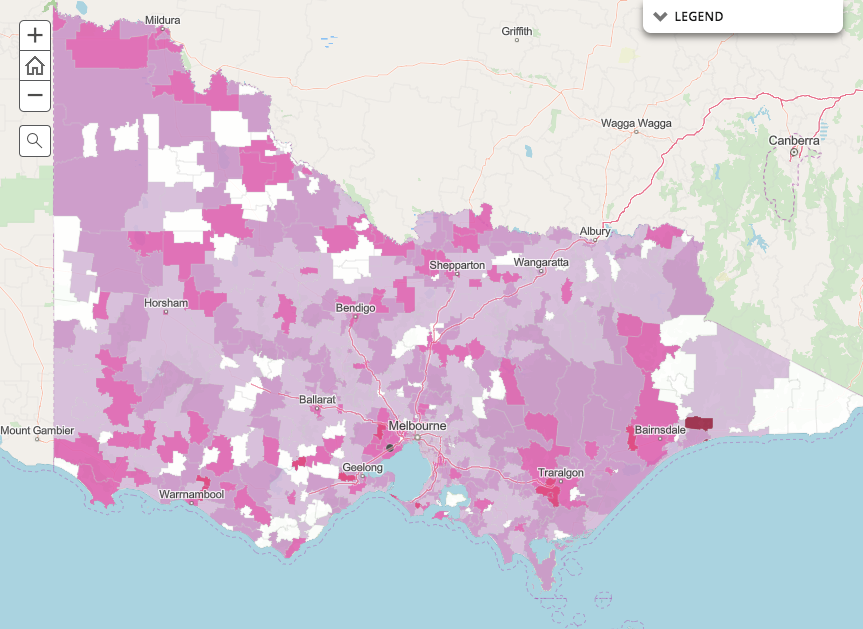
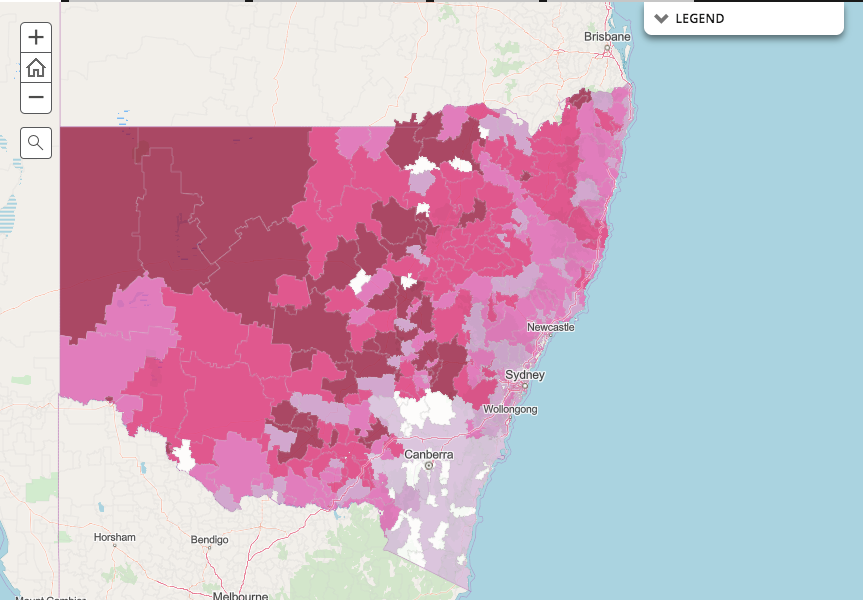
Other research on household energy stress by Alviss consulting with St Vincent de Paul, which does not include Western Australia, examined disconnection data for Victoria, New South Wales, Queensland, and South Australia. In short, their research found many regional and rural hubs at risk, as these postcodes, especially in the last three years, have experienced the most disconnections. The reason behind the regional cost profile is burgeoning network costs, with polls and wires being old, inconsistent, and ‘gold-plated’ over much longer distances than metro customers.
The
Alviss report categorises two types of disconnections: raised disconnections
and completed disconnections. However, the ABC report on WA only speaks to
“power being shut off”, so it is hard to compare the data uniformly. Nevertheless
both reveal the same story of financial hardship in small rural postcodes, perhaps
struggling with the agrarian shift and general economic stressors of poor
revenue poor wages, high costs, and burdens. Both the ABC article and Alviss
report speak to these at-risk households entering stress spirals, in which
regional folk are ‘too proud to seek help’ in either welfare or drug and alcohol
abuse.
The
average postcode profile consisted of lower local incomes, higher unemployment
rates, and relatively more housing affordability issues. A such, the average at
risk household was demographically older, had less economic opportunities, and
lower incomes.
State-by-state
the Alviss report found that:
Victoria had 43.8% of reported customers face
raised and/or completed disconnections.
Werribee (3030) topped the table with 10,424
raised and 5,097 completed.
NSW had 36.7% of its customers face raised
and/or completed disconnections.
Orange
(2800) had the most with 17,902 raised and 6,435 completed.
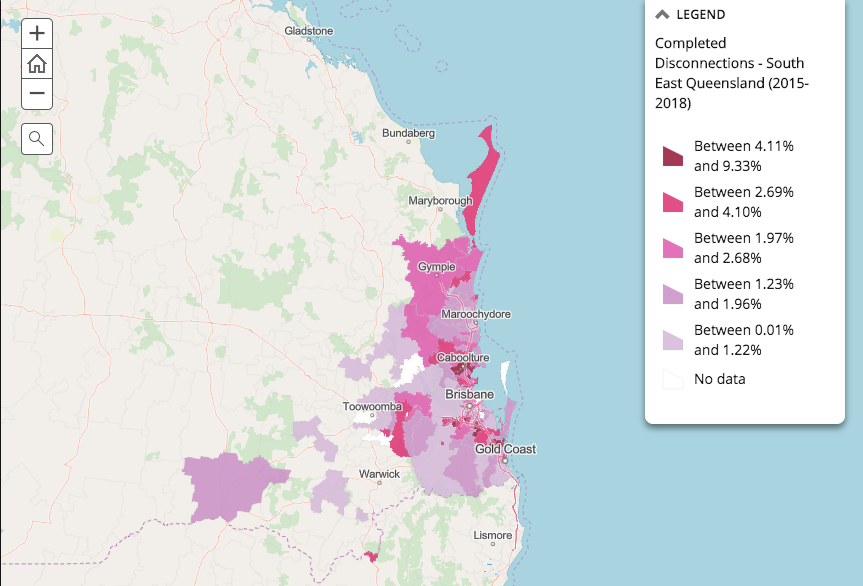
South East QLD had 30.3% of its customers face
raised and/or completed disconnections.
Caboolture (4510) had 7,587 raised and 2,541
completed.
But Logan (4114) had the highest completed with
2,552 of 7,152 raised.
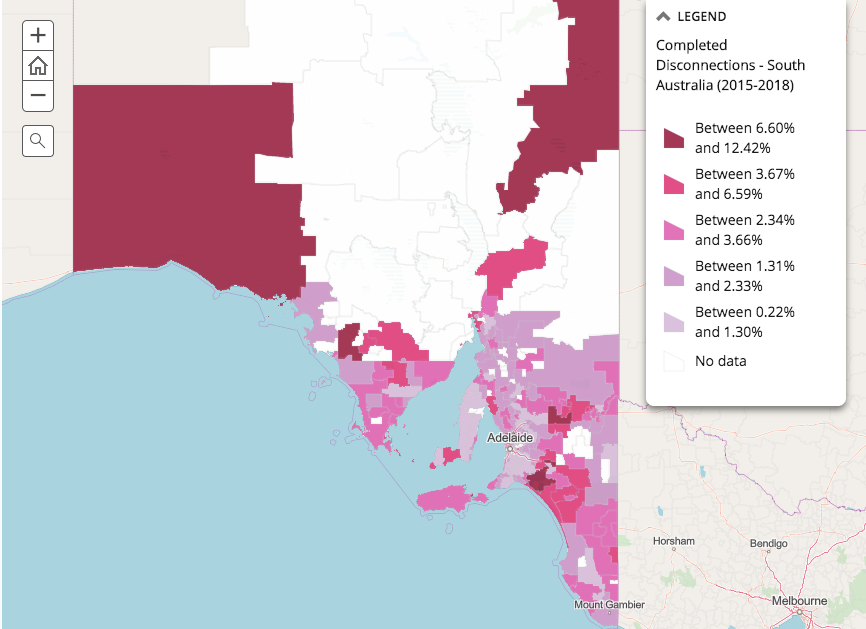
SA had 30.2% of its customers face raised
and/or completed disconnections.
Salisbury (5108) had 3,956 raised and 952
completed.
But Elizabeth North (5113) had highest
completed with 1,524 of 3,953 raised.
This points to larger lingering issues in SA in
which more than 10 of the top 30 disconnected postcodes are middle suburbs
(5085, 5112, 5113, and 5114).
The
higher completion of disconnection rates reflects far greater then understood
financial hardship, retailers more readily disconnecting households, and
networks being more readily and efficiently able to disconnect consumers. Here
at DFA we have the data available to investigate this financial hardship,
through the survey data on mortgage stress.
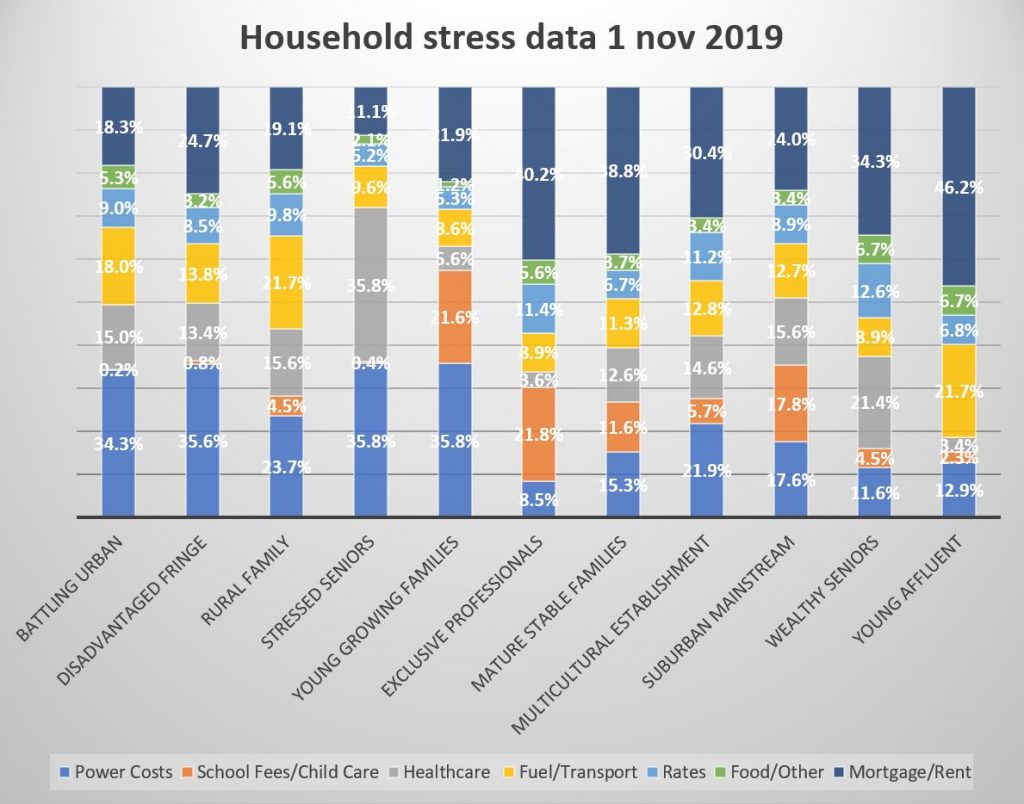
DFA survey data breakdown:
From our
most recent DFA survey data, those most affected by power costs include:
the Battling Urban (34.3% surveyed);
the Disadvantaged Fringe (35.6%);
Rural Families (23.7%);
Stressed Seniors tied between power costs
(35.8%) and healthcare costs (35.8%); and
Young Growing Families (35.8%).
This
comes, largely, as we might expect, with young families in growing urban areas,
seniors and those in regional areas struggling with cash flow, and pockets of
disadvantaged and battling segments overburdened by power costs. The
distribution of these segments is largely consistent with the Alviss data,
particularly in Rural New South Wales and the Battling Urban of South
Australia.
All of
these segments (except rural families) whose power costs were the largest
stressor had mortgage/rent stress as their next most outstanding strain with:
Battling Urban (18.3%);
Disadvantaged Fringe (24.7%);
Stressed Seniors (sans healthcare cost (35.8%))
with (11.8%); and
Young Growing Families (21.9%); while
21.7% of Rural Families had fuel and transport
costs as their next highest stressor, whereas mortgage/rent costs affected
19.1%.
In the
other segments, which surveyed a higher cost than power costs, the distinction
is clear:
40.2% of Exclusive Professionals had higher
mortgage/rent cost stress than power costs (8.5%) with the next highest portion
reporting school fees/childcare (21.8%);
Mature Stable Families surveyed higher stress
from mortgage/rent costs (38.8%) than power costs (15.3%) which was their next
highest;
Multicultural Establishments had higher
mortgage/rent stress (30.4%) which was higher than power costs (21.9%), the
next highest result;
the Suburban Mainstream surveyed 24.4%
mortgage/rent costs compared to power costs (17.6%), where their next highest stressor
is school fees/childcare (17.8%);
Wealthy Seniors with (34.3%) mortgage/rent
costs, followed by healthcare (21.4%); and finally
Young Affluent in mortgage/rent costs (46.2%)
followed by their next highest, power costs (12.9%).
These
segments, too, largely come as no surprise with Mature Stable Families not
facing disadvantage, unlike the inner-city postcodes of South-East Queensland.
Or, Wealthy Seniors facing some degree of housing affordability in Rural or
Regional Victoria.
AEMC, AER, and Canstar:
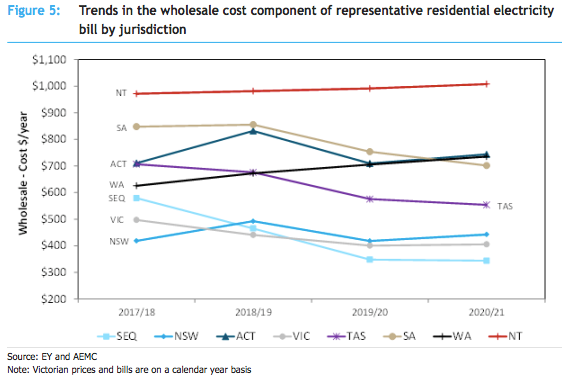
A 2018 Australian Energy Market Commission (AEMC)
report modelled that in the next
two years emerging wind and solar capacity will drive down residential
wholesale prices by $55, offsetting marginal increases in the supply chain like
coal plant retirements, burgeoning network costs, and minor environmental
costs. The 2019 national weighted average consumption level for
residential consumers was estimated at 4,596 kWh per year. And at this
consumption level, the national average annual residential bill in 2017-18 was
$1,384 exclusive of good and services tax (GST) and $1,522 inclusive of GST.
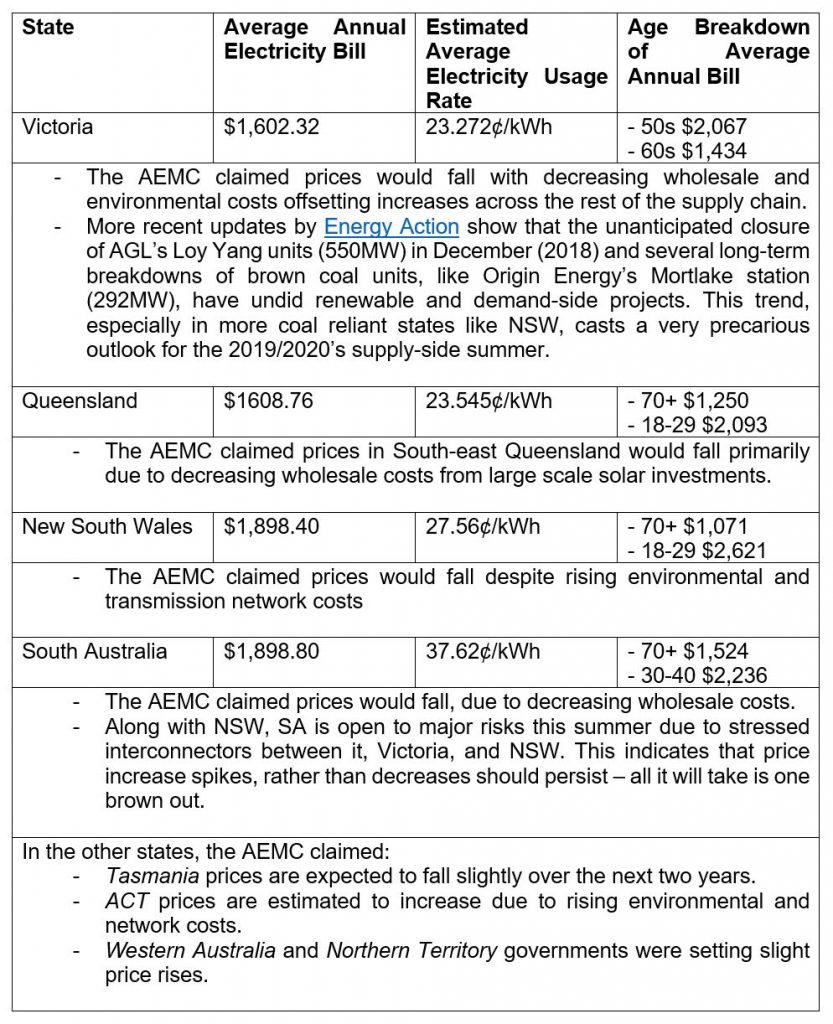
However,
the lived reality for many households, on average, far exceeds these averages. One
way we can be certain of this is the Australian Energy Regulator’s own data on
disconnections: for NSW, SA, QLD, the ACT, and Tasmania 70,000 residential
customers had their supply disconnected between 2017 and 2018. These
disconnections are seasonally dependent, however more uniformly than we might
expect: there are slightly more disconnections raised in autumn (27.8%) and
summer (26.6%) than in spring (23.0%) and winter (22.6%). And then from the
more recent Alvis report and ABC WA article, we find that renewables easing the
wholesale price is not being felt – especially by regional and rural
households. To be clear, the private development of renewables is making enormous
strides in the alleviation of power costs, however, the rather incongruent
policy leadership in a number of other spaces is directly counteracting this.
By
taking a quick glance at Canstar, average annual bills are anywhere from $80 to
$370 greater than the AEMC’S estimates for the same average consumption – and
have increased.
Despite
the AEMC claiming observable declines in average household prices, postcodes
and households across the National Energy Market experience higher real bills
due to sluggish wages and are themselves burdened by inconsistent policy
frameworks that fail to implement meaningful market-based solutions or improve
the cost of living. The fact of the matter is that household disconnections in
all states is increasing.
Recently, the AEMC published their annual report for 2018-2019, which showed that consumers who are willing and able, have engaged in consumer-side uptake of solar PV and batteries. This is causing a positive decentralisation of energy grids (e.g. microgrids, peer-to-peer, virtual powerplants) and alleviation of power prices. In short:
“The technology revolution offers opportunities
and benefits for customers to take control of how they buy, sell and use
energy. Over time, this should allow for greater utilisation of the existing
stock of generation and network capacity, lowering average costs for all
consumers.”
However,
this is not without its challenges. The AEMC signal to a more complicated shape
of daily consumer demand and daily generator supply due to the decentralised
frequency and voltage; the necessity of a new power system management in
replacing old and inadequate capacity; getting proper connectivity to new
remote wind and solar projects; and the ever-elusive unpredictability of
weather patterns on day-to-day demand. As well, those households who are unable
to purchase household solar and/or batteries are beginning to be left behind,
worsening bad market conditions.
In all,
these challenges can be adequately met with coordinated and purposeful
investment in solar/battery integration and security. For instance, improving
grid access to those least-cost sources; fixing security challenges present in
the system, like network infrastructure; or maintaining incentives vis-à-vis
the needs of the system, like decentralised control of household’s bills with
smart technologies all will alleviate prices.
The Federal Governments’ Policy Angle
Going
into the election, the Coalition alluded to three policy options in order to
lower power prices: removing standing offers (dubbed a loyalty tax);
underwriting new reliable investment (painstakingly trying not to call it
subsidies); and ‘big stick’ divestment policies aimed at big gen/retailers who
either ‘price game’ or stray from Angus Taylor’s ‘reliable’ mantra. Rather
critically:
“The Coalition’s
fixation on energy prices is no doubt politically effective, as it both appeals
to people’s hip pockets and works as a scare campaign against taking action on
climate change. But it also obscures another significant, and not unrelated,
economic reality.”
Coming
from an ACCC report that “the standing offer is no longer working as it was
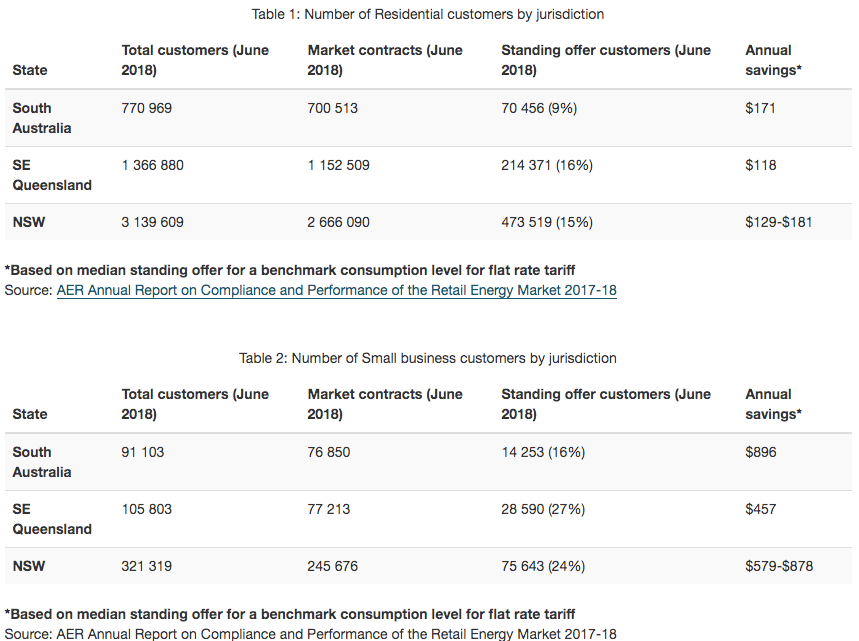
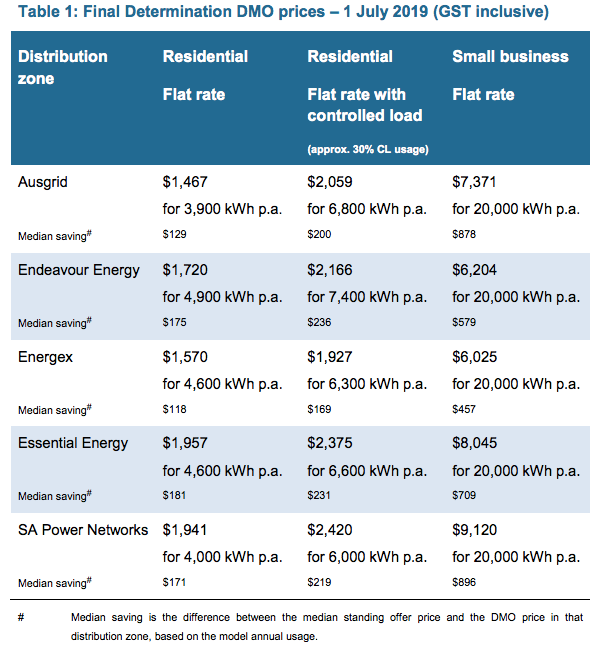
intended and [that it] is causing financial harm to consumers…” the government claimed that: “On 1 July 2019, 800,000 Australian families
and small businesses will benefit from lower electricity prices by moving to
default market offer electricity contracts saving households up to $481 in
South Australia and up to $663 in NSW and South East Queensland. Households changing to default market offers
from standing offer tariffs will save up to $481 in South Australia and $663 in
NSW and South-East Queensland…”
Not only
is this marginal in the grand scheme of energy consumers, it has required an
equalisation across the entire NEM. That is, people on “confusing discounts”
will have those reduced in order to maintain retail profits, stating: “customers
on standing offers and market offers that were above the default offer would be
better off, customers on lower priced market offers would be worse off”. The
AEMC and ACCC’s own data showed that the percentage of consumers on standing
offers was declining rapidly and organically.
“All
jurisdictions are likely to have less than 10 per cent of residential customers
on standing offers within the next two years. The Commission also notes that
there exists a segment of the market (approximately two to four per cent of all
residential customers) who are on standing offers for only a short period when
they move house or create a new connection and have not yet selected a market
offer.”
The
Government signalled to “savings built on price cuts of up to 15 per cent
secured by the Morrison Government for more than 500,000 families and small
businesses from 1 January 2019 – and our ban on sneaky late payment fees that
will save some customers up to $1,000 a year…” in that “small Businesses
changing to default market offers from standing offers will save up to $457 in
South-East Queensland, $878 in NSW and $896 in South Australia.” Despite this,
disconnections and household power costs stress have uniformly risen.
The
government and the ACCC urged consumers to still shop around for market offers
that are almost always cheaper than these default market offers.
“In particular, higher proportions of rural and small
business customers remain on standing offers. In contrast, the percentage of
hardship customers on standing offers is approximately half that of all other
residential customers.”
This is
coupled with underwriting new “reliable” generation, expected to reduce NEM
wholesale prices by a quarter by 2021 – however, whether the government is
subsidising the right wholesale generation capacities is another question
entirely (they’re not). As well, the government has introduced the Energy
Assistance payments to welfare recipients which emphasises a price safety net:
“banning retailers from offering confusing discounts, protecting customers in
financial hardship and requiring energy retailers to notify customers when
their discounts are about to finish or change.”
The
government appears more concerned with tinkering with peoples’ demand (a la the
first home buyers’ scheme). In doing so they are inflating average demand
profiles, not managing the market-wide issues in supply.
Being
seven months after the election, and five months since the default market
offers were introduced, the AEMC optimistically signalled to wholesale price
easing countered by burgeoning costs in the network and retail profiting – whereas,
on average, the consumers’ bill has increased in the eyes of financial
comparison cites and segments of the population surveyed by DFA report higher power
cost stress.
The
optimism is not lost in the media: with David Crowe, just in September, writing a piece stating that bills are falling
$130 a year thanks to the Morrison governments’ “industry crackdown.” Crowe
writes: “The price rules came into effect on July 1 and have already cut the
standard offers for electricity customers, with some NSW households saving $130
a year. Some Victorian customers have seen their offers fall by medians of $310
to $430 depending on the retailer.” But immediately, Crowe states that not all
customers are going to have reduced bills, just those that were on existing standing
offers – meaning that those on existing discounted retail rates have since had
their bills increased to equalise the burden. Whether this is observable in the
mass of disconnection figures or household stress is uncertain.
In the face of this optimism is the reality that power costs continue to burden
a majority of segments in Australia and average bills continue to rise, as ad
hoc policies have all but decreased the average bill. This is mainly because of
the new policy directions under Taylor and Morrison, which deal more in threats
and subsidies than they do in proper market-based or evidence-based
policymaking. The governments new direction fails to address the largest
inflators of household power costs, which are the overinvested gold-plated
regulated asset base, burgeoning wholesale costs from aging coal-fired power,
and extraordinary retail costs/profits – the latter of which the ACCC and AEMC reject, simply because ‘the market is competitive’. In
that same report, the ACCC and AEMC flag the long-term risks due to legislating
default market offers, including:
increased risk to retailers driving higher
financing and overall costs
lower levels of innovation leading to less
available products and services
higher barriers to entry and changes to
consumer behaviour resulting in decreased competition.
AEMC
were happy with retail competition (2019), for the market’s improved
simplicity, stable price deals, and removing confusing offers creating “a more
engaged market that is responding positively to greater product innovation and
bundling – and producing positive outcomes.”
5. Final Remarks
As a
portion of average household expenditure, electricity costs have risen to 50%
from 2006 to 2016. The ABS found 10% of those surveyed reported difficulty in
paying bills in 2015-2016. In 2013, ABS also found 10% “chose” to restrict
heating and cooling. These figures alone reaffirm the DFA thesis that Australia
is experiencing poor wage growth, underemployment, low productivity, record
levels of private debt. And when this is applied to poor innovation in the
energy sector, a maintenance of minerals-based growth, and a reluctance to
properly do what is needed
Across
all household types, less are able to pay electricity/gas. There is a negative
association between net wealth and indicators of energy-related financial
stress 1st quintile ‘chose’ to restrict heating / cooling. Renters
and mortgage holders are at observably greater risk of energy-related financial
stress, ‘choosing’ to forgo consumption. Solar panels substantially reduce their
difficulties, however, it is only available to those who can afford it, while
those who can’t are left to the market.
As the
DFA data shows, the surveyed segments are divided along two key groups: those
with Young Families in growing urban areas, Seniors and those in regional areas
struggling with cash flow, and pockets of disadvantaged and battling segments who
are overburdened by power costs. And on the other hand, those Exclusive
Professionals, Mature Stable Families, Multicultural Establishment, Suburban
Mainstream, Wealthy Seniors and the Young Affluent who are more burdened by
mortgage/rent costs.
In summary,
summer bodes very poorly, with shocks from old coal-fired power very likely spiking
prices unpredictably along outdated yet gold-plated interconnectors. Any price
movements across states, such as a brown out, through the NEM will be
infectious, as interconnectors deteriorate and fail to distribute new renewable
projects of higher efficiency. Existing coal generation is increasingly
unreliable and expensive, as the fleet continues to retire, and governments
fail to make investment into sufficient new generation or systems reliability. The
policy void in wholesale and gas markets will mean that higher prices and
system risk will continue, as the market and industry signals for proper
investment and legislative certainty.
The median weekly earnings of employees rose by 2.3 per cent from August 2018 to August 2019, according to figures released today by the Australian Bureau of Statistics (ABS).
This increase, based on data collected with the Labour Force Survey, is consistent with increases observed in the Wage Price Index and Average Weekly Earnings.
Over the year to August 2019, the median weekly earnings of female
employees rose by 4.3 per cent, while male employee earnings rose 1.3
per cent.
Head of Labour Statistics at the ABS, Bjorn Jarvis, said: “Median weekly
earnings for male employees rose by less than that of female employees,
partly because of the growing number of males working part-time hours,
and the industries and occupations that men and women are working in.”
The figures also show gradual changes in working arrangements over time.
There was an increase in the proportion of employed people with access
to flexible working hours (34 per cent in August 2019, up from 32 per
cent in August 2015) and who regularly worked at home (32 per cent, up
from 30 per cent).
There was a decrease in the proportion of employed people who usually
worked overtime (34 per cent in August 2019, down from 36 per cent in
August 2015), or were on call or standby (22 per cent, down from 24 per
cent).
The Characteristics of Employment Survey is run each August, in
conjunction with the monthly Labour Force Survey. It collects
information on earnings, working arrangements and forms of employment
(including independent contracting), as well as trade union membership
and labour hire every second year.
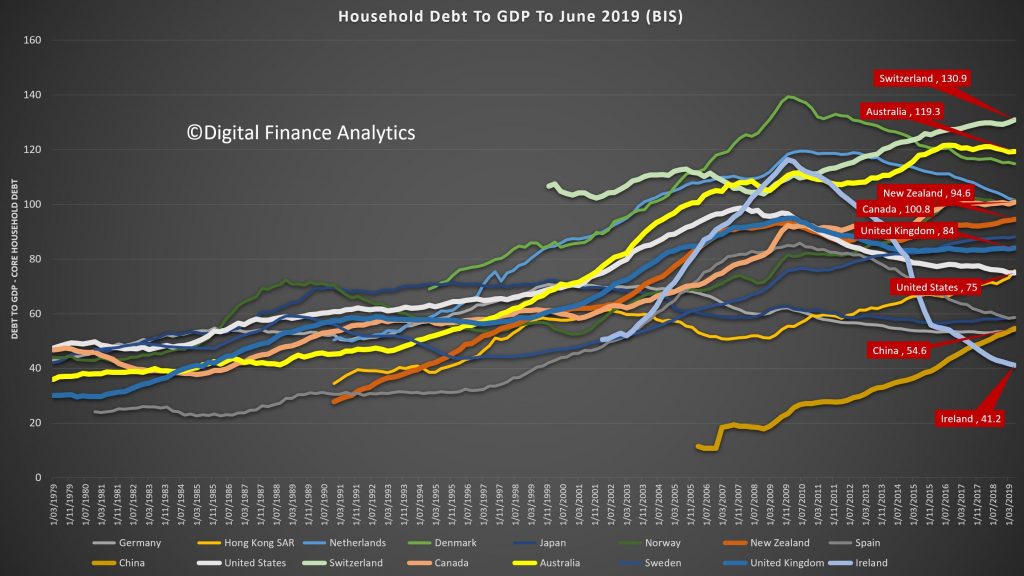
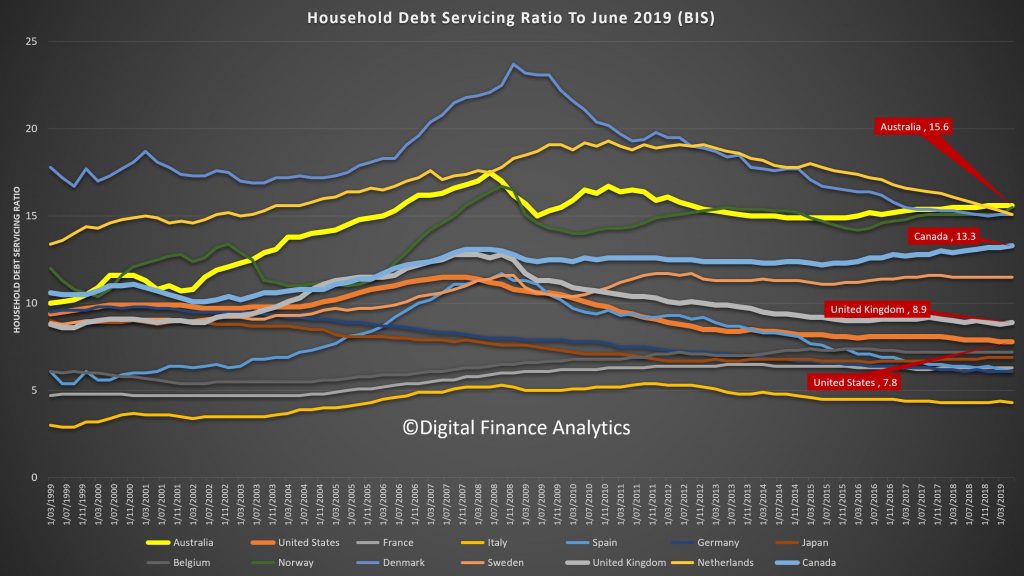
The BIS have released their latest comparative stats for household debt to GDP and household debt servicing ratios. And congratulations Australia, we headed the list with the highest debt servicing ratios in their series, and the second highest debt to GDP. Both alarming.
Looking at the household debt to GDP ratios first, to June 2019, the average across advanced economies is 72.8. This gives a proxy for how easily households will be able to service and repay their loans, the lower the less risk there is.
The United States is a little above the average at 75, the UK, at 84, Near Zealand stands at 94.6, similar to Canada, while Australia comes in at 119.3 and Switzerland leads the pack at 130.9.
On the debt servicing ratios, we have taken first spot, at 15.6, with Canada at 13.3, the UK 8.9 and the US 7.8. The DSR is the average of income required to service a loan. So, the lower the better. Note this is across ALL households whether they borrow or not, so it takes account of the amount being repaid and the proportion borrowing. Note also the the Australian data has risen from 2014, despite rate cuts.
Conclusion, Australians is over leveraged, and mainly into property.
ASIC’s decision to update RG 209 followed a
number of developments since the guidance was last updated in late
2014. These developments have included:
ASIC regulatory and enforcement actions, including court decisions
ASIC thematic reviews on various parts of the industry such as interest-only loans
the Royal Commission into Misconduct in the Banking, Superannuation and Financial Services Industry
recent and upcoming initiatives such as comprehensive credit reporting and open banking, and
changes in technology.
Following an extensive consultation, ASIC
has updated Regulatory Guide 209 (RG 209) to provide greater clarity and
support to lenders and brokers in meeting their obligations.
Importantly, ASIC has maintained principles-based guidance that supports
flexibility for licensees.
The changes include:
A stronger focus on the legislative purpose of the obligations—to reduce the incidence of consumers being encouraged to take on unsuitable levels of credit, and ensure licensees obtain sufficient reliable and up-to-date information about the consumer’s financial situation, requirements and objectives to enable them to assess whether a particular loan is unsuitable for the particular consumer.
More guidance to illustrate where a licensee might undertake more, or less, detailed inquiries and verification steps based on different consumer circumstances and the type of credit that is being sought. The updated guidance includes new examples about a range of different credit products including large and longer-term loans, credit cards and personal loans, small amount loans and consumer leases and different kind of consumer circumstances – such as first home buyers, existing customers, strata corporations, high net worth and financially experienced consumers.
More detailed guidance about how spending reductions may be considered as part of the licensee’s consideration of the consumer’s financial situation, requirements and objectives.
More detailed guidance about the use of benchmarks as a way to check the plausibility of expenses, as well as additional guidance about the HEM benchmark.
Clarity about more complex situations for some consumers – for example the different situations of consumers such as income from small business, casual employees, new employees, the gig economy, as well as joint and split liabilities and expenses.
ASIC has also included a section on the
scope of responsible lending, explaining the areas that are not subject
to responsible lending obligations – such as small business lending
irrespective of the nature of the security used for the loan.
The National Credit Laws provide consumers
with important protections when seeking credit directly from a lender
or through a broker. ASIC’s revised guidance is intended to assist
lenders and brokers to comply with their responsible lending obligations
and ensure that they do not recommend or provide credit that is
unsuitable.
ASIC Commissioner Sean Hughes said “ASIC
conducted extensive consultation on this important issue. The public
hearings and submissions highlighted the areas where industry sought
clarification from ASIC. We have listened carefully to all stakeholders
and addressed areas where we consider updated guidance would help. We
hope that today’s guidance will assist industry to more confidently make
responsible lending decisions and to facilitate good lending outcomes
for consumers.”
The guidance has also been updated to
reflect technological developments including open banking and digital
data capture services. RG 209 notes the cost and ease of access to
transaction information will be improved over time, which should improve
lenders’ overall view of a consumer’s financial situation.
ASIC has also published its response to
submissions made to Consultation Paper 309 and a tool to assist users of
RG 209 to navigate the updated structure of the document.
The
Financial Stability Board (FSB) today published two reports that
consider the financial stability implications from an increasing
offering of financial services by BigTech firms, and the adoption of
cloud computing and data services across a range of functions at
financial institutions.
The entry of BigTech firms into finance
has numerous benefits, including the potential for greater innovation,
diversification and efficiency in the provision of financial services.
They can also contribute to financial inclusion, particularly in
emerging markets and developing economies, and may facilitate access to
financial markets for small and medium-sized enterprises.
However, BigTech firms may also pose risks
to financial stability. Some risks are similar to those from financial
firms more broadly, stemming from leverage, maturity transformation and
liquidity mismatches, as well as operational risks.
The financial services offerings of
BigTech firms could grow quickly given their significant resources and
widespread access to customer data, which could be self-reinforcing via
network effects. An overarching consideration is that a small number of
BigTech firms may in the future come to dominate, rather than diversify,
the provision of certain financial services in some jurisdictions.
A range of issues arise for policymakers,
including with respect to additional financial regulation and/or
oversight. Regulators and supervisors also need to be mindful of the
resilience and the viability of the business models of incumbent firms
given interlinkages with, and competition from, BigTech firms.
Financial institutions have used a range
of third-party services for decades, and many jurisdictions have in
place supervisory policies around such services. Yet recently, the
adoption of cloud computing and data services across a range of
functions at financial institutions raises new financial stability
implications.
Cloud services may present a number of
benefits over existing technology. By creating geographically dispersed
infrastructure and investing heavily in security, cloud service
providers may offer significant improvements in resilience for
individual institutions and allow them to scale more quickly and to
operate more flexibly. Economies of scale may also result in lower costs
to clients.
However, there could be issues for
financial institutions that use third-party service providers due to
operational, governance and oversight considerations, particularly in a
cross-border context and linked to the potential concentration of those
providers. This may result in a reduction in the ability of financial
institutions and authorities to assess whether a service is being
delivered in line with legal and regulatory obligations.
The report concludes that there do not
appear to be immediate financial stability risks stemming from the use
of cloud services by financial institutions. However, there may be merit
in further discussion among authorities to assess: (i) the adequacy of
regulatory standards and supervisory practices for outsourcing
arrangements; (ii) the ability to coordinate and cooperate, and possibly
share information among them when considering cloud services used by
financial institutions; and (iii) the current standardisation efforts to
ensure interoperability and data portability in cloud environments.
According to Moody’s, on 5 December, the Reserve Bank of New Zealand (RBNZ) announced the finalisation of its capital requirements for New Zealand banks. The RBNZ’s decision to raise capital requirements – although slightly watered down from its earlier proposal – is broadly credit positive, because it will make the banking system more resilient to shocks. At the same time, the higher capital requirements will weigh on the banks’ return on equity. We expect the new measures will prompt higher lending rates in efforts to boost profitability and constrain growth in more capital-intensive lending.
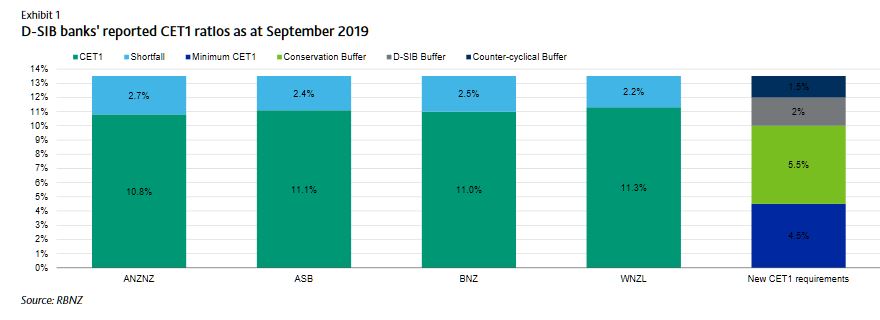
For domestic systemically important banks (D-SIBs), which are New Zealand’s four largest banks, ANZ Bank New Zealand Limited, ASB Bank Limited, Bank of New Zealand, and Westpac New Zealand Limited, the Common Equity Tier 1 (CET1), Tier 1 and Total Capital requirements have risen to 13.5%, 16% and 18% of risk weighted assets (RWA), respectively. While the new rules are a slight relaxation from the RBNZ’s initial proposal of 14.5%, 16% and 18% announced in December 2018, they represent a significant increase from the current requirements of 7%, 8.5% and 10.5%. For all other banks, the CET1, Tier 1 and total capital ratio requirements will be 11.5%, 14% and 16%, respectively.
The RBNZ also announced that existing Additional Tier 1 and Tier 2 securities will no longer count towards regulatory capital. Replacing them will be redeemable, perpetual, preference shares and subordinated debt, provided these securities do not have any contractual contingent features such as conversion or write-off at the point of non-viability.
The higher requirements will be implemented by maintaining a regulatory minimum Tier 1 ratio of 7%, of which 4.5 percentage points must be CET1 capital, and introducing a number of prudential capital buffers, which total 9 percentage points (see Exhibit 1). Under the new framework, banks can temporarily operate below 13.5%, but above 4.5%, without triggering a breach of regulatory requirements. However, they will be subject to more intensive supervision and other consequences such as dividend restrictions. On average, the D-SIB CET1 ratios are around 2.5 percentage points lower than the new requirement of 13.5% (Exhibit 1).
The RBNZ is also limiting the difference between the calculation of RWAs by D-SIBs, which use the internal ratings based approach (IRB), and other banks that use the Standardised approach. This will be done by recalibrating the calculation IRB banks’ RWAs to around 90% of the outcome under the Standardised approach. The combination of higher capital ratio targets and higher RWAs imposed on D-SIBs could spur more competition by reducing some of the capital advantage previously enjoyed by banks using the IRB approach.
The new capital regime will take effect from 1 July 2020 and the banks will have up to seven years to meet the new rules, an increase from the five years initially proposed. The RBNZ’s decision to extend the transition period will ensure banks are well placed to meet the new targets, especially given the Australian Prudential Regulation Authority’s (APRA) recent changes to Australian Prudential Standards (APS) 222 to further restrict how much equity support Australia’s largest banks can provide to their New Zealand subsidiaries, and proposed changes to APS 111, which will increase the capital requirements of providing such support.
The Australian parents of the New Zealand D-SIBs Australia and New Zealand Banking Group Limited, Commonwealth Bank of Australia, National Australia Bank Limited, and Westpac Banking Corporation have all disclosed the estimated impact of the new rules (Exhibit 2).