Westpac has provided an update on accounting provisions for remediation associated with authorised representatives in relation to certain ongoing advice service fees.
This follows the group’s 25 March 2019 ASX announcement on remediation provisions, where it announced an increase in provisions for its salaried planners and indicated that assessments were underway in relation to authorised representatives. Authorised representatives are advisers who maintain direct relationships with their customers for financial planning services, while operating under the Magnitude and Securitor advice licenses.
Westpac
said these advisers received ongoing advice service fees from their
customers of approximately $966 million between 2008 and 2018. Based on
the information currently available, Westpac today said that its cash
earnings in First Half 2019 will be reduced by $357 million for
accounting provisions associated with this matter.
The $510 million provision (pre-tax) is based on a
range of accounting assumptions relating to potential payments of $297
million (pre-tax), interest costs of $138 million (pre-tax) and $75
million (pre-tax) in remediation program costs.
That part of the
current estimated provision which relates to potential payments
represents around 31 per cent of the ongoing advice service fees
collected over the period which compares to 28 per cent estimated for
salaried planners.
Westpac said it will continue to work with
current and prior authorised representatives and their customers to
determine where a payment should be provided. The final cost of
remediation will not be known until all relevant information is
available and payments have been made. The bank is yet to finalise its
remediation approach, which may change following industry and regulator
discussions.
“While it is disappointing that we have needed to
make these provisions, I said at the end of last year that our priority
was to deal with any outstanding issues and process payments as quickly
as possible,” Westpac CEO Mr Brian Hartzer said.
“As part of our
‘get it right put it right’ initiative we are fixing issues and are
determined to ensure that they don’t reoccur.”
Property Expert Joe Wilkes and I discuss the issues arising from falling home prices, and Joe walks through the latest Auckland data. As prices continue to fall, “a bargain” simply does not exist!
A
review of APRA’s 2013 superannuation prudential framework has found it
met its original objectives but must keep evolving to ensure members’
interests are protected.
APRA commenced a post-implementation
review of the framework introduced as part of 2013’s Stronger Super
reforms in May last year, to assess how it had performed in the five
years since it was introduced. Until the package of 13 prudential
standards, supporting guidance and reporting standards came into force,
registrable superannuation entity (RSE) licensees were not subject to
legally binding prudential standards in the same way as other
APRA-regulated entities.
The review found the prudential framework
had materially lifted industry practices in key areas as governance,
risk management and outsourcing. But it also highlighted the need for
APRA to continue strengthening prudential requirements in several areas,
including board appointment processes, management of conflicts of
interest and life insurance in superannuation.
APRA’s review
stated that appropriately managing conflicts of duty and interest is
critical to ensuring that RSE licensees comply with their overarching
obligation to act in the best interests of members.
“However, the Royal Commission noted a number of
areas where RSE licensees appeared not to have managed their conflicts
of interest appropriately, particularly with respect to related party
arrangements,” the regulator said.
While APRA’s review found that
the key procedural requirements of its conflcits management framework
(SPS 521) have “generally been met at an industry-wide level”, the
regulator said it is not clear that the importance of effectively
managing all potential conflicts of interest through a members’ best
interests’ lens is embedded within the culture of all RSE licensees.
APRA’s
proposed enhancements to mitigate conflicts of interest in
superannuation include requiring RSE licensees to explicitly assess the
impact of conflicts of interest on member outcomes and introducing a
two-stage process for the consideration of conflicts of interest.
“First establish interests held, then establish whether those interests give rise to a conflict,” the regulator said.
APRA’s
thematic review noted that policies underlying the conflicts management
framework were in some instances too narrowly focused on conflicts
arising in relation to responsible persons and did not cover conflicts
arising for the RSE licensee as a whole.
“This narrow approach
undertaken by some RSE licensees tended to be characterised by a lack of
consideration of how these conflicts might be perceived by external
stakeholders,” the regulator said.
“The thematic review also
noted that, in many cases, the conflict identification process relied
solely on self-identification by directors or responsible persons, with
no independent review undertaken. It also found a lack of consistency
across the industry in the identification and management of conflicts
when dealing with intra-group services and product providers and other
related parties. These inconsistencies arose, in part, due to
inadequacies in the conflicts management framework for these types of
RSE licensees.”
APRA Deputy Chair Helen Rowell said it was
important that the prudential framework continued to evolve as the
industry developed and regulatory priorities changed.
“The
Stronger Super reforms deliberately focused on ensuring superannuation
trustees that often manage billions of dollars on behalf of members had
the necessary frameworks in place to effectively administer the
fundamentals of operating their business,” Mrs Rowell said.
“As
the industry has matured and lifted its practices, we have shifted our
emphasis to ensuring trustees are focused on enhancing member outcomes,
especially with last December’s package of reforms.
“We are
already taking steps to strengthen the prudential framework in many of
the areas highlighted by the review, and we will look to make further
changes to incorporate its findings as we progress our superannuation
policy priorities. This will include consideration of measures to
address relevant recommendations in the financial services Royal
Commission report and the report on the Productivity Commission’s
superannuation review.”
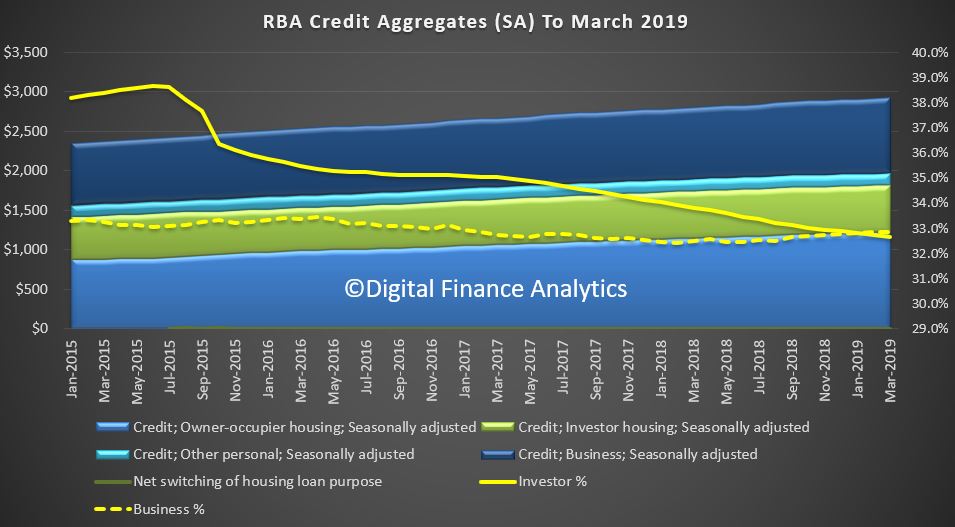
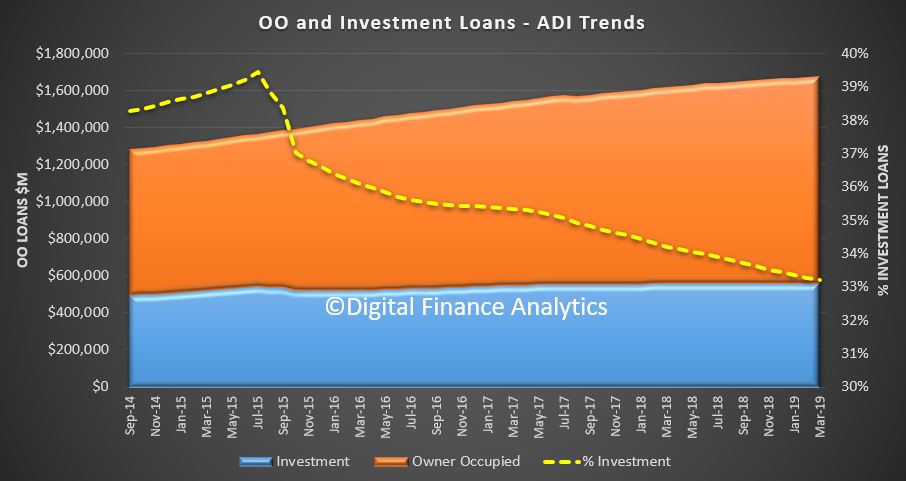
The headline news is the overall housing credit is up, to a new record of $1.82 trillion dollars up 0.31% from last month, or 0.31%. Within that owner occupied lending rose 0.32% to $1.22 trillion dollars and investment lending was flat. 32.7% of lending stock is for investment lending purposes, a slight fall from last month, whilst business lending as a proportion of all lending rose from 32.9% from 32.8% to reach $963.7 billion dollars. Personal credit fell 0.27% or $0.4 billion, to $147.1 billion, and continues to fall.
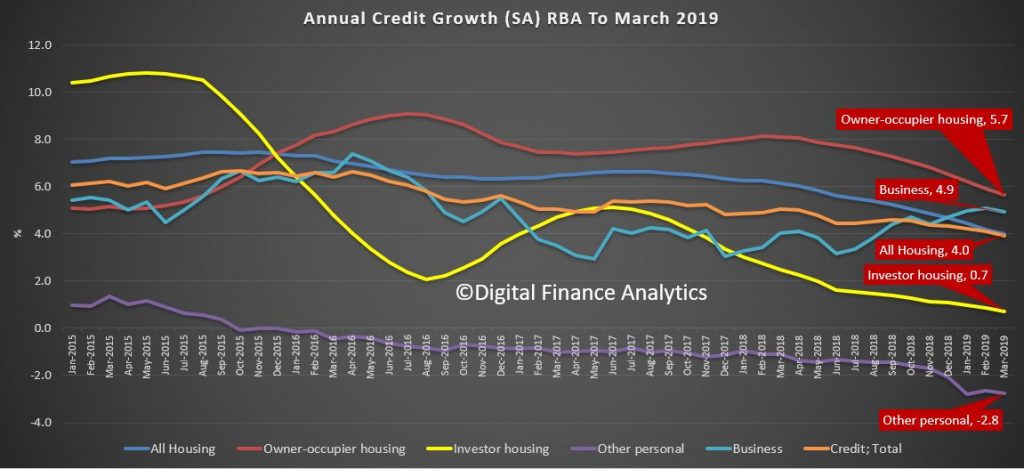
The annualised movements by category shows further weakness, with lending for owner occupied housing now at 5.7%, investment housing lending at 0.7%, giving housing overall growth of just 4% (though still higher than wages growth I would add). Personal credit fell 2.8% over the past year, while business lending rose 4.9% annualised. All these figures are on a seasonally adjusted basis
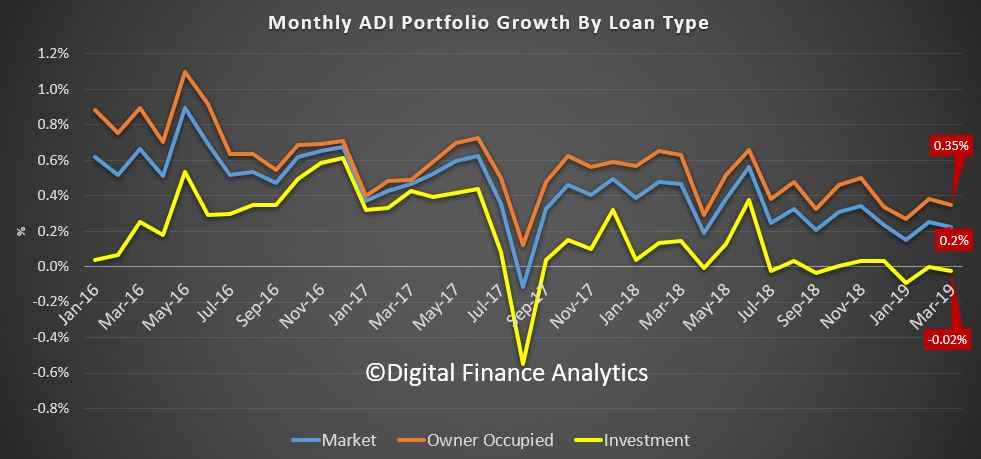
Turning to the APRA data on the banks, owner occupied lending rose 0.35% in March, while investment lending fell by 0.02%, giving total credit growth of just 0.2%. Over the past year owner occupied loans grew by 4.8% (compared with 5.7% at the aggregate level) and investor loans grew 0.4% (compared with 0.7% at the aggregate level). So the banks loan portfolios are growing more slowly than the market.
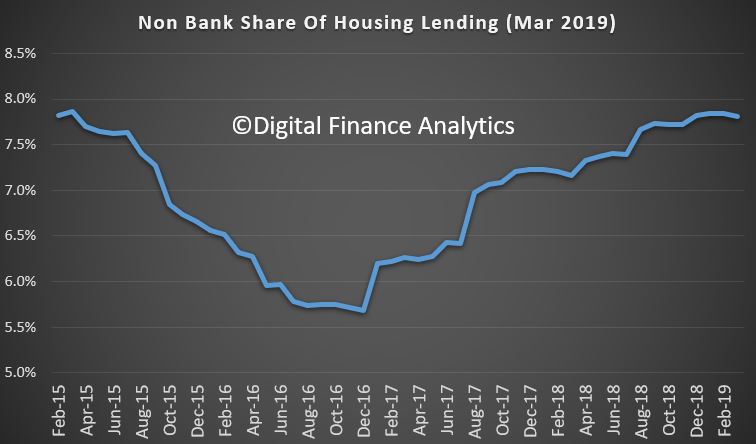
This can be illustrated by comparing the RBA and APRA data (warts and all) to show the non-bank sector is growing faster than the banks. Overall, they have over 7.5% of the market, which is up from the low in December 2016.
In addition, the rate of growth is significantly higher than the banks. Non-bank owner occupied loans are growing at an annual rate of 14%, while investment loans are 2.2%; both significantly higher than the ADI’s. Non-banks have weaker regulation, and more ability to lend. APRA has yet to truly engage with the sector.
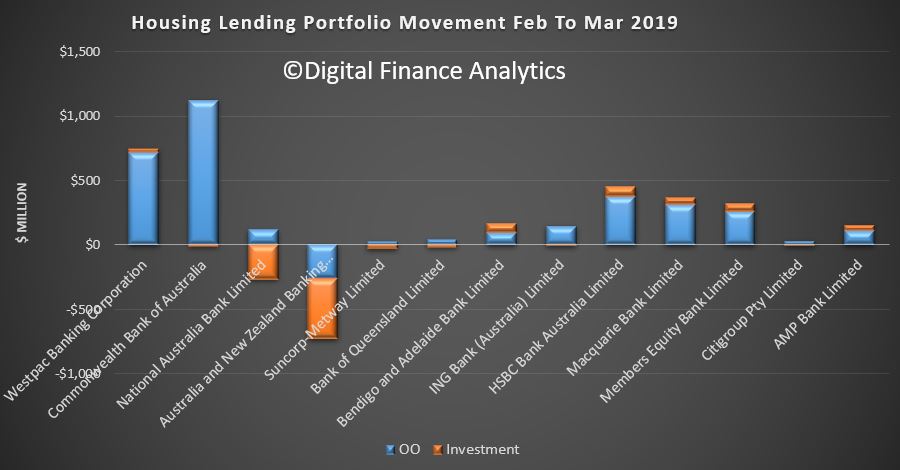
Turning back to the individual lenders, the changes in their portfolios over the month show that Westpac and CBA offered the most new owner occupied loans, while ANZ dropped back, on both owner occupied and investment loans, while NAB dropped investment lending. HSBC, Macquarie and Member Equity Bank (ME) lend more than the regionals.
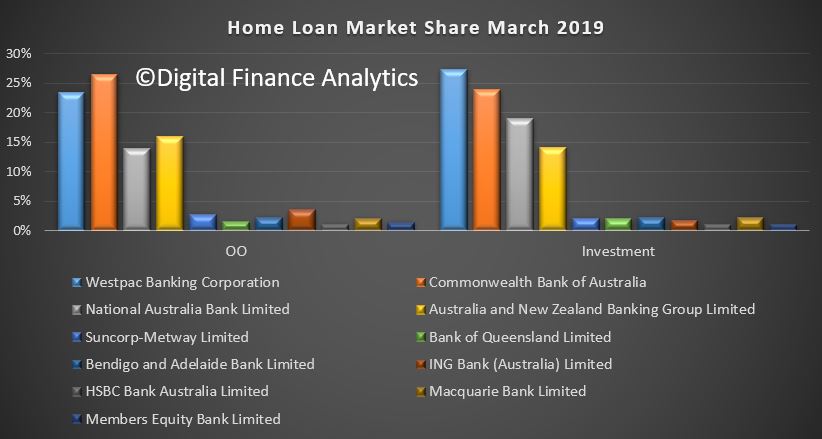
Overall market shares hardly moved, with CBA still the largest owner occupied lending, and Westpac the biggest investor lender.
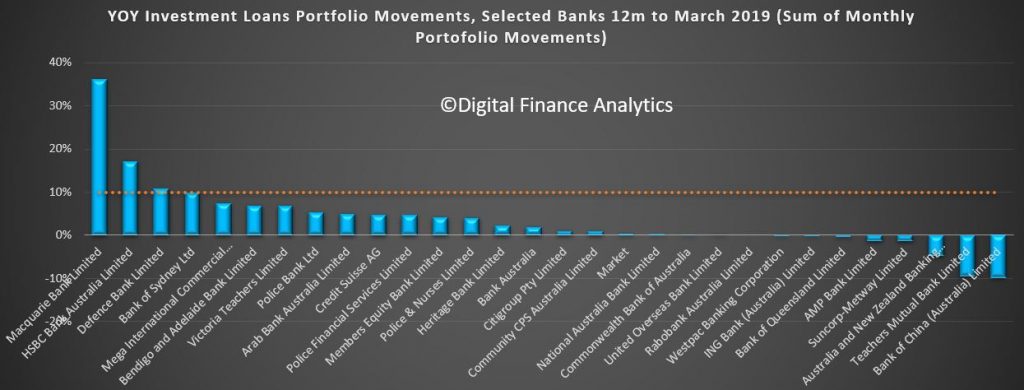
Investment lending growth over the past 12 months has been anemic, but some lenders such as Macquarie are making hay. Of course the old 10% speed limit from APRA has gone now, but the relative growth highlights the fact that the four majors are well below market growth levels – and ANZ the weakest (which is why they said they wanted to lend more).
So finally, the total ADI lending book is at $1.68 trillion dollars, with owner occupied loans comprising $1.12 trillion dollars and investment loans $557 billion dollars, and comprising 33.2% of the portfolio – as the ratio continues to fall.
In conclusion, the credit impulse – the rate of change of credit being written is the most significant forward indicator of house price trajectory. The weak state of the market suggests more and significant price falls ahead. Yet despite all this, household debt will continue to rise. There is absolutely no reason to loosen lending requirements, or drop the hurdle rate on these numbers. More households will get into trouble ahead.
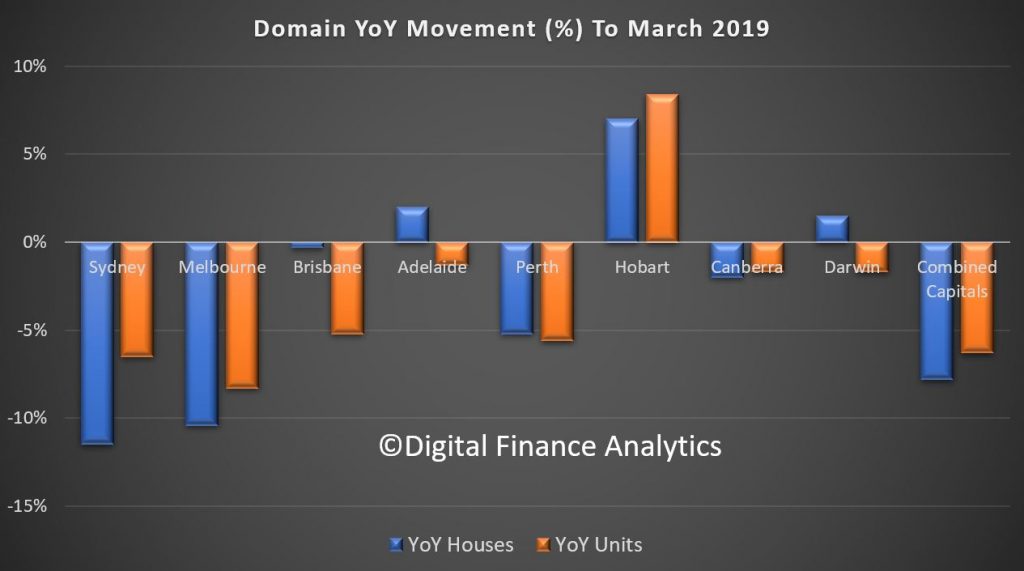
Domain has released their March quarter 2019 house price data. Sydney, Melbourne and Perth are bearing the brunt of the falls, alongside units in Brisbane, according to their statistics. Hobart remains the most buoyant but buyer interest appears to have passed its peak . And of course remember these are average figures which mask local changes.
They says that Sydney’s current property downturn is the sharpest in more than two decades. It is yet to surpass the duration of the 2004-06 slump but it is coming close to being the longest. Sydney house prices have fallen 14.3 per cent from the mid-2017 peak. If the pace of quarterly decline remains, prices are likely to dip below $1 million in the coming quarter. A six-figure median house price has not been recorded in four years. Sydney unit prices have fallen 9.9 per cent from the mid-2017 peak. For the first time in three years unit prices are below $700,000.
Despite further price deterioration to house and unit prices over the quarter, the rate of decline has eased from the quarterly falls recorded last year. House prices are now back to early 2016 and units back to mid-2015. However, house prices are 30.2 per cent higher and unit prices 20.7 per cent higher than five years ago, providing many homeowners with substantial equity gain.
Melbourne is currently facing its steepest downturn in more than two
decades. House prices have fallen for five consecutive quarters, down 11
per cent from the peak reached at the end of 2017. Unit prices have
held firmer, with price falls shorter and less severe relative to
houses. Unit prices have deteriorated for four consecutive quarters,
pulling prices back 8.3 per cent from the peak notched a year ago.
The Melbourne property market started 2019 better than 2018 ended, with auction clearance rates nudging higher (admittedly from lower volumes), views per listing rising marginally, and banks now actively seeking new business. The rate of house price declines have eased over the latest quarter.
Greater Brisbane house prices have stalled following six years of
continuous annual growth, with prices flatlining over the year.
Homeowners may not be reaping equity gain but flat house prices is a
better outcome than a fall, which is what’s playing out across most
capital cities.
The housing market remains fragmented with houses outperforming units. This has been a trend since mid-2012. Unit prices are 9.6 per cent below the mid-2016 peak, with buyers now able to reap the benefits of purchasing at 2013 prices. Significant supply numbers have weighed heavily on unit prices. Although listing volumes are shrinking, it has not been enough to translate into price growth yet.
House prices in Adelaide have bucked the national downward trend and
became one of only three capital cities to rise over the year.
Homeowners have reaped the benefit of almost six years of steady annual
house price growth. House prices may have flatlined over the quarter,
but it is the second best outcome of all the capital cities, behind
Hobart. The sustainable pace of annual growth has slowed to a
five-and-a-half year low. This weakness provides further evidence that
credit access is having an impact on markets that would otherwise have
steady growth.
Adelaide is now the third most affordable city to purchase a house, surpassing Perth’s median house price for the first time since 1993. House prices currently remain higher than Hobart, but galloping Hobart prices mean the price gap is at a 12-year low. Adelaide’s unit prices have marginally fallen from the record high achieved last quarter, but remain the most affordable of all the capital cities.
Early indicators previously displayed some encouraging signs of a
recovery in Perth’s housing market. However, over the first quarter of
this year, house and unit price falls have gathered pace. House prices
are now 14 per cent and unit prices 16.6 per cent below the 2014 peak.
Buyers continue to have the upper hand. Improved affordability is providing the ultimate silver lining for prospective homeowners, allowing a purchase to be made at 2011 prices. Perth’s recovery is being hindered by a more restrictive lending environment at a time when local confidence is subdued under weak economic conditions. A sluggish economy is being dragged down by high unemployment, a tight consumer purse, and weak population growth.
Hobart bucked the national downward trend, and remains the best
performing city for capital growth. It became the only city to record
growth over the quarter and year for both houses and units. Despite
this, the pace of house price growth has slowed to half of that recorded
over the same period in 2018, providing homeowners the lowest annual
growth since mid-2016. In the space of a year-and-a-half, Hobart has
gone from the most affordable city to purchase a unit, to more expensive
than Adelaide, Darwin and Perth. If the pace of growth continues,
Hobart unit prices are likely to overtake Brisbane’s in the coming
months.
Hobart became a hotspot for investors, a destination for interstate buyers seeking the ultimate lifestyle location, and tourism flourished helping to drive economic growth and place pressure on housing demand. Buyer interest appears to have passed its peak, with Domain recording a slip in the number of views per listing over the past two months. It is likely that capital gains will be more subdued than the double-digit growth recorded last year.
Canberra’s housing market has shown the first signs of price weakness
since 2012. House prices had their steepest annual fall in a decade,
following a stint of continuous growth that spanned roughly six years.
Despite this, the nation’s capital has a tendency to be the quiet
achiever, providing homeowners with steady equity growth. Historically,
any pullback in house prices tend to be short and relatively minor,
apart from the 1995-97 downturn. Current market conditions are likely to
be the same, a short period of softening rather than the correction
currently unravelling in Sydney and Melbourne.
Unit prices continue to slide over the quarter and year, with the market failing to produce a steady period of price growth since 2009-10. The outlook for apartment prices has been mixed, providing only subdued capital growth over the past five years, up by 4.5 per cent. Equity growth in houses has been superior at 25.8 per cent.
The peak of Darwin’s housing market is in the rear-view mirror – with
prices hitting a high during 2013-14. House and unit prices continue to
be impacted from the weak economic conditions that have ensued post the
mining boom, with a soft employment sector and lack of migration
weighing on the demand for housing. A recovery in Darwin’s housing
market largely hinges on the government’s attempts at boosting the
population, jobs growth and an improvement in the availability of
housing credit.
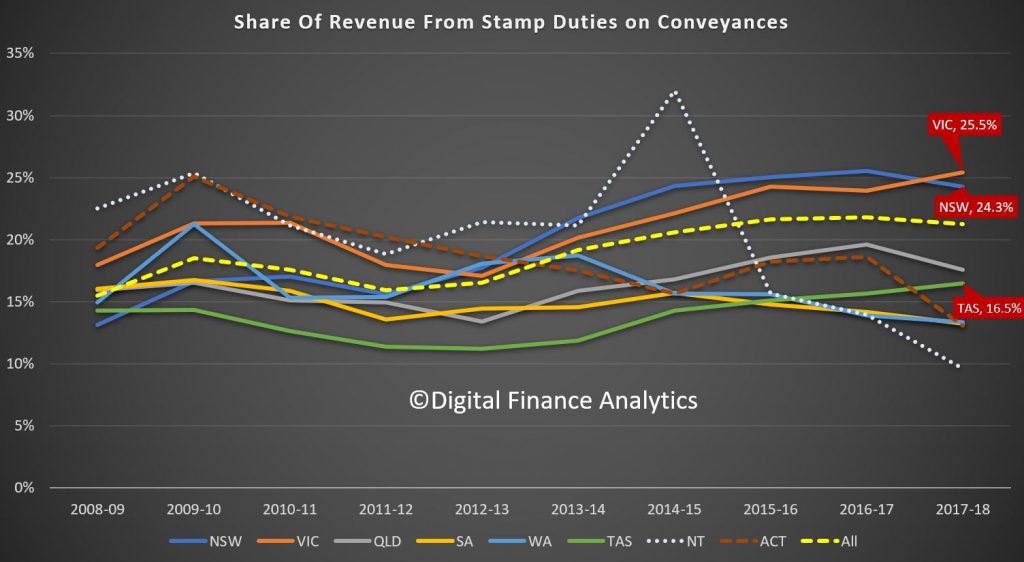
First, the share of revenue for the states, drawn from stamp duty is falling, but still makes up 25.5% of Victoria’s take and 24.3% of New South Wales. Guess what will happen in the housing sales momentum continues to ease.
State coffers will be under pressure (so expect to see ways to entice people to transact ahead).
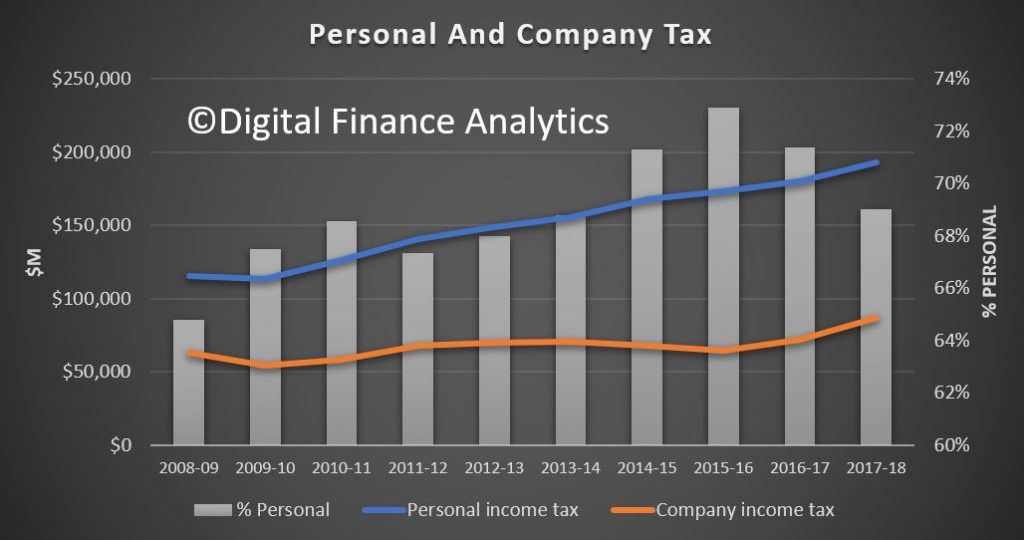
The other relates to the mix of personal income tax and corporate tax, bearing in mind that in real terms, personal income is flat, while company profits are pretty healthy (for now).
We see that back in 2008-9 the proportion of personal tax sat at 64.8%, rose to a peak of 72.9% in 2015-16, and sat at 69% in 2017-18. Bracket creep will explain much of the rise of course.
Puts the drive to reduce company tax further into a different context, given the current financial pressures on households.
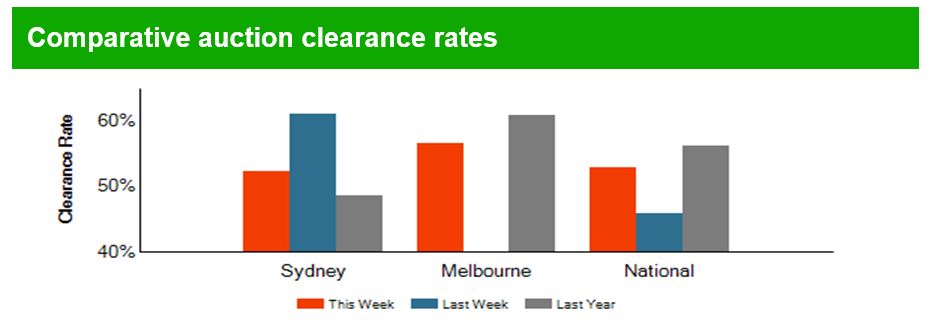
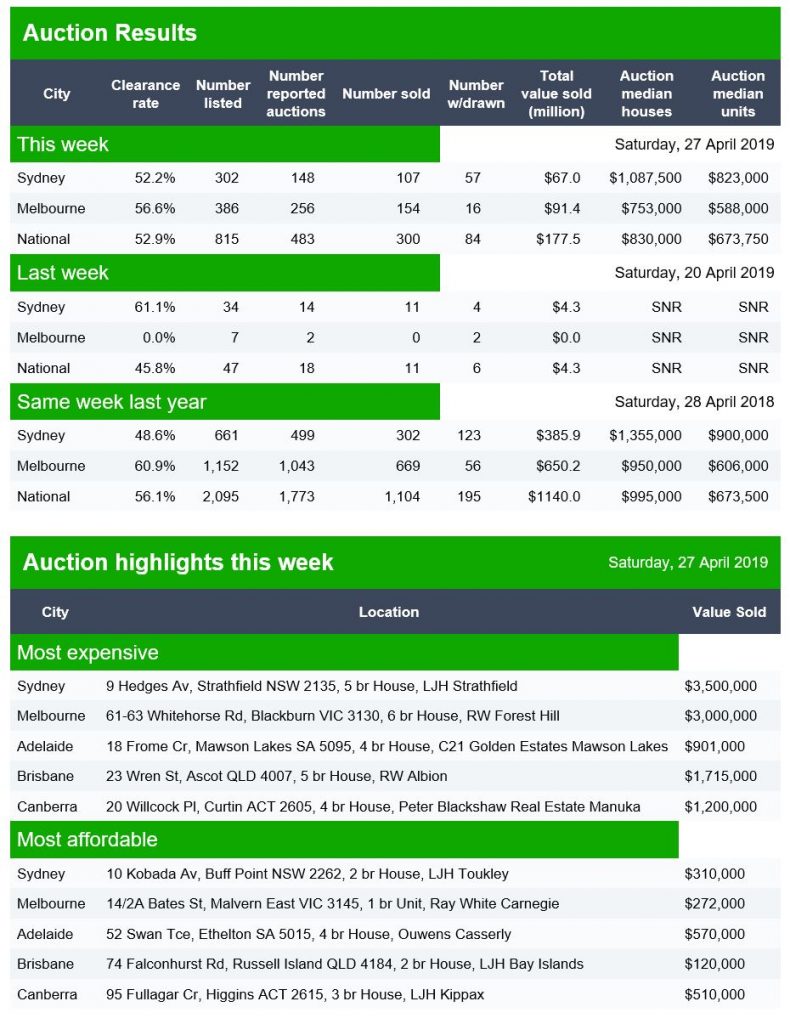
The latest results continue to yield low volumes after last weekend’s holidays. Nationally 815 were listed compared with 2,095 a year ago, 38% of last years count.
Sold so far are 300 compared with 1,104, of 27% of last years count (though it may settle higher).
So those who claim the market is buoyant, need to take account of the lower volumes.
Canberra listed 17 and reported 16 with 6 sold and 1 withdrawn giving a Domain clearance of 35%.
Adelaide listed 33 and reported 16 with 7 sold and 3 withdrawn giving a Domain clearance of 37%.
Brisbane listed 77 and reported 47 with 26 sold and 7 withdrawn giving a Domain clearance of 48%.