We just released a new show on “In The Interests Of The People“, in which Economist John Adams, Property Expert Edwin Almeida and I discuss the problem of fake news, and why so many spruikers are pushing a line.
The first week of the federal election campaign has been dominated by heated disputes about the numbers behind both government and opposition policies, via The Conversation.
Both sides are under pressure. Notably, the cost of Labor’s 45% emissions-reduction target has been rightly questioned.
Opposition leader Bill Shorten’s answer to reporters that “our 45%
reduction, including international offsets, has the same economic impact
as the Liberals’ 26%” didn’t exactly engender confidence.
But the folly of Labor’s environmental plans is another tale for another column.
Our focus here is on how the Coalition is going to cut personal income tax by A$158 billion and balance the budget.
Wild assumptions
Earlier this week the Grattan Institute pointed out
the Coalition’s budget assumption that expenditure will fall from 24.9%
of GDP in 2018-19 to 23.6% during the next decade amounts to cutting
spending by more than A$40 billion a year in 2029-30.
This raised the natural question of exactly where those cuts will
come from. According to the government, it’s from things such as lower
welfare payments and lower interest payments on government debt.
The Grattan Institute’s Danielle Wood described these assumptions as “heroic”. Yup.
Now, you might wonder why the Coalition’s plan to cut personal income
tax doesn’t fully kick in until 2025. Or, for that matter, why its
“enterprise tax plan” on corporate tax is scheduled to be phased in over
a decade.
Playing outside the rules
The short answer is that for the four years following a budget – the
so-called “forward-estimates period” – there are rules about banking
spending cuts.
During those four years, cuts need to be specified, or economic
parameters need to be varied. And with good reason. That way the actual
assumptions the government is making, however fanciful they may be, are
plain for all to see.
But beyond the four-year period no such discipline applies. This
allows governments of all stripes to make very specific claims about,
for example, tax cuts they plan to deliver without having to be at all
specific about how they are going to pay for them.
This is all just a conjuring trick. Politicians try to get us to
focus on the tangible, specific thing we want – tax cuts, more money for
hospital or schools, free cancer treatment – while obfuscating how they
are going to pay for it.
It’s dirty pool. It’s not cricket. It’s the kind of thing a mob accountant does. Pick your favourite metaphor.
Bipartisan failure
Of course, treasurer Josh Frydenberg and finance minister Mathias
Cormann didn’t invent this unscrupulous practice. Wayne Swan and Penny
Wong, as treasurer and finance minister respectively, were guilty of
these kind of shenanigans too.
The specifics of the current round can’t even be debated properly,
because ten-year “guesses” don’t lay out specific assumptions that can
be checked for internal consistency and plausibility.
Sadly, it seems futile to hope for cultural change among politicians and a shift to integrity.
To some extent, we need to be the change we want.
The fact both sides of politics so brazenly play us for suckers is as
much our fault as it is theirs. If politicians thought there were real
consequences at the ballot box for this sort of behaviour, they would
think twice.
But there aren’t. When both sides are guilty it’s understandable that
voters become so cynical that they just factor it in and look to other
issues.
If more voters were willing to make “cooking the books” a decisive issue, that might change.
Need for incentives
Politicians respond to incentives. My favourite illustration of that
is how United Nations officials used to be exempt from parking tickets
in New York City. As economists Ray Fisman and Ted Miguel showed,
when norms alone governed behaviour, officials from corrupt countries
basically parked wherever they wanted. Once city authorities got the
ability to confiscate diplomatic licence plates of violators, things
improved radically.
So as long as the mainstream media refuses to issue our politicians
with the moral equivalent of parking tickets for cooking the books of
public debate, politicians are going to keep doing it.
Now, many commentators do exactly that – and some of them are
brilliant and fearless. But other folks, on the right and on the left,
seem to have the attitude that both sides play fast and loose with the
facts so it’s fine for them to call out whichever side they personally
like the least.
Actually, scratch “seem to have the attitude”. They’ll tell you that to your face.
When Australian cricket captain Steve Smith and vice-captain David
Warner got caught in a ball-tampering racket, there were consequences.
When our elected representative do something similar, but with our
nation’s finances –with consequences for growth, employment, welfare
benefits, retirement incomes, and climate change – they get a pass.
That’s got to stop; and we’ve all got our part to play.
Author: Richard Holden, Professor of Economics, UNSW
NAB says that an additional charge of $525 million after tax ($749 million before tax) relating to its customer remediation programme. As a result 1H19 cash earnings will drop by around $325 million and earning from discontinued operations by $200 million.
They say they have made around 360,000 payments to customers with a total valuer of $145 million, and the remediation team is building from 350 to around 500 across NAB.
Of the 1H19 charges, 90% relate to wealth, the remainder banking. IN combination with provisions raised in 2H18, total provisions for customer related remediation to 31 Match 2019 is $1,102 million.
The items responsible for this include:
Consumer credit insurance
Non-compliant advice to wealth customers
Adviser service fees by NAB advice partnerships (does not include allowance for customer refunds)
Adviser service fees charged by NAB Financial Planning
Banking related matters such as incorrect fee take on fee expect transactions.
These costs are to be held below the line as it were, but clearly investors and potentially customers will have to pay for this litany of poor practice.
It begs the question, can the NAB behaviourial norms be turned around? And at what cost?
The ABS has reported that Australia’s trend estimate of employment increased by 20,700 persons in March 2019, with:
the number of unemployed persons increasing by 3,000 persons;
the unemployment rate remaining steady at 5.0%;
the underemployment rate remaining steady at 8.2%;
the underutilisation rate remaining steady at 13.2%;
the participation rate remaining steady at 65.6%; and
the employment to population ratio remaining steady at 62.4%.
Over the past year, trend employment increased by 299,100 persons (or
2.4%), which was above the average annual growth rate over the past 20
years of 2.0%. Over the same 12 month period the trend employment to
population ratio, which is a measure of how employed the population
(aged 15 years and over) is, increased by 0.4 percentage points (pts) to
62.4%.
Trend employment increased by 20,700 persons between February and March
2019. This represents an increase of 0.16%, similar to the monthly
average growth rate over the past 20 years (0.17%), and less than the
monthly average growth rate over the past five years (0.22%).
Underpinning these net changes in employment is extensive dynamic
change, which occurs each month in the labour market. In recent months
there has been around 300,000 people entering and leaving employment.
There is also further dynamic change in the hours that people work,
which results in changes in the full-time and part-time composition of
employment.
Trend full-time employment increased by 18,000 persons between February
and March 2019, and part-time employment increased by 2,700 persons.
Compared to a year ago, there are 252,800 more persons employed
full-time and 46,300 more persons employed part-time. This compositional
shift led to a decrease in the part-time share of employment over the
past 12 months, from 31.7% to 31.3%.
The trend estimate of monthly hours worked in all jobs increased by 4.3
million hours (or 0.2%) in March 2019, to 1,776.8 million hours. Monthly
hours worked increased by 2.4% over the past year, equal to the
increase in employed persons (2.4%). The average hours worked per
employed person was 138.9 hours per month, or around 32.0 hours per
week.
The trend unemployment rate remained steady at 5.0% in March 2019. The
number of unemployed persons increased by 3,000 to 675,700 persons. Over
the past year, the trend unemployment rate decreased by 0.5 pts, with
the number of unemployed decreasing by 51,100 persons.
The trend participation rate remained steady at 65.6% in March 2019,
which was equal to March 2018 (65.6%). The female participation rate
remained steady at 60.6% and the male participation rate remained steady
at 70.9%.
The labour force includes the total number of employed and unemployed
persons. Over the past year, the labour force increased by 248,000
persons (1.9%). This rate of increase was above the rate of increase for
the total Civilian Population aged 15 years and over (360,500 persons,
or 1.8%).
The trend participation rate for 15-64 year olds, which controls (in
part) for the effects of an ageing population remained steady at 78.1%.
The gap between male and female participation rates in this age range is
less than 10 pts, at 82.8% and 73.6% respectively, continuing the long
term convergence of male and female participation.
The trend participation rate for 15-24 year olds (who are often referred
to as the “youth” group in the labour market) remained steady at 68.0%.
The unemployment rate for this group remained steady at 11.4% in March
2019 and decreased by 0.7% over the year.
The trend series smooths the more volatile seasonally adjusted estimates
and provide the best measure of the underlying behaviour of the labour
market.
SEASONALLY ADJUSTED ESTIMATES
Seasonally adjusted employment increased by 25,700 persons from February
to March 2019. The underlying composition of the net change was an
increase of 48,300 persons in full-time employment and a decrease of
22,600 persons in part-time employment. Since March 2018, full-time
employment increased by 289,800 persons, while part-time employment
increased by 14,900 persons.
Seasonally adjusted monthly hours worked in all jobs increased by 13.2
million hours (or 0.7%) in March 2019 to 1,785.4 million hours.
The seasonally adjusted employment to population remained steady at
62.3% in March 2019, and increased by 0.4 pts from the same time last
year.
GRAPH 1. EMPLOYMENT TO POPULATION RATIO, PERSONS, March 2009 to March 2019
The seasonally adjusted unemployment rate increased by 0.1 pts to 5.0%
in March 2019. The participation rate increased by 0.1 pts to 65.7%.
STATE AND TERRITORY ESTIMATES
TREND ESTIMATES
In March 2019, increases in trend employment were observed in all states
and territories except Western Australia (down 200 persons) and
Tasmania (down 100 persons). The largest increases were in Victoria (up
7,600 persons), followed by New South Wales (up 6,800 persons) and
Queensland (up 4,900 persons).
Over the past year, increases in employment were also observed in all
states except Tasmania (down 2,300 persons). Both territories recorded
falls with the Australian Capital Territory (down 1,600 persons) and
Northern Territory (down 4,800 persons). The largest increases were in
Victoria (up 127,500 persons), New South Wales (up 118,500 persons),
Queensland (up 36,100 persons). The highest annual employment growth
rates were in the Victoria at 3.9%, followed by New South Wales at 3.0%
and Queensland at 1.5%. For most states and territories, year-on-year
growth in trend employment was below their 20 year average, the
exceptions being New South Wales and Victoria.
The monthly trend unemployment rate increased by 0.1 pts in Tasmania
(6.5%) and the Australian Capital Territory (3.6%). It remained
unchanged in New South Wales (4.3%), Victoria (4.6%) and South Australia
(5.9%). It decreased by under 0.1 pts in Western Australia (6.1%) and
Queensland (5.9%), and fell 0.2 pts in the Northern Territory to 4.4%.
The monthly trend underemployment rate increased in the Northern
Territory (up 0.2 pts to 5.4%), Victoria (up 0.1 pts to 8.4%) and
Tasmania (up less than 0.1 pts to 10.1%). Decreases of up to 0.1 pts
were seen in New South Wales (7.5%), South Australia (8.9%), Queensland
(8.6%), Western Australia (8.9%) and the Australian Capital Territory
(5.9%).
Monthly trend participation rate decreases were observed in Northern
Territory (down 0.2 pts to 73.8%), Western Australia (down 0.1 pts to
67.8%) and Australian Capital Territory (down 0.1 pts to 69.2%). The
monthly trend participation rate increased less than 0.1 pts in New
South Wales (65.2%) and Victoria (66.1%). It remained unchanged in all
remaining states.
SEASONALLY ADJUSTED ESTIMATES
In seasonally adjusted terms, the largest increase in employment was in
Queensland (up 10,400 persons), followed by Victoria (up 10,000 persons)
and South Australia (up 8,500 persons). The largest decrease was in New
South Wales (down 2,600 persons) followed by Tasmania (down 1,800
persons).
The seasonally adjusted unemployment rate increased in Queensland (up
0.7 pts to 6.1%), South Australia (up 0.2 pts to 5.9%), Tasmania (up 0.2
pts to 6.7%), Western Australia (up 0.1 pts to 6.0%) and New South
Wales (up 0.1 pts to 4.3%). The only decrease in the unemployment rate
was observed in Victoria (down 0.1 pts to 4.6%).
The largest underemployment rate increase in seasonally adjusted terms
was seen in Queensland (up 0.9 pts to 8.9%) followed by South Australia
(up 0.4 pts to 8.8%), Western Australia (up 0.3 pts to 8.9%) and
Tasmania (up 0.2 pts to 9.9%). The only decrease was seen in New South
Wales (down 0.2 pts to 7.4%).
The largest increases in the seasonally adjusted participation rate were
in South Australia (up 0.7 pts to 63.2%) and Queensland (up 0.6 pts to
65.6%). The seasonally adjusted participation rate decreased in
Tasmania (down 0.4 pts to 60.3%), New South Wales (down 0.1 pts to
65.1%) and Victoria (down 0.1 pts to 66.0%).
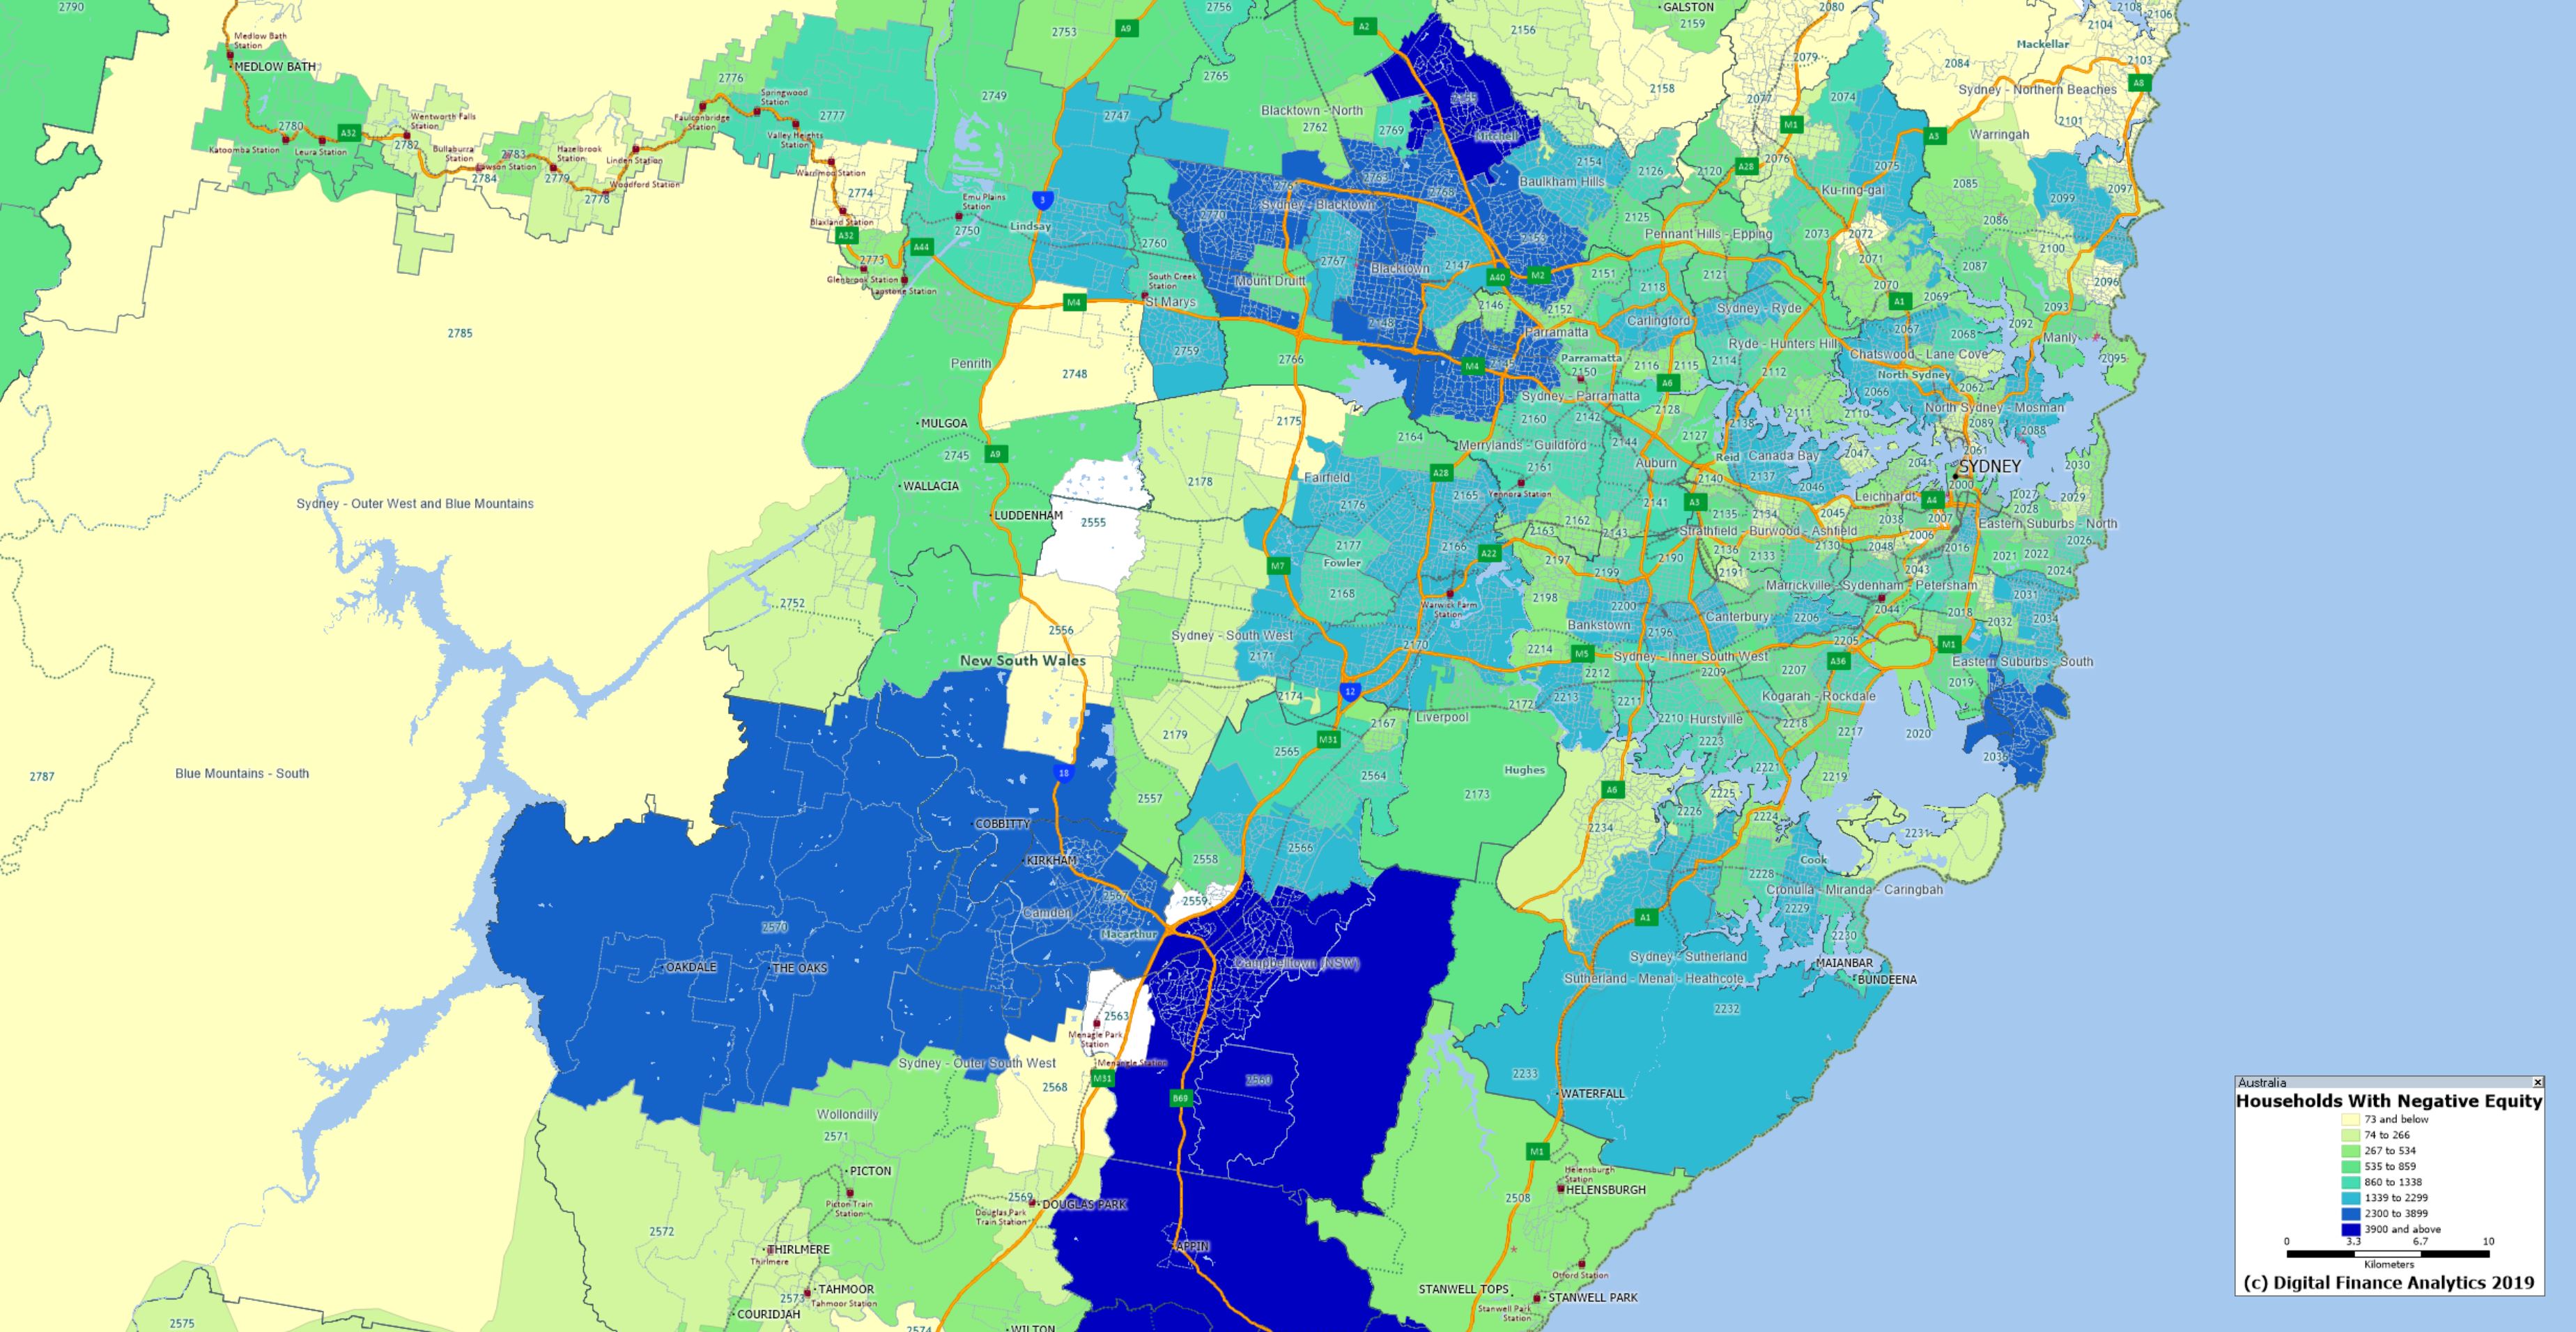
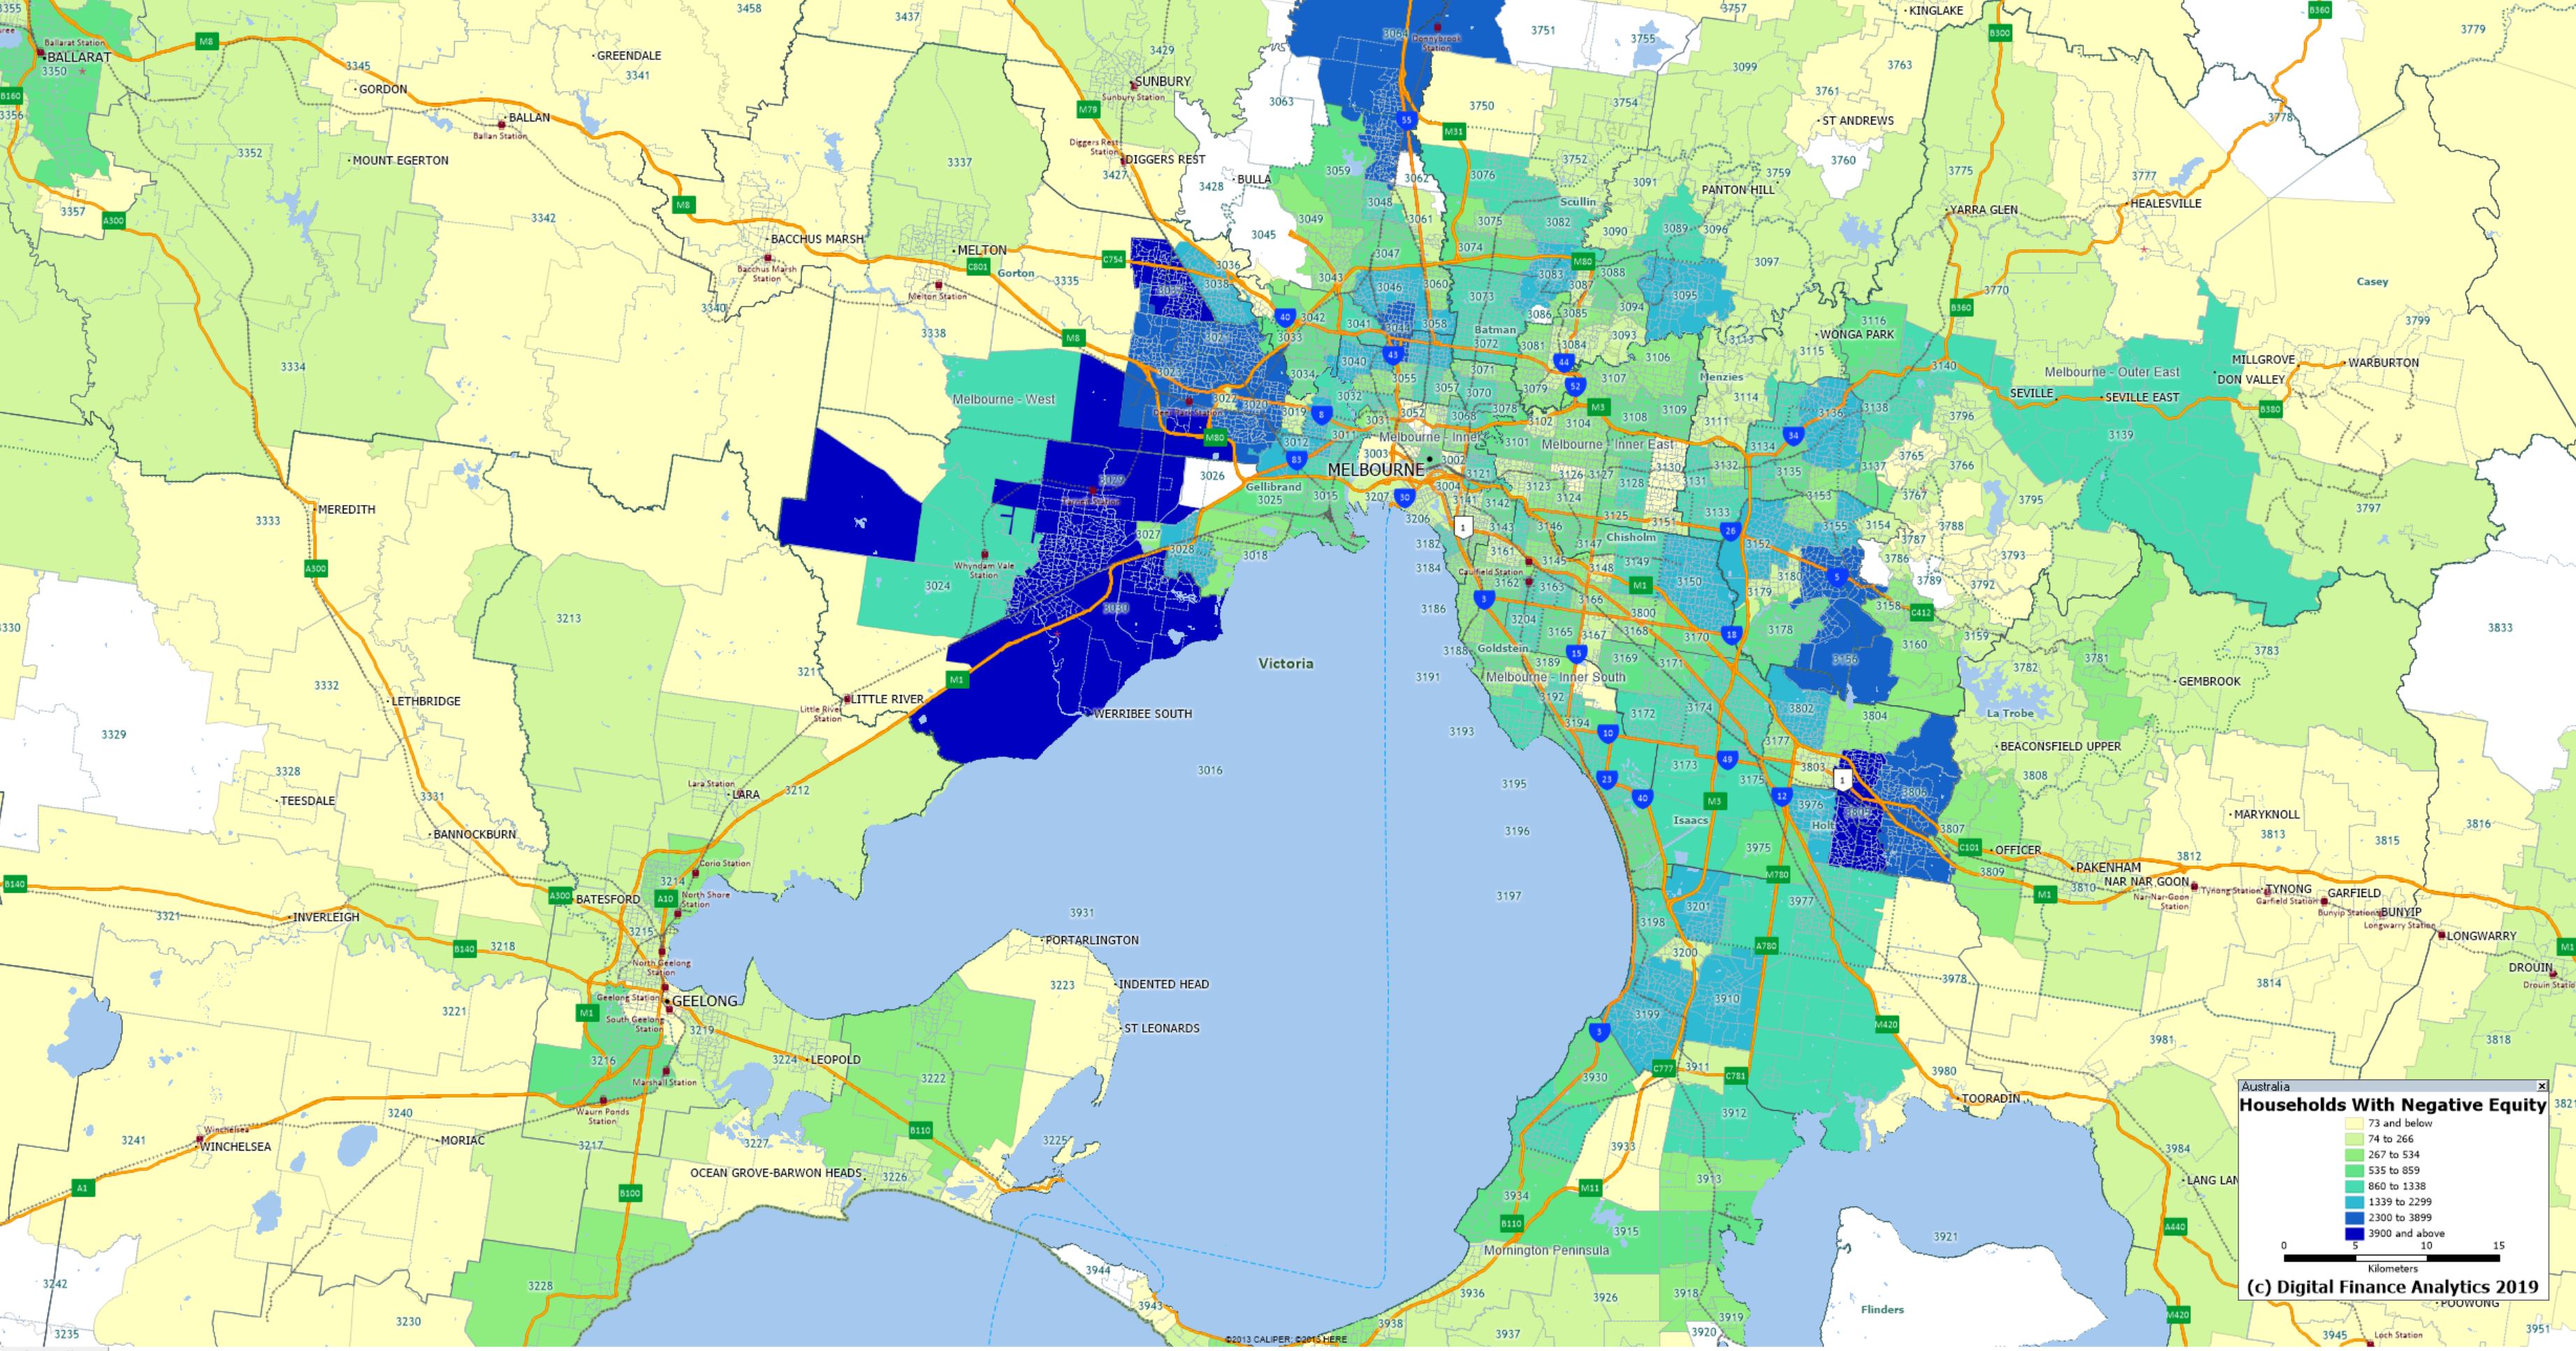
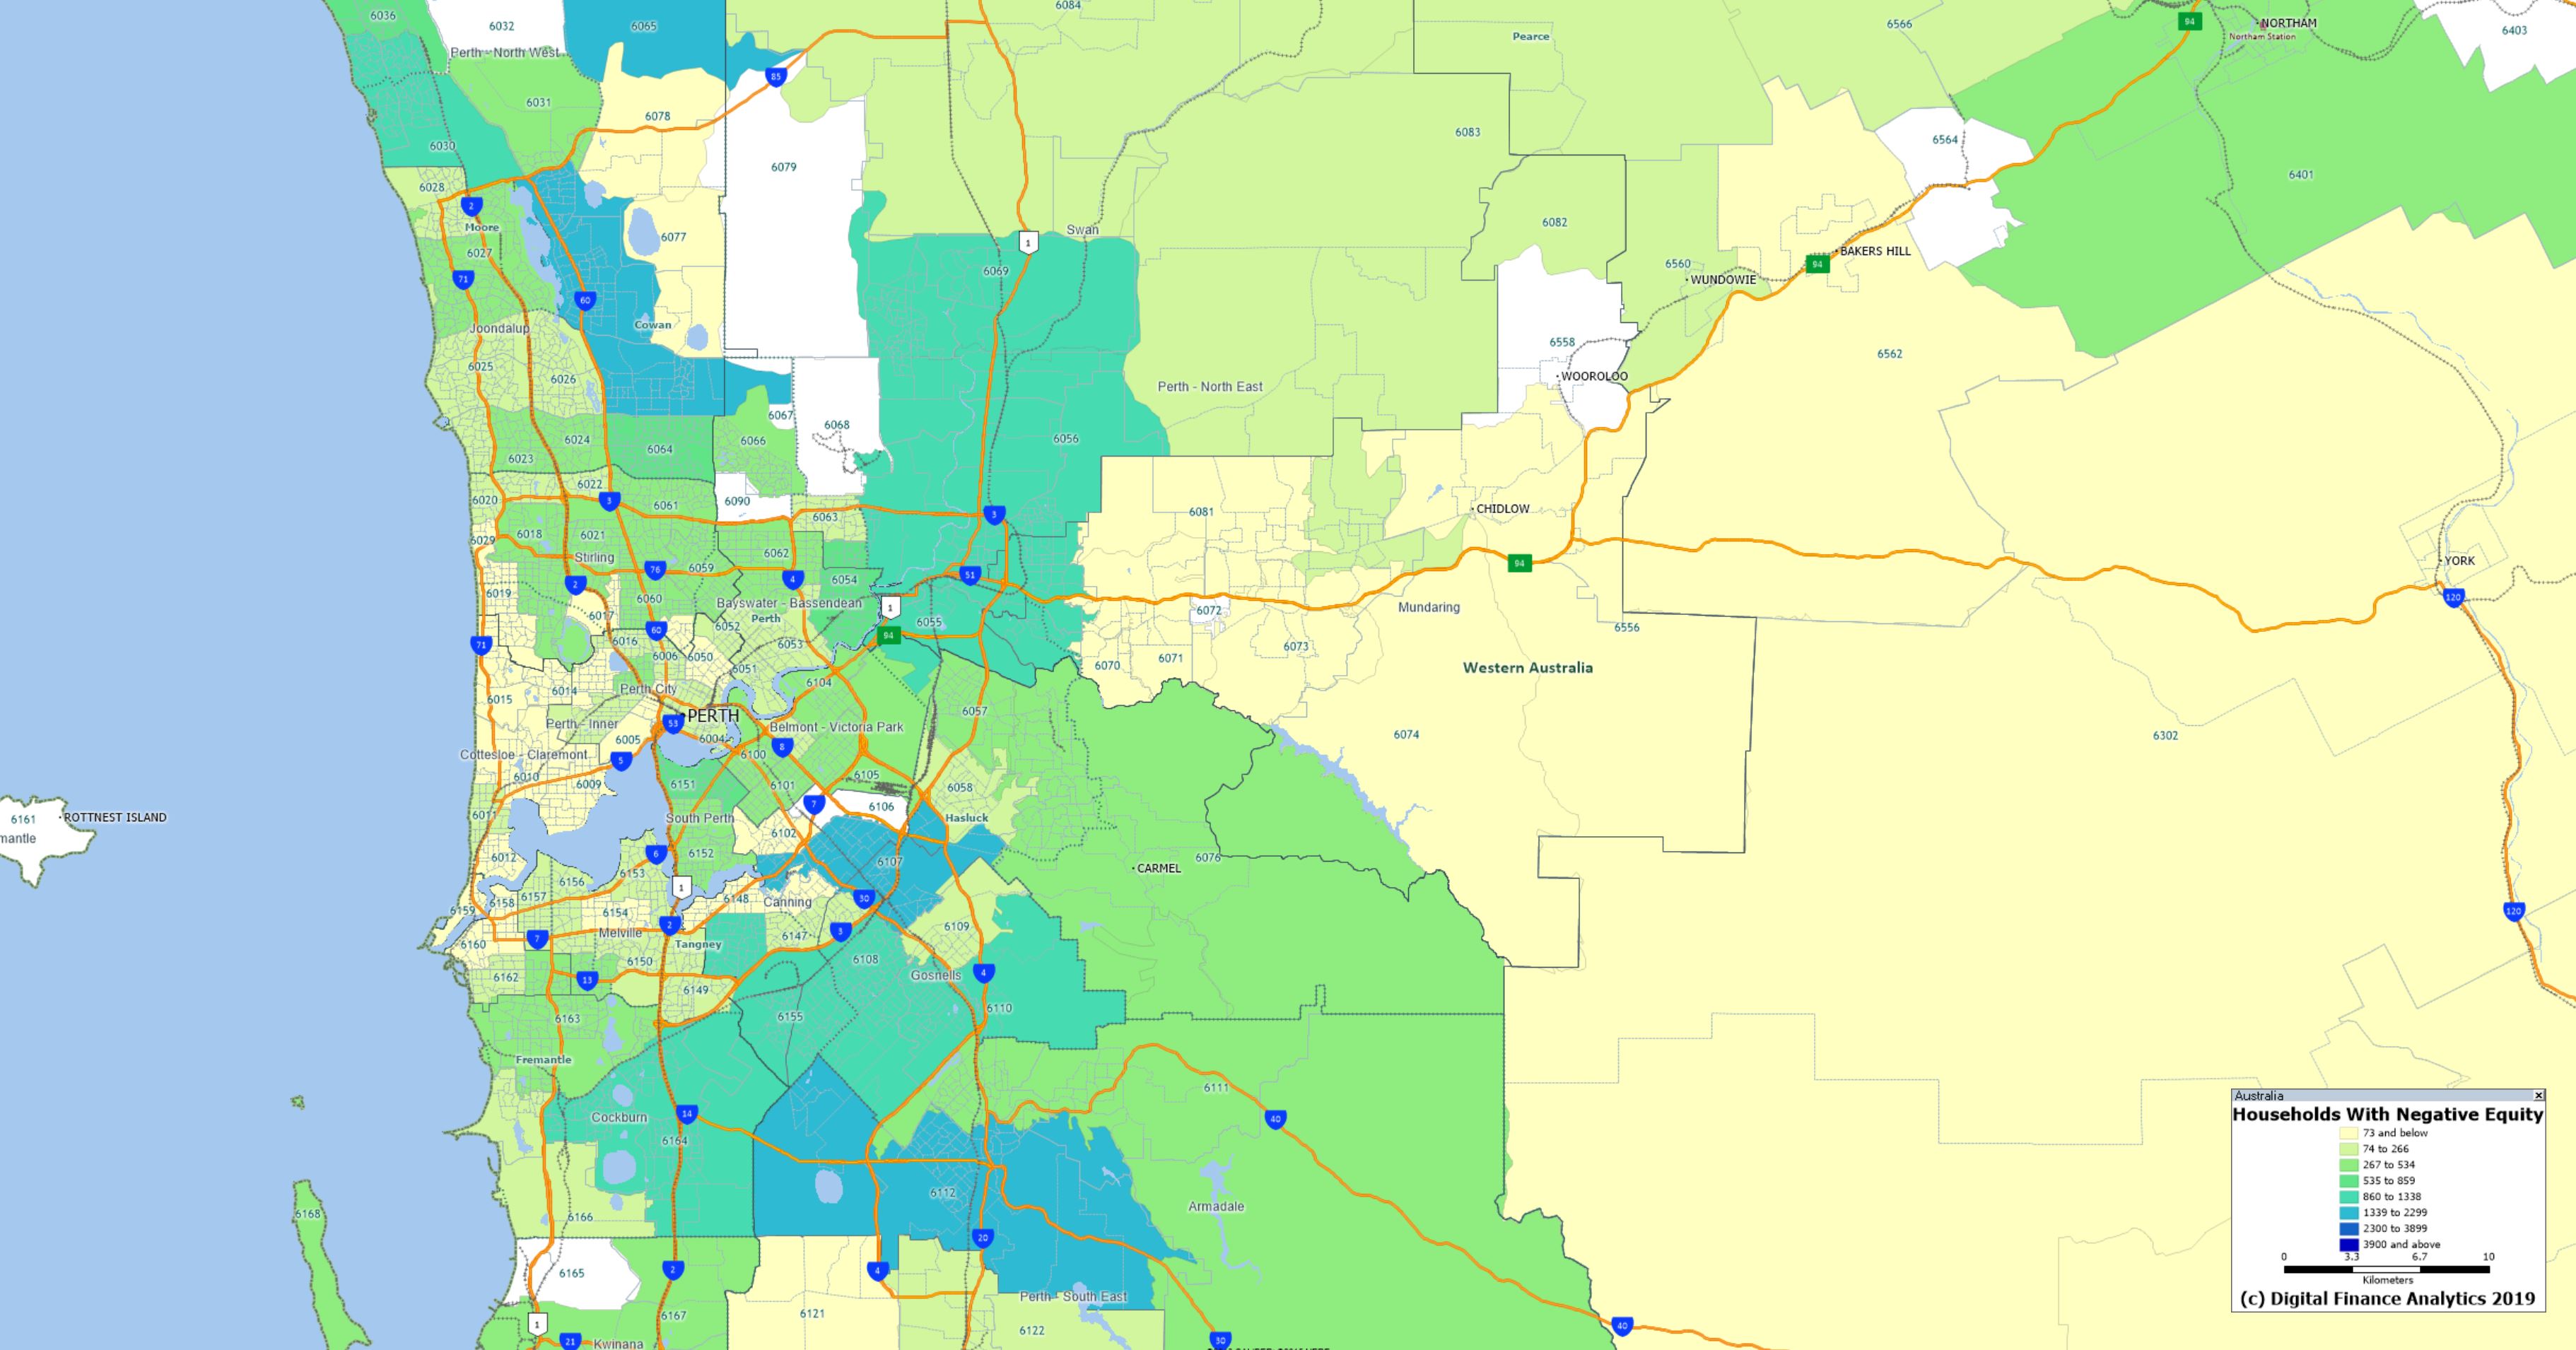
Following 7/30’s report last night I have received a number of requests for access to the maps. So here are the high resolution versions for Sydney, Melbourne and Perth. If they are reproduced elsewhere, please attribute DFA.
As discussed in my video, this is based on the number of households in each post code recording at least one property in negative equity – where the current mortgage (net of any offset accounts) in greater than the estimated current forced sale value plus sale costs. The analysis is based on results from our 52,000 household surveys nationwide.
The major
banks have seen their reputations significantly downgraded in an annual
perception survey, with AMP placing last out of 60 Australian companies.
The
Reputation Institute’s Australia RepTrak 2019 list examined 60 of the
top revenue making Australian firms, which saw all of the big four banks
and AMP ranked within the bottom ten.
The list was based on a
survey with around 10,000 respondents giving ratings across factors such
as trust and respect to generate overall reputation, in addition to
seven parameters: products/services, innovation, workplace, citizenship,
governance, leadership and performance.
AMP scored the lowest out of any company across all seven dimensions, dropping by 18 rankings from 2018.
NAB was the next lowest bank, falling at 58th place and having fallen 15 rankings from the year before.
Commonwealth Bank of Australia remained at its spot of 57th, while Westpac fell nine places to 55th.
ANZ fared the best of the big four, coming in at 51st, having fallen 16 places.
“In
the past 12 months we’ve seen many issues raised about corporate
behaviour and consumer trust,” Oliver Freedman, vice president and
market leader, Reputation Institute said.
“As a result, the reputations of our major banks and some financial services organisations have taken a major hit.”
Meanwhile,
Bendigo and Adelaide Bank rose seven places to 11th, which Mr Freedman
said was due to a strong performance in the individual measurements of
citizenship and governance.
“This proves that you can be a bank
and still have a strong reputation if you are focused on reputation
drivers that resonate with customers and increase trust,” he added.
Macquarie on the other hand came in at 42nd, down five places, as Allianz fell seven places from the year before to 37th.
New addition to the list Rest Super ranked 21st,while the Reserve Bank of Australia placed 18th, having risen by eight places.
AustralianSuper was down eight places to 15th.
“The
banking sector has a long road to recovery and could learn a lot from
those with consistently strong rankings, like Qantas and Air New
Zealand,” Mr Freedman said.
A brief segment on the ABC today which includes DFA data on negative equity, the Kouk, and reference to the RBA data.
They missed two important points I made in my interview, first my data is households not loans, and second the falls in value should require banks to mark to market their portfolios.
The maps can be seen here. This video walks through the mapping in detail.