Majors Mortgage Share Slips – AFG

AFG has today released Competition index figures for the final quarter
of 2017. Whilst this is a skewed result, reflecting traffic through AFG only, it is a reasonable bellwether.

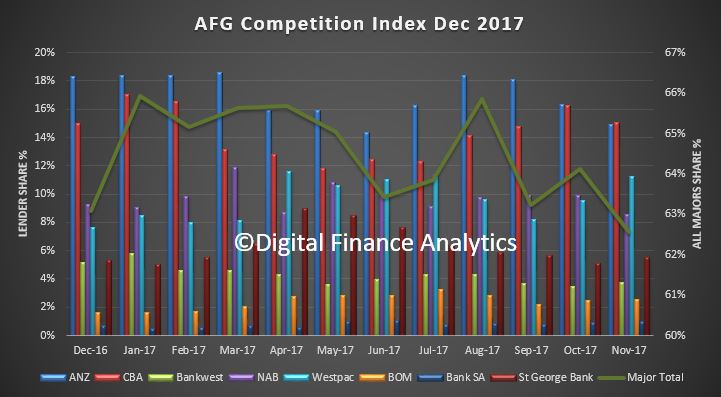
Once again, Australia’s major lenders have taken a hit with their market share now down to a post-GFC low of 62.57% of the mortgage market. The majors lost ground in all categories since the time of the last AFG Competition Index, including a drop of more than 3% in refinancing and more than 2% in fixed rates.

AFG General Manager – Broker and Residential Mark Hewitt explained the results: “The major banks have been under intense scrutiny by government and the regulators and it is probably no wonder if they have been distracted,” he said.

“With the recently announced Royal Commission into the banking sector we all hope lenders can respond whilst still maintaining a focus on their customers.

The Royal Commission, and the industry need to focus on how competition can be further improved and this should include the impact the government guarantee has on competition.

“The Westpac group as a whole were the only ones to make up any ground, up from 19.19% at the time of the last AFG Competition Index to finish the quarter at 20.33%.

ANZ lost the most ground amongst the major banks, down 3.5% for the quarter.

The non-majors now enjoy a market share of 37.43%.

“The non-majors picking up market share were Macquarie, with an increase from 2.91% to 4.70% and AFG Home Loans with a lift from 8.88% to 10.15%,” concluded Mr Hewitt.

Are There More Risks In The Mortgage Book Than Surveys Suggest?

The Bank of England issued a staff working paper – “A tiger by the tail: estimating the UK mortgage market vulnerabilities from loan-level data“.

They have taken data from 14 million mortgages and run modelling across the cohorts to determine the LVR, LTI and DSR of mortgages. This is approach is an alternative to the survey led methods used by the Bank of England. Significantly, they conclude that risks in the system are understated using the survey methods (an analogy would be HILDA here); compared with the granular data. Policy makes are, they say, understating the risks.  We agree!

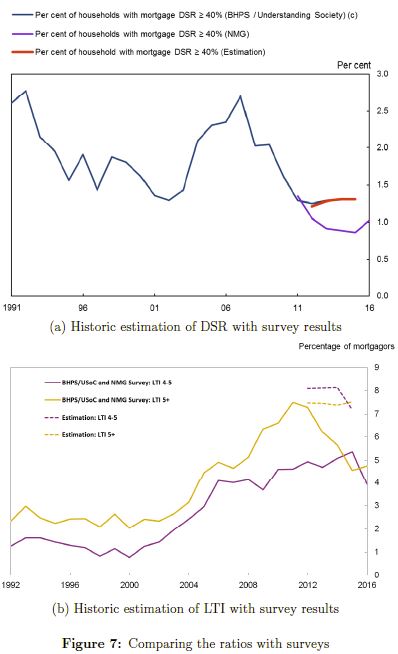
Our estimate provides an alternative source to track the tail of vulnerable borrowers in the UK. It suggests a larger tail compared to the available household surveys. While the Bank of England/NMG survey points to a falling tail of high DSR loans in recent years, our estimations indicate that it remained almost flat. Similarly, our estimations suggest a consistently higher share of high LTI loans over time. These results should make policy makers less sanguine about the developments in the UK mortgage market in recent years, which are traditionally analysed using these surveys.

In the absence of loan-level stock of mortgages in the previous years, policy makers have been relying on survey data to monitor risks to financial stability and calibrate policies. As already discussed, surveys can be subject to biases and small sample issues, so our work provides an alternative estimate of the LTI, DSR and LTV distributions. Notably, we find that size of the tail of vulnerable borrowers might have been higher in recent years than surveys suggest.

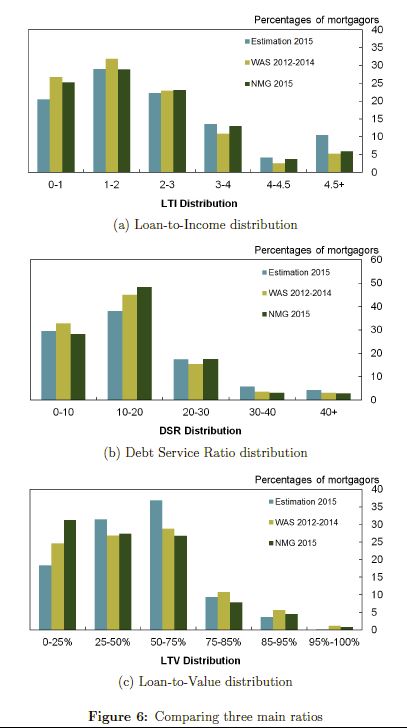
Figure 6 shows LTI, DSR and LTV distributions from our estimation against data from the NMG and WAS surveys as of 2015. Our estimate suggests a larger vulnerable tail (LTI above 4.5 and DSR above 40) compared to surveys. This is consistent with the finding that individuals tend to underestimate outstanding loan amount in surveys or highly indebted borrowers are under-represented in surveys. There is greater discrepancy in LTV distributions, which could be attributed to further bias in how individuals report property values in surveys.

Figure 7 compares the evolution of the tail of high LTI and DSR from our estimate and surveys over time. While the NMG survey suggests that the share of loans with DSR above 40% has decreased in recent years, our estimations indicate that it remained almost  flat. Similarly, our estimations for high LTI shares are steadily higher. Our stock estimation can also shed light on the characteristics of specific cohorts of borrowers and loans. To illustrate the type of analysis can be done by using the loan-level estimate, we present the age distribution of high DSR (40%+), high LTI (4.5+) and high LTV (85%+) loans.

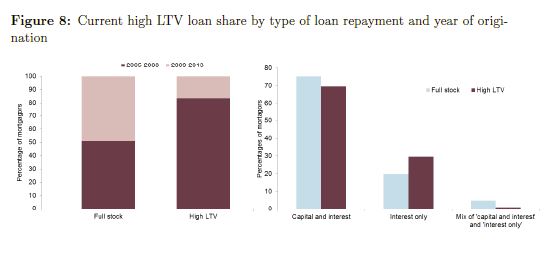
Figure 8 shows the characteristics of current high LTV loans. We find that most of the LTV loans were originated pre-2009, before credit conditions tightened materially in the UK. We also see that a large proportion of outstanding loans with high LTVs (85%+) are interest-only. This suggests that if policy makers are concerned with the tail of high-LTV mortgages that are interest-only, analysing the flow of new loans is unlikely to provide much insight, as interest-only loans are currently very rare. The focus needs to be turned to the high-LTV cohort in the stock and the interest-only loans originated in pre-crisis period.

Our estimate provides an alternative source to track specific cohorts of borrowers in the UK mortgage market. We find that a larger tail of vulnerable borrowers than household surveys suggest. While survey data suggest that the share of high DSR loans has decreased in recent years, our estimations indicate that it remained almost  flat. Similarly, our estimate of high LTI shares over time are steadily higher than surveys. All these results suggest that policy makers should be less sanguine about the developments in the UK mortgage market in recent years. As these analyses are based on very detailed granular regulatory data, we believe the results are more reliable than surveys.


Note: Staff Working Papers describe research in progress by the author(s) and are published to elicit comments and to further debate. Any views expressed are solely those of the author(s) and so cannot be taken to represent those of the Bank of England or to state Bank of England policy. This paper should therefore not be reported as representing the views of the Bank of England or members of the Monetary Policy Committee, Financial Policy Committee or Prudential Regulation Committee.

Enhanced Financial Services Product Design Obligations Announced

The Treasury has released draft legislation for review  which focusses on the design and distribution obligations in relation to certain financial products. We think is is potentially a big deal, and will put more compliance pressure on Financial Services providers. It is a response to the FSI recommendations. Consultation is open until 9 February 2018. It includes investment products and well as credit products such as consumer leases, mortgages, and guarantees.

It sets out:

  • the new obligations;
  • the products in relation to which the obligations apply;
  • ASIC’s powers to enforce the obligations; and
  • the consequences of failing to comply with the obligations.

Here is a brief summary of the 57 page document.

The new design and distribution regime generally applies to a financial product if it requires disclosure in the form of a PDS. However, some financial products requiring a PDS are not subject to the new design and distribution regime: MySuper products and margin lending facilities. These products are currently subject to product-specific regulations that negate the need to apply the new regime.

The new design and distribution regime also applies to financial products that require disclosure to investors under Part 6D.2 of the Corporations Act. The section defines ‘securities’ for the purposes of Chapter 6D of the Corporations Act as meaning: a share in a body; a debenture of a body (except a simple corporate bond depository interest issued under a two-part simple corporate bonds prospectus); or a legal or equitable right or interest in such a share or debenture. Again, there are some exceptions.

The obligations require issuers of such products to:

  • determine what the appropriate target market for their product is
  • take reasonable steps to ensure that products are only marketed and distributed to people in the target market, and that appropriate records are kept to demonstrate this
  • and gives ASIC powers to “intervene” if a financial or credit product has resulted in or will, or is likely to, result in significant detriment to retail clients or consumers. There are two main limitations on the types of financial products that can be subject to the intervention power under the Corporations Act. First, the power generally only applies in an ‘issue situation’. Second, the power only applies where a product may be made available to ‘retail clients’.

Background

As part of the Government’s response to the Financial System Inquiry (FSI), Improving Australia’s Financial System 2015, the Government accepted the FSI’s recommendations to introduce:

  • design and distribution obligations for financial products to ensure that products are targeted at the right people (FSI recommendation 21); and
  • a temporary product intervention power for the Australian Securities and Investments Commission when there is a risk of significant consumer detriment (FSI recommendation 22).

This consultation seeks stakeholder views on the exposure draft of the Treasury Laws Amendment (Design and Distribution Obligations and Product Intervention Powers) Bill 2018 which implements these measures.


Why Are Interest Rates So Low? – Don’t Blame Central Banks

Yesterday we discussed a BIS working paper which suggested that Central Banker’s monetary policy have driven real interest rates lower, rather than demographics.

So, highlighting that modelling can prove anything, another working paper, this time from the Bank of England, comes down on the other side of the argument.  The paper “Demographic trends and the real interest rate” says two-thirds of the fall in rates is attributable to demographic changes (in which case Central Bankers are responding, not leading rates lower). In fact, pressure towards even lower rates will continue to increase.

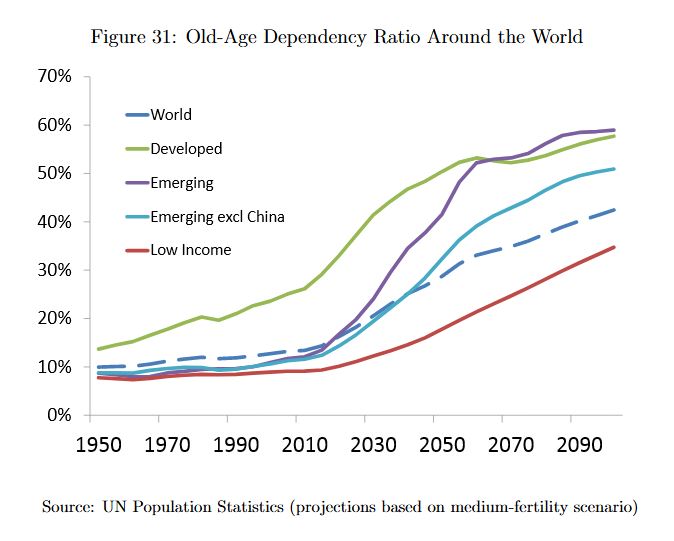
In the 2010s, advanced countries’ long-term real interest rates fell well below zero, to levels unprecedented in a period of peacetime and stable inflation. While the global financial crisis has played a part, this was the continuation of a downward trend that began at least two decades previously. At the same time, the population of advanced countries has continued to age, with life expectancy and the old-age dependency ratio reaching new highs. This paper quantifies the link between these two important trends. The advanced world is in the midst of a rapid and unprecedented ageing of its population, driven by a fall in birth rates and, more importantly, a rise in life expectancy.

When old-age pensions were first institutionalised in the early 20th century, the chance of reaching pensionable age, and residual life expectancy at that point, were relatively low. In contrast, the overwhelming majority of the population can now expect to retire for several decades. Households need to accumulate increased resources through their working lives to fund at least part of this. Furthermore, as household wealth tends to fall only slowly over retirement, more of the population will be at relatively high-wealth stages of life. This rise in the population’s effective propensity to hold wealth will in turn have profound effects on the financial system, its key relative price – the real interest rate – and the prices of other assets. To the extent that these trends are stronger or weaker in different countries, they will also give rise to international payments imbalances.

We use an overlapping generations model, calibrated to advanced country data, to assess the contribution of population ageing to the fall in real interest rates which the world has seen over the past three decades. We find that global demographic change can explain three-quarters of the 210bp fall in global real interest rates since 1980, and larger fractions of the rises in house prices and debt. Importantly, the sign of these effects will not reverse as the baby-boomer generation retires: demographic change is forecast to reduce rates by a further 37 bp by 2050.

Note: Staff Working Papers describe research in progress by the author(s) and are published to elicit comments and to further debate. Any views expressed are solely those of the author(s) and so cannot be taken to represent those of the Bank of England or to state Bank of England policy. This paper should therefore not be reported as representing the views of the Bank of England or members of the Monetary Policy Committee, Financial Policy Committee or Prudential Regulation Committee.

Bad data collection means we don’t know how much the middle class is being squeezed by the wealthy

From The Conversation.

Australia is falling behind other nations and international bodies in measuring inequality, particularly the concentration of wealth. This also means we are in the dark about the trends affecting Australia’s middle class.

The main source of local data is the Australian Bureau of Statistics (ABS), which publishes a Survey of Income and Housing every two years. The survey provides no information on the wealth of Australia’s top 10%, let alone the top 1% or the top 0.1%. Nor does it quantify the bottom 50%.

The ABS also publishes an index known as the “Gini coefficient”, but as the recent World Inequality Report points out, this indicator can produce the same score for radically different distributions of wealth and downplays the distribution’s top end.

Studying the different groups (such as the top 10%, the middle 40% and the bottom 50%) has become standard in the flourishing international literature on inequality. It has also been embraced by international agencies such as the Organisation for Economic Co-operation and Development (OECD), the International Monetary Fund, the World Bank and increasingly, the United Nations.

As a sign of how far Australia has slipped behind, when we reported on wealth inequality in 2016, we had to draw on data for the top 10% that the ABS had supplied to the OECD but which were not published here in Australia.

Why looking at the middle class matters

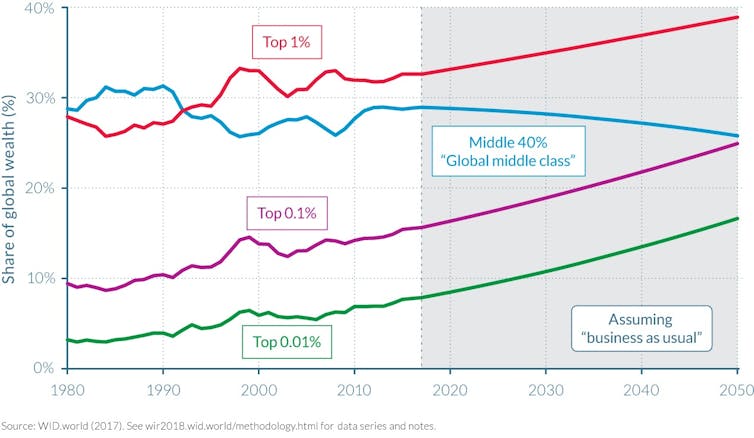
The World Inequality Report finds that the share of the world’s wealth owned by the richest 10% of adult individuals is now over 70%. Meanwhile the poorest 50% of people owns under 2% of the total wealth. This is extreme economic inequality.

Changes in recent decades have been driven by a surge in wealth accumulation at the very top of the distribution. Worldwide, the wealthiest 1% now owns 33% of the total, up from 28% in 1980. In the United States, the top 1% share has risen from a little over 20% to almost 40%.

This is not a simple story of growing extremities between the global rich and poor. On the contrary, the wealth-share of the bottom 50% has barely changed since 1980.

This means the rise in the top share has come at the expense of that held by the middle class, defined as the 40% of people whose wealth-share lies between the median and the top 10%.

This middle-class squeeze is a long-established trend. The wealth of the top 1% exceeded that of the middle class in the early 1990s, and is projected to reach almost 40% by 2050.

Most gains have accrued to the top 0.1%, a tiny elite whose wealth is projected to equal that of the middle class around the same year. This crossing point has already been reached in the United States, where the top 0.1% now has about the same wealth-share as the bottom 90%.

The squeezed global wealth middle class, 1980-2050

Facundo Alvaredo, Lucas Chancel, Thomas Piketty, Emmanuel Saez and Gabriel Zucman, _World Inequality Report 2018, World Inequality Lab. 2017, Figure E9, p. 13

Better data collection

There is a glaring need to reform Australia’s archaic wealth inequality statistics to make them commensurate with international practice. The political implications are significant.

If there is a squeeze on middle-class wealth, as is happening in many other countries, it is likely to create greater political volatility. Access to more and better data is the key to understanding the trends, and will help ground debate, deliberations and policy decisions. The ABS’ household survey needs to be restructured and integrated with the national accounts and, ideally, tax data.

Perhaps the current Australian government, responsible for funding the ABS, is unconcerned. In that case, it is worth remembering that the ABS is charged with servicing both the Commonwealth and the states, most of whom transferred their statistical agencies to the national body in the 1950s on the understanding that their data requirements would continue to be met. The limitations in the existing data hinder the ability of the states to frame policies for their vital housing, education and health services.

The Council of Australian Governments could be a suitable forum to advance reform, particularly in the event of continued federal inertia. Alternatively, given the revolutionary advances in data collection since the 1950s, it might be feasible for the states to again think about establishing their own statistical agencies to ensure their needs – which is to say, our needs – are properly met.

Authors:Christopher Sheil, Visiting Fellow in History, UNSW; Frank Stilwell, Emeritus Professor, Department of Political Economy, University of Sydney

Digital Drives US Consumer Remote Payments Higher

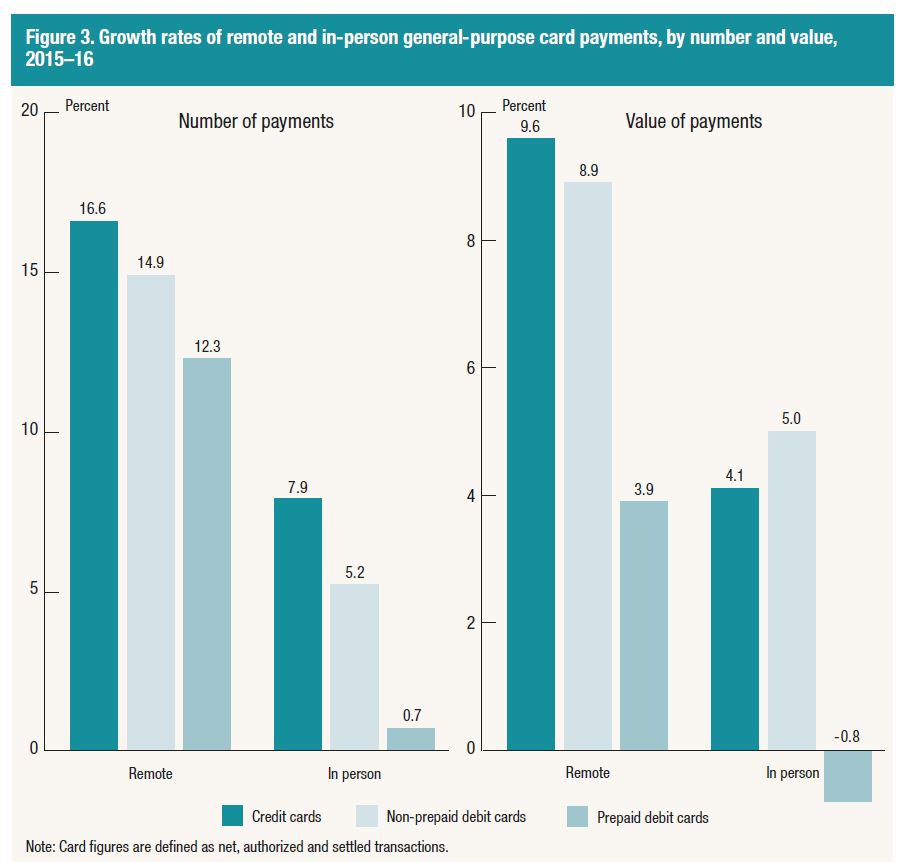
US consumers are making more “remote” payments according to new payments data collected by the Federal Reserve. Remote general-purpose credit card payments, including online shopping and bill pay; all enabled by digital.

The number of credit card payments grew 10.2 percent in 2016 to 37.3 billion with a total value of $3.27 trillion. The increase in the number of payments compares with an 8.1 percent annual rate from 2012 to 2015 and was boosted by continued strong growth in the number of payments made remotely. Remote general-purpose credit card payments, including online shopping and bill pay, rose at a rate of 16.6 percent in 2016. More broadly, remote payments in 2016 represented 22.2 percent of all general-purpose credit and prepaid debit card payments, up 1.5 percentage points from an estimated 20.7 percent in 2015. By value, remote payments represented 44.0 percent of all general-purpose card payments, a slight increase from an estimated 42.9 percent in 2015.

The 2016 data on trends in card payments, as well as Automated Clearing House (ACH) transactions and checks, are the product of a new annual collection effort that will supplement the Federal Reserve’s triennial payments studies. Information released today compares the annual growth rates for noncash payments between 2015 and 2016 with estimates from previous studies.

Key findings include:

  • Total U.S. card payments reached 111.1 billion in 2016, reflecting 7.4 percent growth since 2015. The value of card payments grew by 5.8 percent and totaled $5.98 trillion in 2016. Growth rates by number and value were each down slightly from the rates recorded from 2012 to 2015.
  • Debit card payment growth slowed by number and value from 2015 to 2016 as compared with 2012 to 2015, growing 6.0 percent by number and 5.3 percent by value compared with a previous annual growth rate of 7.2 percent by number and 6.9 percent by value.
  • Use of computer microchips for in-person general-purpose card payments increased notably from 2015 to 2016, reflecting the coordinated effort to place the technology in cards and card-accepting terminals. By 2016, 19.1 percent of all in-person general-purpose card payments were made by chip (26.9 percent by value), compared with only 2.0 percent (3.4 percent by value) in 2015.
  • Data also reveal a shift in the value of payments fraud using general-purpose cards from predominantly in person, estimated at 53.8 percent in 2015, to predominantly remote, estimated at 58.5 percent in 2016. This shift can also be attributed, in part, to the reduction in counterfeit card fraud, the sort of fraud that cards and card-accepting terminals using computer chips instead of magnetic stripes help to prevent.
  • From 2012 to 2015, ACH network transfers, representing payments over the ACH network, grew at annual rates of 4.9 percent by number and 4.1 percent by value. Growth in both of these measures increased for the 2015 to 2016 period, rising to 5.3 percent by number and 5.1 percent by value. The average value of an ACH network transfer decreased slightly from $2,159 in 2015 to $2,156 in 2016.
  • Data from the largest depository institutions show the number of commercial checks paid, which excludes Treasury checks and postal money orders, declined 3.6 percent between 2015 and 2016. By value, commercial checks are estimated to have declined 3.7 percent during the same period. The steeper decline in value versus volume suggests the average value of a commercial check paid has declined slightly since 2015.

Australia’s Budget Update Reinforces Improving Outlook

From Fitch Ratings.

Australia’s Mid-Year Economic and Fiscal Outlook (MYEFO) released on 18 December highlights a modest improvement in the fiscal outlook, largely reflecting a boost in tax collections, including from higher corporate profits in the mining sector. Fitch Ratings expects the gross public debt ratio to peak in 2018 and the fiscal balance to be brought into a surplus by 2021, which is consistent with our ‘AAA’/Stable sovereign rating on Australia. Nevertheless, the rise in public debt over the last decade has eroded the sovereign’s buffer against economic shocks.

The government’s MYEFO forecasts an underlying cash deficit of 1.3% of GDP in the fiscal year ending June 2018 (FY18), slightly smaller than the 1.6% projected in the May 2017 budget. Moreover, the cumulative deficit through FY22 is now forecast to be AUD9.3 billion lower than in May, with AUD5.8 billion of that improvement expected to come in FY18.

Fitch still expects the deficit to shrink at a slower pace than forecast in the MYEFO, largely owing to our less upbeat forecasts for real GDP growth and commodity prices. The economy should be supported by buoyant employment growth, the fading drag from mining investment and improved non-mining investment prospects. However, weak wage growth will weigh on household consumption, while slowing growth in China is likely to constrain commodity price rises and Australia’s export growth.

The government has revised down its growth forecast for FY18 to 2.50%, from 2.75%, but still expects a rebound to 3.00% in FY19 and for growth to remain at that rate until FY22. That compares with our growth expectations of 2.4% in 2017 and 2.7%-2.8% in the following years.

Australia’s economy and fiscal performance are vulnerable to negative global economic developments, particularly a sharper-than-Fitch-expects slowdown in China or drop in commodity prices. Risks might also stem from a faster-than-expected rise in US interest rates, which could lift borrowing costs and pressure domestic liquidity conditions, given the banking system’s reliance on international wholesale funding. High household debt levels could make the economy especially sensitive to rising rates.

The sovereign’s buffer against economic shocks has diminished over the last decade, as debt ratios have increased. General government gross debt was less than 10% of GDP in 2007, but it is likely to peak next year at close to the median public debt-to-GDP ratio for ‘AAA’ sovereigns of 42%. That said, the flexible exchange rate and credible monetary policy framework should help cushion the economy against external volatility.

People on low incomes are sacrificing basic goods to take out insurance

From The Conversation.

[Insurance] is the one thing I will not skimp on, because we don’t know what’s around the corner with my husband being unwell and a disabled son. And now I’ve hurt my foot. I mean, accidents happen. I don’t know what’s around the corner. That’s the first thing that gets paid.

Maggie (all names in this article are psuedonyms), is a single woman in her 50s who lives with her husband and son with disability. She feels health insurance is essential to prepare for seemingly inevitable risks.

To afford insurance, Maggie cuts down on expenses by not buying clothes; she gets free clothes from charity organisations. She also saves money by only purchasing the cheapest marked-down foods that will expire soon and avoiding public transport to save money. And when things are tight she skips meals to make do.

Some people on low incomes put insurance cover first – even if it means doing without basic goods, our research finds. Yet low-income households are the most likely to lack private insurance cover.

Insecure work, low and unstable incomes, and increasingly haphazard and unreliable social protections in education, health, transport and housing continue to make the lives of low-income households risky. Insurance can mitigate some of the harms low-income people face.

To understand how households with low or precarious incomes manage short and longer-term risks, we surveyed 70 people in three areas of suburban Melbourne that experience high levels of financial insecurity. We asked questions about household income and expenditure and how they coped with unexpected expenses.

We found that in order to pay for insurance people were cutting down on heating, food and outings.

Weighing up the odds

The financial problems faced by people on a low income are often explained by poor financial skills, knowledge and behaviours. Yet our research shows that low-income households are also constrained by uncertain and inadequate incomes, unaffordable housing and unexpected high energy costs.

Some of the people we surveyed weighed up their risk of serious incidents and went without insurance because the everyday risks they experienced were more pressing than potential future risks.

Ted, a single man in his fifties receiving the Newstart Allowance, would have liked to have insurance but explained that it was:

just cost prohibitive. I’d rather try and get a roof over my head…than being insured should something happen down the track.

Malcolm, a casually employed factory worker also receiving the Newstart Allowance, said his car was “not worth insuring” for property damage, even though not having insurance exposed him to risk if he damaged another person’s car.

It’s a financial balancing act. Most things that could get damaged on my car I could fix myself…It’s just unnecessary for me. And if it gets written off, it gets written off, and I move on.

Mending the safety net to reduce avoidable risks

Increasingly, private insurance is filling the gaps left by government policies. Instead of enduring the indignities of income support, people are encouraged to take out income protection insurance.

Private health insurance is promoted as a way of avoiding the queue for health care. Inadequate public transport means an increased reliance on private transport – with all the risks and costs that entails.

Insurance providers are aware of the increased risks of inequality. The data insurance companies gather provides fine grained information about the nature of risks to which individuals and insurance companies are exposed.

Research commissioned by the Actuaries Institute notes that because of this data gathering, a growing proportion of the population will be deemed so risky that the price of insurance will become too great for them.

Poor people who already lead risky lives will then be faced with even more risk. The Actuaries Institute report argues that there will be a greater need for government subsidised compulsory insurance to protect those who are exposed to risk beyond their control. But greater access to insurance isn’t the only answer.

Our research suggests that investment in the social safety net could reduce some of the avoidable risks that come with poverty. The government should be ensuring low-income households have access to adequate, predictable income; affordable, quality housing, accessible, affordable public transport and health care. All of these things reduce risks for individuals and contribute to a less divided and risky society.

Authors: Dina Bowman, Principal Research Fellow, Research & Policy Centre, Brotherhood of St Laurence and Honorary Senior Fellow, University of Melbourne; Marcus Banks, Senior Research Fellow, Work & Economic Security, Research & Policy Centre, Brotherhood of St Laurence. Social policy and consumer finance researcher, School of Economics, Finance and Marketing, RMIT University

Australian Property A Target For Money Laundering

An OECD report “Implementing The OECD Anti-Bribery Convention” was released this week and focused on Australia. This is part of the OECD Working Group on Bribery. Real Estate is in the spotlight, because sources in the banking and accounting sectors are warning that Australian real estate is at “significant risk” of being used for money laundering.

Among a raft of recommendations, is one saying Australia should be:

Taking urgent steps to address the risk that the proceeds of foreign bribery could be laundered through the Australian real estate sector. These should include specific measures to ensure that, in line with the FATF standards, the Australian financial system is not the sole gatekeeper for such transaction.

Here is a summary from The Adviser:

“Australia has stepped up its enforcement of foreign bribery since 2012, when the OECD Working Group on Bribery last evaluated Australia’s implementation of the OECD Anti-Bribery Convention, with seven convictions in two cases and 19 ongoing investigations,” the OECD said.

“However, in view of the level of exports and outward investment by Australian companies in jurisdictions and sectors at high risk for corruption, Australia must continue to increase its level of enforcement.”

The OECD report highlighted that one possible means of improving detection is through an increased focus on the proceeds of crime in financial flows back into Australia, particularly those involving the residential real estate sector.

It noted that Aussie property is “very attractive to foreign investors and is at ‘significant risk’ for money laundering”, according to a number of sources, including the 2015 Financial Action Task Force (FATF) Mutual Evaluation Report of Australia.

“Several participants at the onsite from civil society and the private sector also highlighted the significant risk of laundering foreign corrupt proceeds in the Australian real estate sector, including representatives from civil society, the banking sector and an international accounting and auditing firm.”

The review team noted the views of J.C. Sharman, an Australian academic and international AML/CFT and anti-corruption expert, on the Australian AML/CFT system’s failure to counter the flow of corrupt proceeds from abroad into the Australian real estate sector.

According to the report, Professor Sharman attributes the gap to a “lack of willingness” to take action rather than a lack of capacity, stating that Australia has some of the most powerful AML/CFT laws in the world.

He provides several examples where banks or AML/CFT authorities have failed to act on suspicious payments, and information from interviews with Australian bankers that believed the Commonwealth Government did not take seriously enough the issue of inward flows of corrupt proceeds.

Under Australian law, real estate agents, accountants and auditors, members of the legal profession and other Designated Non-Financial Business Professionals (DNFBPs) are not subject to AML/CFT obligations.

However, the OECD noted that Australia is currently considering the expansion of AML/CFT reporting obligations to real estate agents, lawyers, conveyancers, accountants, high-value dealers and trust and company service providers.

“This follows a statutory review of the AML/CFT regime (completed in April 2016), which recommended a cost-benefit analysis be undertaken (completed in June 2017),” the report said.

“The government is currently considering the report, which will inform any decision about the regulation of these sectors for AML/CFT purposes.”

FIRB to play a bigger role

The OECD believes that Australia’s Foreign Investment Review Board (FIRB) could potentially play a greater role in detecting and reporting suspicious transactions in the real estate sector, and leverage available information from the ATO, AUSTRAC and AFP to act on suspicious transactions relating to foreign investments.

The report explained: “Pursuant to the applicable legislative framework, the Treasurer is empowered to prohibit a foreign purchase of Australian property if satisfied that it would be contrary to the national interest, which includes considerations such as national security, competition, impact on the economy and character of the investor.

“The FIRB routinely consults with government agencies, including ASIC, AFP and Immigration and Border Protection, about applications. The ATO also meets regularly with these agencies to ensure that a cohesive, whole of government approach, is maintained.”

ABA Floats New Banking Code

The ABA says that after hundreds of hours of development and more than 50 meetings with banks and key stakeholders over the past nine months, the new Banking Code of Practice has been sent to ASIC for approval.

The Australian Bankers’ Association CEO, Anna Bligh, said this is a huge step for the industry which has voluntarily introduced a new simplified, customer focused code.

“Banks are committed to change and the new Code is stronger, broader and written in simple to understand language. It has been completely rewritten to better meet community expectations and service the needs of customers,” she said.

“The industry has achieved the ambitious task of developing a new Code only nine months after receiving the final report from independent reviewer Mr Phil Khoury.

“The new Code has been broken into ten key parts, with four brand new sections including one dedicated to small businesses and another related to making banking more available for customers and easier to access.

“The remaining six sections represent a complete restructure of important parts of the current Code,” Ms Bligh said.

Some of the changes that Australians can expect in the new Code are more transparency around products and services, and a more prominent commitment to ethical behaviour.

This includes a new deferred sales model for consumer credit insurance on credit cards, small business contracts written in plain English, and the right to close a credit card account online. In addition, customers will be notified before their introductory credit card interest free period expires, the banks will introduce ways to proactively identify customers who may be experiencing financial difficulty and implement better safety nets for guarantors.

“The new code means we are making banking easier, by making changes to processes, providing customers with more info and introducing higher standards for how banks serve their customers.

“This new set of rules and behaviours will go a long way in addressing the expectations that Australians have of their banks.

“Banks most certainly do not underestimate the challenge ahead of them and will continue to make the necessary changes and improvements that their customers expect.

The fact that the industry has accepted 96 of the 99 recommendations in some form is proof that banks are serious about change, and are currently undergoing the greatest level of reform seen in the sector in more than 20 years.

“Banks value their customers and the new Code is one more step towards providing better banking for all Australians,” Ms Bligh said.

The Code is the first industry code to be sent to ASIC for approval and was part of major industry initiatives announced in April 2016 to raise banking standards.

WHAT’S IN THE NEW CODE FOR YOU?

For individuals

  • Customers will be informed when a bank reports any payment default on a loan to a credit reporting body, making it easier for customers to manage their finances.
  • On request, customers will be provided with a list of direct debits and recurring payments made on accounts. This can go back as far as 13 months and can assist customers with managing their accounts, avoiding dishonour fees and with switching.
  • Improved transparency around fee disclosure by telling customers, where practical, about transaction service fees immediately before they incur the fee, helping customers better manage their costs.
  • Waiving or refunding statement fees for customers who do not have access to electronic statements.

For small businesses

  • Small business customers will be provided with a longer notice period about changes to loan conditions or a bank’s decision on whether it will continue to provide the loan facility, which will help businesses with future planning.
  • Simplified loan contracts that are written in plain English and are easier to understand.
  • Improved communication and greater transparency by banks in the use of external property valuers, investigative accountants and insolvency practitioners.

For guarantors

  • Ensuring that guarantors are making an informed decision after taking time to consider the guarantee documents. Guarantors, who have not received legal advice, will be required to wait three days before signing, which may help customers avoid financial abuse.
  • Guarantors will be notified of changes to the borrower’s circumstances, including if they are experiencing financial difficulty.