We review the latest BIS stats on debt to GDP and debt servicing ratios. How is Australia tracking?
Tag: BIS
Households Hold All The Wrong Records…
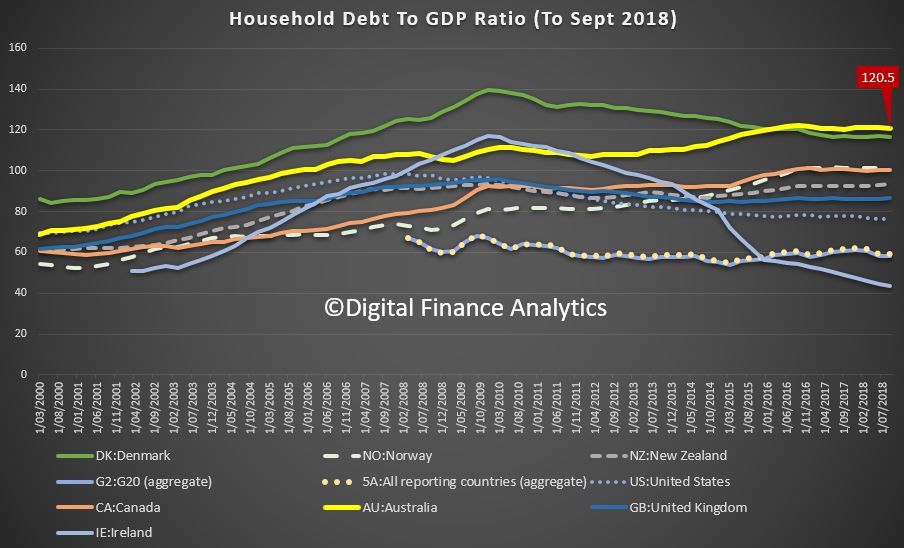
The BIS have released their latest comparative stats for household debt to GDP and household debt servicing ratios. And congratulations Australia, we headed the list with the highest debt servicing ratios in their series, and the second highest debt to GDP. Both alarming.
Looking at the household debt to GDP ratios first, to June 2019, the average across advanced economies is 72.8. This gives a proxy for how easily households will be able to service and repay their loans, the lower the less risk there is.
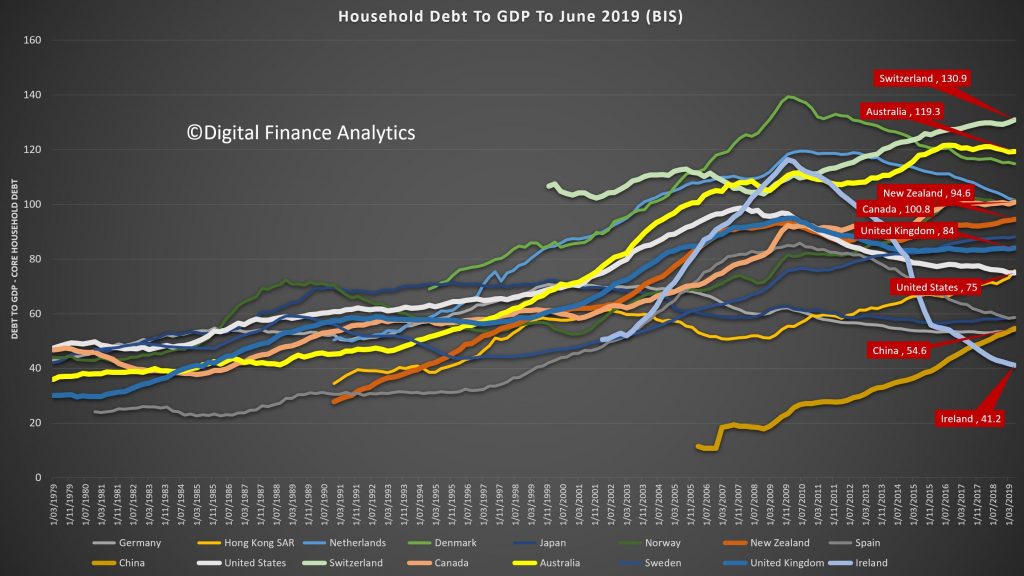
The United States is a little above the average at 75, the UK, at 84, Near Zealand stands at 94.6, similar to Canada, while Australia comes in at 119.3 and Switzerland leads the pack at 130.9.
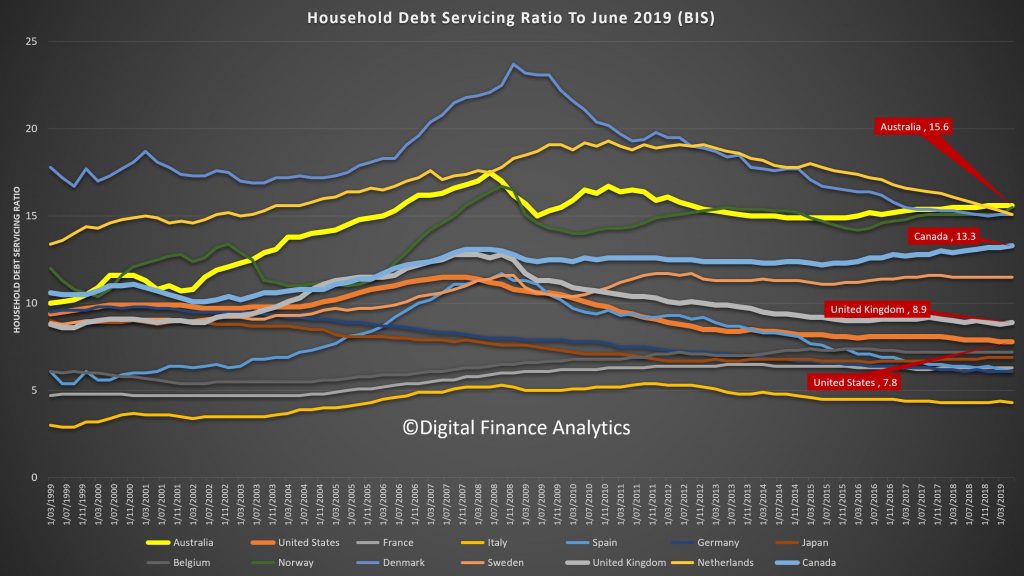
On the debt servicing ratios, we have taken first spot, at 15.6, with Canada at 13.3, the UK 8.9 and the US 7.8. The DSR is the average of income required to service a loan. So, the lower the better. Note this is across ALL households whether they borrow or not, so it takes account of the amount being repaid and the proportion borrowing. Note also the the Australian data has risen from 2014, despite rate cuts.
Conclusion, Australians is over leveraged, and mainly into property.
BIS Says US Repo Hiccup Was Structural; Risks Remain
The BIS has released their quarterly update. It comprises a review of market developments over the past quarter, and special features that analyse topical economic and financial issues.
Overall, they say that easing trade tensions in mid-October triggered a risk-on phase in global financial markets. Equity prices rallied, reaching new highs in the United States in November. At the same time, credit spreads tightened, and yields on safe sovereign bonds edged higher. Nevertheless, the economic outlook remained tepid and inflation low, leading central banks to ease further.
The renewed risk appetite, coupled with loose financial conditions, sparked questions about the sustainability of asset valuations. Investors’ compensation for bearing risk seems to hinge on the term premium; to the extent that the premium is unusually low, it may flatter valuations.
Claudio Borio, Head of the BIS Monetary and Economic Department, commented: “Rather stretched asset valuations, high risk-taking and hard-to-read changes in the financial system: the mixture points to certain vulnerabilities in financial markets that merit close attention on the part of market participants and central banks alike.”
They offer specific analysis of the US Repo problem, and highlight a significant structural change as some US major banks become net providers of liquidity.
The mid-September tensions in the US dollar market for repurchase agreements (repos) were highly unusual. Repo rates typically fluctuate in an intraday range of 10 basis points, or at most 20 basis points. On 17 September, the secured overnight funding rate (SOFR) – the new, repo market-based, US dollar overnight reference rate – more than doubled, and the intraday range jumped to about 700 basis points. Intraday volatility in the federal funds rate was also unusually high. The reasons for this dislocation have been extensively debated; explanations include a due date for US corporate taxes and a large settlement of US Treasury securities. Yet none of these temporary factors can fully explain the exceptional jump in repo rates.
This box focuses on the distribution of liquid assets in the US banking system and how it became an underlying structural factor that could have amplified the repo rate reaction. US repo markets currently rely heavily on four banks as marginal lenders. As the composition of their liquid assets became more skewed towards US Treasuries, their ability to supply funding at short notice in repo markets was diminished. At the same time, increased demand for funding from leveraged financial institutions (eg hedge funds) via Treasury repos appears to have compounded the strains of the temporary factors. Finally, the stress may have been amplified in part by hysteresis effects brought about by a long period of abundant reserves, owing to the Federal Reserve’s large-scale asset purchases.
A repo transaction is a short-term (usually overnight) collateralised loan, in which the borrower (of cash) sells a security (typically government bonds as collateral) to the lender, with a commitment to buy it back later at the same price plus interest. Repo markets redistribute liquidity between financial institutions: not only banks (as is the case with the federal funds market), but also insurance companies, asset managers, money market funds and other institutional investors. In so doing, they help other financial markets to function smoothly. Thus, any sustained disruption in this market, with daily turnover in the US market of about $1 trillion, could quickly ripple through the financial system. The freezing-up of repo markets in late 2008 was one of the most damaging aspects of the Great Financial Crisis (GFC).
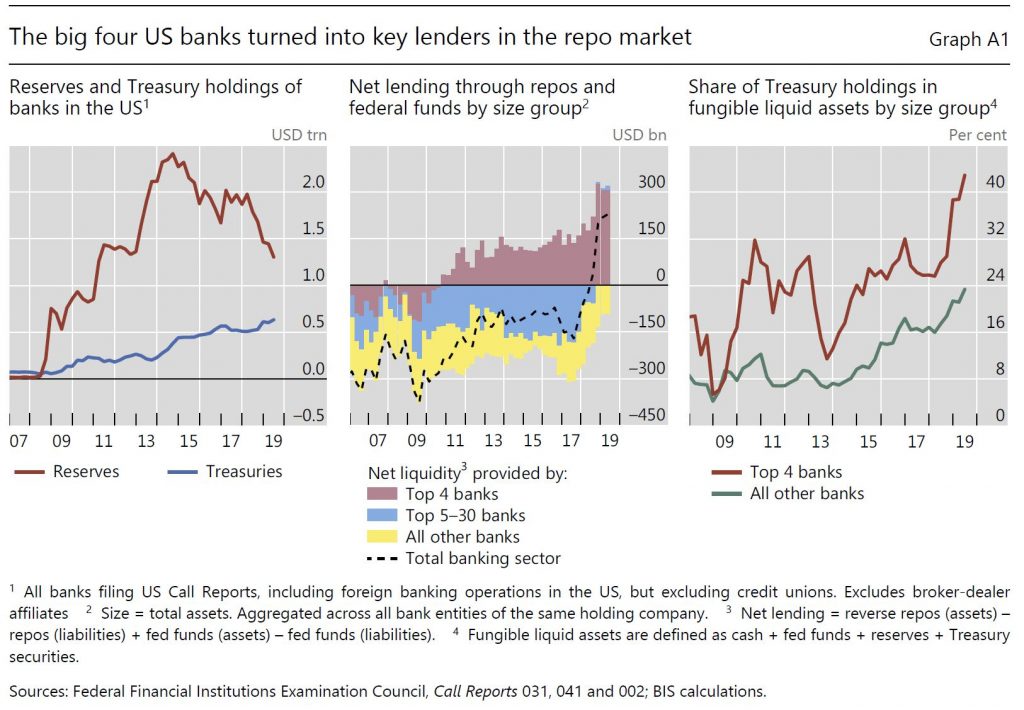
The liquid asset holdings of US banks and their composition have changed significantly since the GFC. Successive rounds of large-scale asset purchases reduced the free float of long-dated US Treasuries available to the market between the end of 2008 and October 2014. On the flip side, banks accumulated large amounts of reserve balances remunerated at the Fed’s interest on excess reserves (IOER) (Graph A.1, left-hand panel, red line). After the Federal Reserve started to run down its balance sheet in October 2017, reserves contracted, quickly but in an orderly way as intended. Alongside, banks’ holdings of US Treasuries increased, almost trebling between end-2013 and the second quarter of 2019 (blue line).
As repo rates started to increase above the IOER from mid-2018 owing to the large issuance of Treasuries, a remarkable shift took place: the US banking system as a whole, hitherto a net provider of collateral, became a net provider of funds to repo markets. The four largest US banks specifically turned into key players: their net lending position (reverse repo assets minus repo liabilities) increased quickly, reaching about $300 billion at end-June 2019 (Graph A.1, centre panel, red bars). At the same time, the next largest 25 banks reduced their demand for repo funding, turning the net repo position of the banking sector positive (centre panel, dashed line). The big four banks appear to have turned into the marginal lender, possibly as other banks do not have the scale and non-bank cash suppliers such as money market funds (MMFs) hit exposure limits (see below).
Concurrent with the growing role of the largest four banks in the repo market, their liquid asset holdings have become increasingly skewed towards US Treasuries, much more so than for the other, smaller banks (Graph A.1, right-hand panel). As of the second quarter of 2019, the big four banks alone accounted for more than 50% of the total Treasury securities held by banks in the United States – the largest 30 banks held about 90% (Graph A.2, left-hand panel). At the same time, the four largest banks held only about 25% of reserves (ie funding that they could supply at short notice in repo markets).
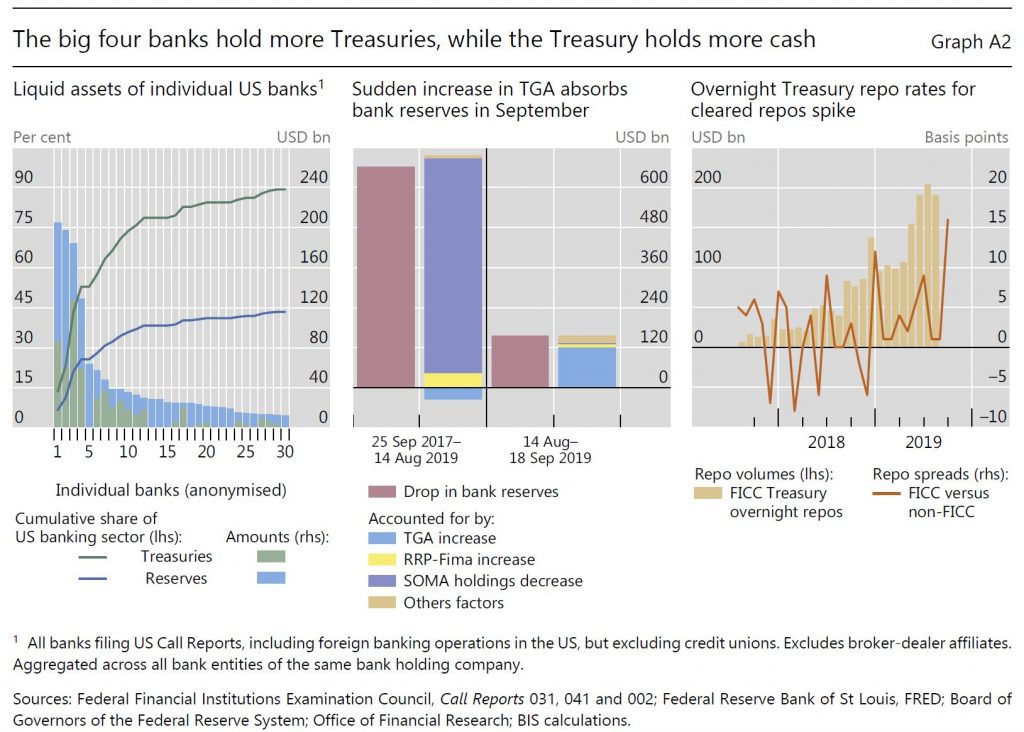
Cash balances held by the US Treasury in its Federal Reserve account (the Treasury General Account, TGA) grew in size and became more volatile, especially after 2015. The resulting drain and swings in reserves are likely to have reduced the cash buffers of the big four banks and their willingness to lend into the repo market. After the debt ceiling was suspended in early August 2019, the US Treasury quickly set out to rebuild its dwindling cash balances, draining more than $120 billion of reserves in the 30 days between 14 August and 17 September alone, and half of this amount in the last week of that period. By comparison, while the Federal Reserve runoff removed about five times this amount, it did so over almost two years (Graph A.2, centre panel).
Besides these shifts in market structure and balance sheet composition, other factors may help to explain why banks did not lend into the repo market, despite attractive profit opportunities. A reduction in money market activity is a natural by-product of central bank balance sheet expansion. If it persists for a prolonged period, it may result in hysteresis effects that hamper market functioning. For instance, the internal processes and knowledge that banks need to ensure prompt and smooth market operations may start to decay. This could take the form of staff inexperience and fewer market-makers, slowing internal processes. Moreover, for regulatory requirements – the liquidity coverage ratio – reserves and Treasuries are high-quality liquid assets (HQLA) of equivalent standing. But in practice, especially when managing internal intraday liquidity needs, banks prefer to keep reserves for their superior availability.
Shifts in repo borrowing and lending by non-bank participants may have also played a role in the repo rate spike. Market commentary suggests that, in preceding quarters, leveraged players (eg hedge funds) were increasing their demand for Treasury repos to fund arbitrage trades between cash bonds and derivatives. Since 2017, MMFs have been lending to a broader range of repo counterparties, including hedge funds, potentially obtaining higher returns. These transactions are cleared by the Fixed Income Clearing Corporation (FICC), with a dealer sponsor (usually a bank or broker-dealer) taking on the credit risk. The resulting remarkable rise in FICC-cleared repos indirectly connected these players. During September, however, quantities dropped and rates rose, suggesting a reluctance, also on the part of MMFs, to lend into these markets (Graph A.2, right-hand panel). Market intelligence suggests MMFs were concerned by potential large redemptions given strong prior inflows. Counterparty exposure limits may have contributed to the drop in quantities, as these repos now account for almost 20% of the total provided by MMFs.
Since 17 September, the Federal Reserve has taken various measures to supply more reserves and alleviate repo market pressures. These operations were expanded in scope to term repos (of two to six weeks) and increased in size and time horizon (at least through January 2020). The Federal Reserve further announced on 11 October the purchase of Treasury bills at an initial pace of $60 billion per month to offset the increase in non-reserve liabilities (eg the TGA). These ongoing operations have calmed markets.
But, I would observe, that structural change remains…
Stablecoins In The Spotlight
The G7 warns against the early deployment of Stablecoins like Libra.
The Real Problem With Low Interest Rates [Podcast]
We review the recent BIS paper which highlights the issues with low interest rates.

The Real Problem With Low Interest Rates
We review the recent BIS paper which highlights the issues with low interest rates.
All About Household Debt – A Property Imperative Weekly Special Edition
We look at the latest stats to compare Australian household debt with a battery of other countries. Not pretty. given the drive to encourage people to borrow yet more….
Time to ignite all engines: BIS
Monetary policy can no longer be the main engine of economic growth, and other policy drivers need to kick in to ensure the global economy achieves sustainable momentum, the Bank for International Settlements (BIS) writes in its Annual Economic Report.
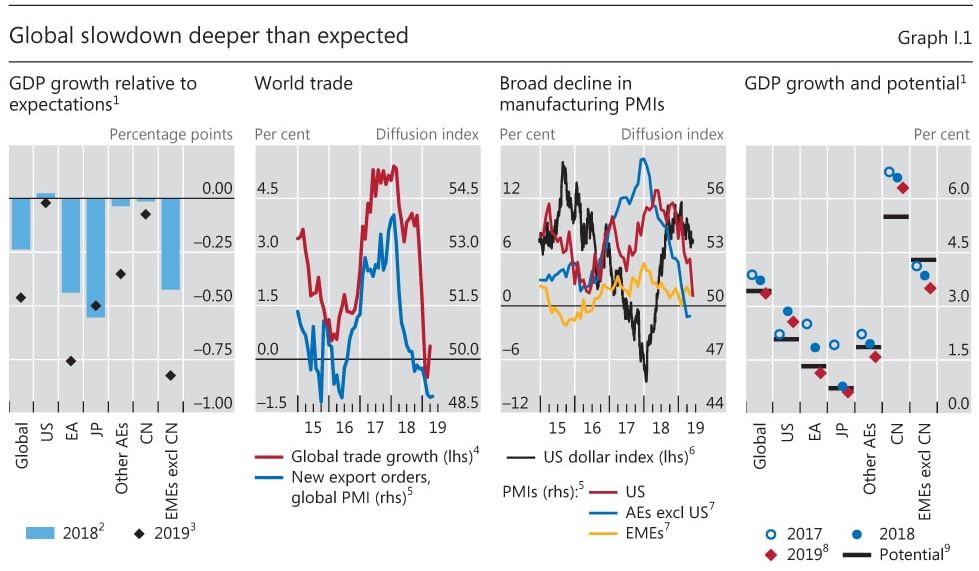
In its flagship economic report, the BIS calls for a better balance between monetary policy, structural reforms, fiscal policy and macroprudential measures. This would allow the global economy to move away from the debt-fuelled growth model that risks turbulence ahead.
“Navigating the way to clearer skies means balancing speed with stability and conserving some fuel to cope with possible headwinds,” says BIS General Manager Agustín Carstens. “A sustainable flight path requires the long-overdue full engagement of all four engines of policy, rather than short-term turbo charges.”
In the report, the BIS says that although global expansion hit a soft patch last year, the resilience of service industries and strong labour markets can support growth in the near term. Employment increases and solid wage rises have sustained consumption. Still, significant risks remain, including trade tensions and rising debt, particularly in the corporate sector in some economies.
“As well as clouding future demand and investment prospects, the trade tensions raise questions about the viability of existing supply chain structures and about the very future of the global trading system,” says Carstens. “Trade wars have no winners.”
Other risks to the outlook include weak bank profits in several advanced economies and deleveraging in some major emerging market economies (EMEs), particularly China. Necessary moves to curb credit growth there act as a drag on activity.
EMEs’ greater sensitivity to global financial conditions and resulting capital flows has meant that, since the financial crisis, they have had to cope with strong spillovers from accommodative monetary policy in advanced economies. One chapter of the report analyses how EME monetary policy frameworks have sought to tackle the resulting trade-offs. The frameworks typically combine inflation targeting with currency intervention, and are complemented with macroprudential measures to address the build-up of financial vulnerabilities.
“This kind of multiple-tool policymaking is not yet very well anchored conceptually. EME monetary policy practice has moved ahead of theory. Theory has to catch up,” says Claudio Borio, Head of the Monetary and Economic Department.
A chapter on big tech and financial services was released on 23 June.
The BIS’s financial results, published at the same time in the Annual Report 2018/19, include a balance sheet total of SDR 291.1 billion (USD 403.7 billion) at end-March 2019 and a net profit of SDR 461.1 million (USD 639.5 million).
Just How Much Trouble Are We In?
We look at the latest data from the BIS on GDP to Debt and Servicing ratios. Where does Australia stand? Data on New Zealand is also included.
Crypto In 2019
We answer one of the the most asked questions on the DFA channel – what is the future for Crypto?
