In the final edition of the Property Imperative Weekly for 2017, we look ahead to 2018 and discuss the future trajectory of the property market, the shape of the mortgage industry, the evolution of banking and the likely state of household finances.
 Watch the video, or read the transcript.
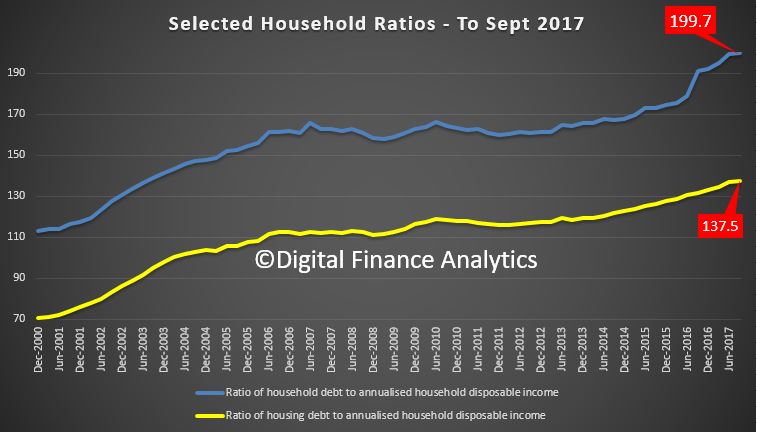
We start with the state of household finances. The latest data from the RBA shows that the ratio of debt to income deteriorated again (no surprise given the 6%+ growth in mortgage debt, and the ~2% income growth). The ratio of total debt to income is now an astronomical 199.7, and housing debt 137.5. Both are at all-time records, and underscores the deep problem we have with high debt.
We think that households will remain under significant debt pressure next year, and the latest data shows that mortgage lending is still growing at 3 times income growth. We doubt that incomes will rise any time soon, and so 2018 will be a year of rising debt, and as a result, more households will get into difficulty and mortgage stress will continue to climb. We think Treasury forecasts of rising household incomes are overblown. On the other hand, the costs of living will rise fast.
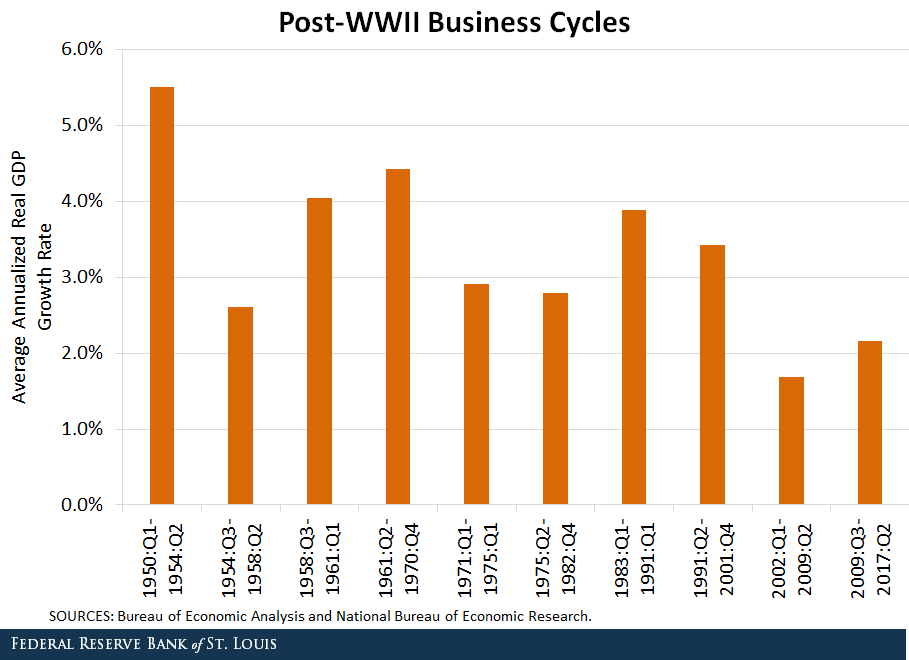
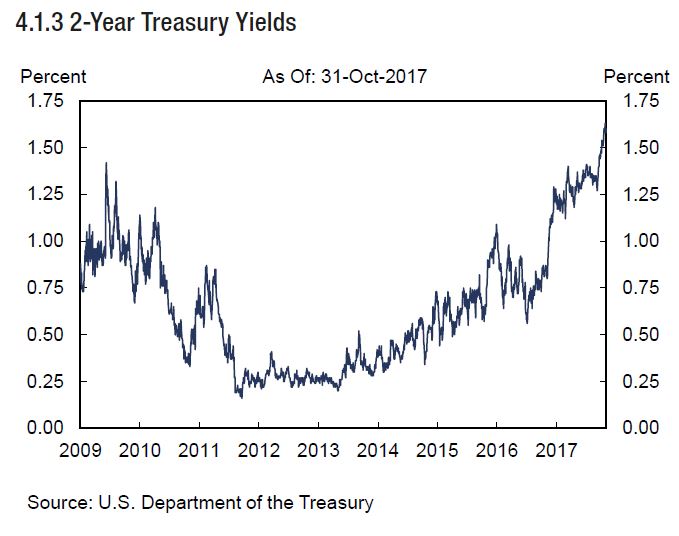
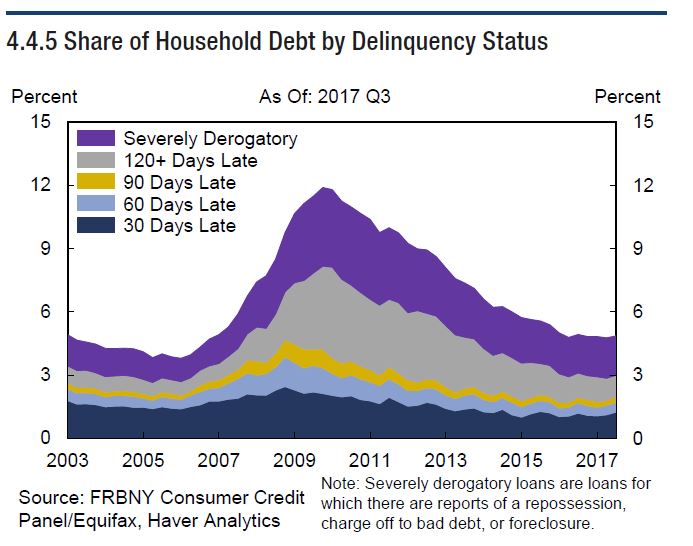
As a result, two things will happen. The first is that mortgage default rates are likely to rise (at current rock bottom interest rates, defaults should be lower), and if rates rise then default rates will climb further. The second outcome is that households will spend less and hunker down. As the Fed showed this week, the US economy is highly dependent on continued household spending to sustain economic growth – and the same is true here. We think many households will hold back on consumption, spending less on discretionary items and luxuries, and so this will be a brake on economic activity. This will have a strong negative influence on future economic growth, which we already saw throughout the Christmas shopping season.
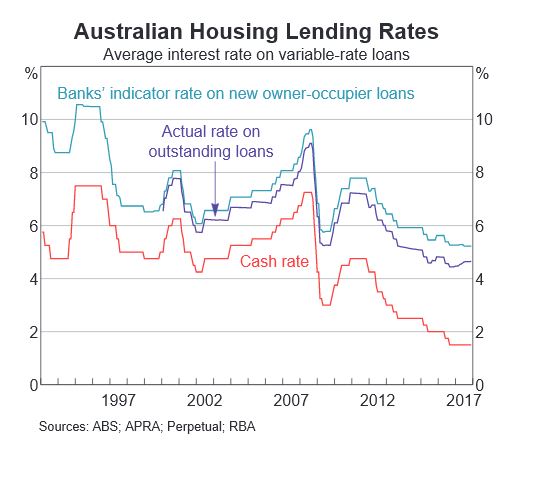
Mortgage interest rates are likely to rise as international markets follow the US higher, lifting bank funding costs. This is separate from any change to the cash rate. This year the RBA was able to sit on its hands as the banks did their rate rises for them. We hold the view that the cash rate will remain stuck it its current rut for the next few months, because the regulators are acutely aware of the impact on households if they were to lift. They have little left in the tank if economic indicators weaken, and the bias will be upward, later in the year.
Competition for new loans will be strong, as banks need mortgages to support their shareholder returns. The latest credit data from the RBA showed that total mortgages are now at a record $1.71 trillion, and investor lending has fallen to an annual rate of 6.5%, compared with owner occupied lending at 6.3%, so total housing lending grew at 6.4%. Business lending is lower, at 4.7% and personal lending down 1.2%.
But APRA’s data shows that banks are writing less new business, so total Owner Occupied Balances are $1.041 trillion, up 0.56% in the month (so still well above income growth), while Investment Loans reached $551 billion, up 0.1%. So overall portfolio growth is now at 0.4%, and continues to slow. In fact, comparing the RBA and APRA figures we see the non-bank sector is taking up the slack, and of course they do not have the current regulatory constraints. The portfolio movements of major lenders show significant variation, with ANZ growing share the most, whilst CBA shrunk their portfolio a little. Westpac and NAB grew their investment loans more than the others.
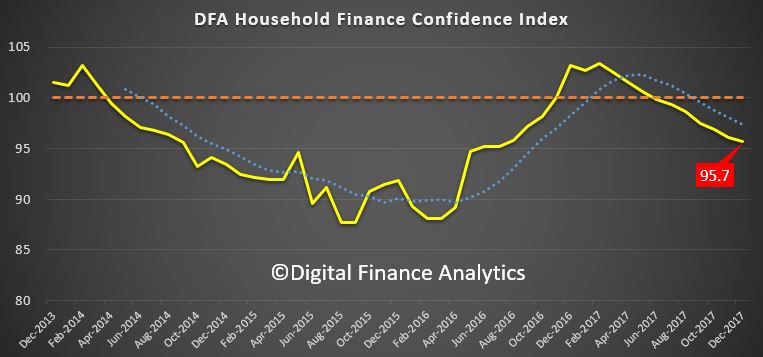
We think there will be desperate attempts to attract new borrowers, with deeply discounted rates, yet at the same time mortgage underwriting standards will continue to tighten. We already see the impact of this in our most recent surveys. The analysis of our December 2017 results shows some significant shifts in sentiment – in summary:
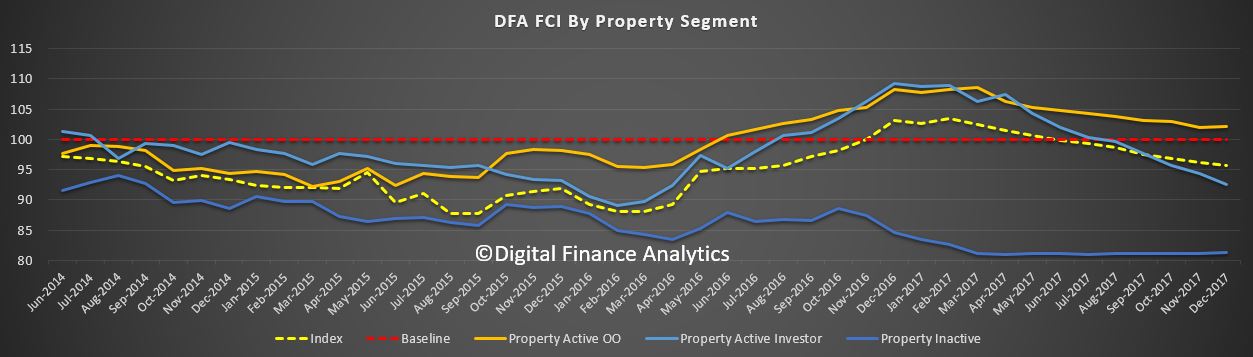
- First, obtaining finance for a mortgage is getting harder – this is especially the case for some property investors, as well as those seeking to buy for the first time; and those seeking to trade up. Clearly the tightening of lending standards is having a dampening effect. As a result, demand for mortgage finance looks set to ease as we go into 2018 and mortgage growth rates therefore will slide below 6%.
- Next, overall expectations of future price gains have moderated significantly, and property investors are now less expectant of future capital growth in particular. This is significant, as the main driver for investors now is simply access to tax breaks. As a result, we expect home prices to drift lower as demand weakens.
- Mortgage rates have moved deferentially for different segments, with first time buyers and low LVR refinance households getting good deals, while investors are paying significantly more. This is causing the market to rotate away from property investors.
- Net rental returns are narrowing, so more investors are underwater, pre-tax. So the question becomes, at what point will they decide to exit the market?

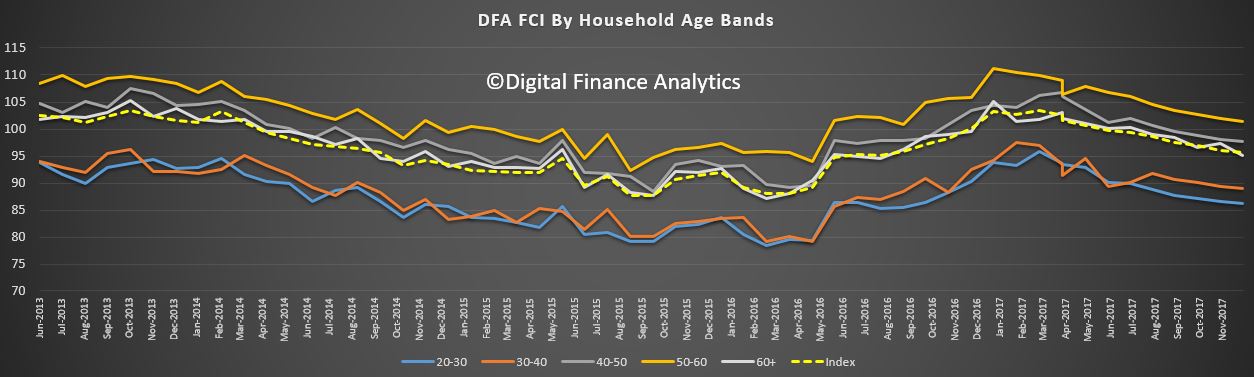
We see a falling expectation of home price rises in the next 12 months, across all the DFA household segments. Property Investors are clearly re-calibrating their views, and this could have a profound impact on the market. We see a significant slide in the proportion of property investors and portfolio investors who are looking to borrow more. First time buyers remain the most committed to saving for a deposit, helped by new first owner grants, while those who desire to buy, but cannot are saving less. Those seeking to Trade Up are most positive of future capital growth. Foreign buyers will be less active in 2018.
So our view is that demand for property will ease, and the volume of sales will slide through 2018. As a result, the recent price falls will likely continue, and indeed may accelerate. We will be watching for the second order impacts as investors decide to cut their losses and sell, creating more downward pressure. Remember the Bank of England suggested that in a down turn, Investment Property owners are four times more likely to exit compared with owner occupied borrowers.
So risks in the sector will grow, and bank losses may increase.
More broadly, banks will remain in the cross-hairs though 2018 as the Royal Commission picks over results from their notice requiring banks, insurance companies and superannuation funds to detail all cases of misconduct from 2008 onwards. We expect more issues will surface. The new banking code which was floated before Christmas is not bad, but is really still setting a low bar and contains elements which most customers would already expect to see. This is not some radical new plan to improve customer experience, rather more recognition of the gap between bank behaviour and customer expectation. And it does not HAVE to be implemented by the banks anyway.
There is much more work to do. For example, how about proactive suggestions to switch to lower rate loans and better rates on deposits? What about the preservation of branch and ATM access? What about the full disclosure of all fees relating to potential loans? And SME’s continue to get a raw deal thanks to lending policy and bank practice (despite the hype).
Then the biggie is mortgage lending policy, where banks current underwriting standards are set to protect the bank from potential loss, rather than customers from over-committing.
We will get to hear about the approach to Open Banking, the Productivity Commission on vertical integration and the ACCC on mortgage pricing, as well as the outcomes from a range of court cases involving poor banking behaviour. APRA will also discuss mortgage risk weights. So 2018 looks like adding more pressure on the banks.
So in summary, we think we will see more of the same, with pressure on households, pressure on banks, and a sliding housing market. Despite this, credit is growing at dangerous levels and regulators will need to tighten further. We are not sure they will, but then the current issues we face have been created by years of poor policy.
Households can help to manage their financials by building a budget to identify their commitments and cash flows. Prospective mortgage borrowers should run their own numbers at 3% above current rates, and not rely on the banks assessment of their ability to repay – remember banks are primarily concerned with their risk of loss, not household budgets or financial sustainability per se. Regulators have a lot more to do here in our view.
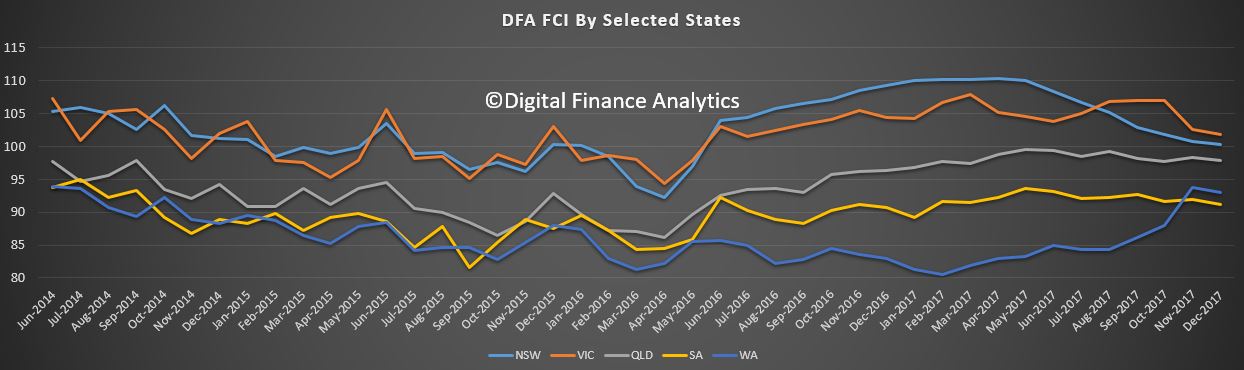
Many will choose to spruke property in 2018 (we are already seeing claims that the Perth market “is turning”), and the construction sector, real estate firms, and banks all have a vested interest in keeping the ball in the air for as long as possible. Governments also do not want to see prices fall on their watch, and many of the states are totally reliant on income from stamp duty. But we have to look beyond this. If we are very luck, then prices will just drift lower; but it could turn into a rout quite easily, and don’t think the authorities have the ability to calibrate or correct a fall if it goes, they do not.
The bottom line is this. Think of property as a place to live, not an investment play. Do that, and suddenly things can get a whole lot more sensible.
That’s the Property Imperative Weekly to 30th December 2017. We will return in the new year with a fresh weekly set of objective news, analysis and opinion. If you found this useful, do leave a comment, or like the post, and subscribe to receive future updates. Best wishes for 2018, and many thanks for watching.

 Next, home loan approvals are on the slide – expect more of this as tighter underwriting standards bite, and many interest only borrowers are forced to switch to higher cost interest and principal loans.
 Home price indices are trending lower (but still net positive growth overall at the moment). Expect more falls in the months ahead.
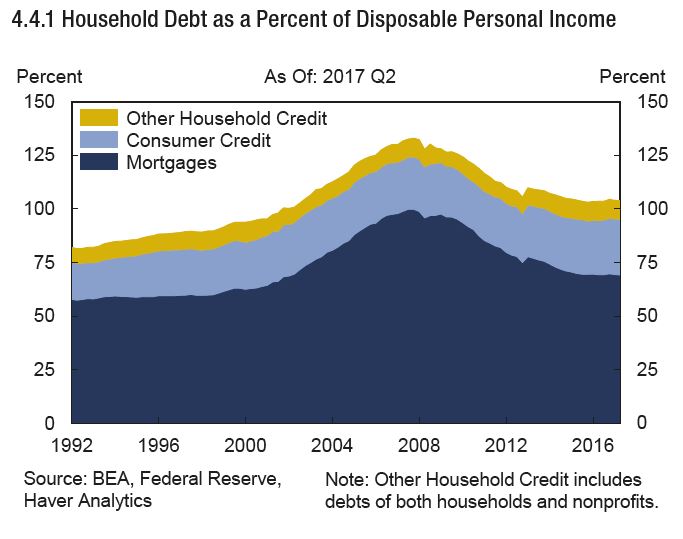
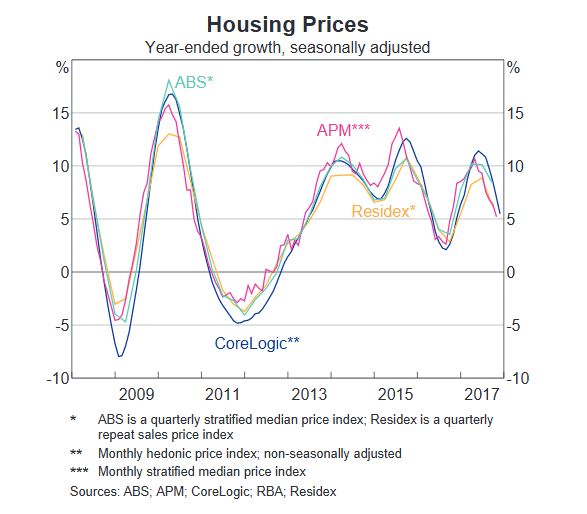 Household debt continues higher. Now double disposable income, and we have some of the most highly in debt households in the world. Lending growth is still three times income, so this is likely to continue higher.
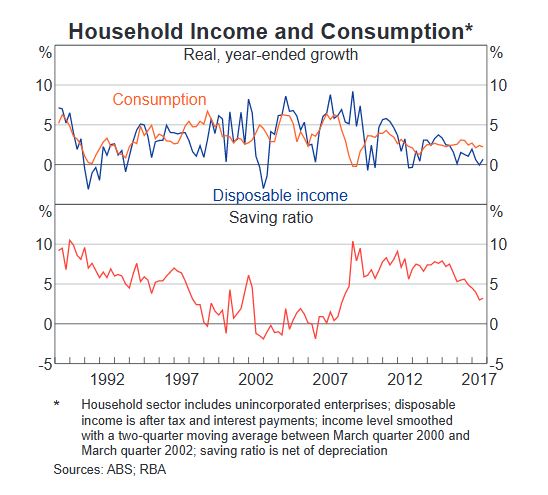
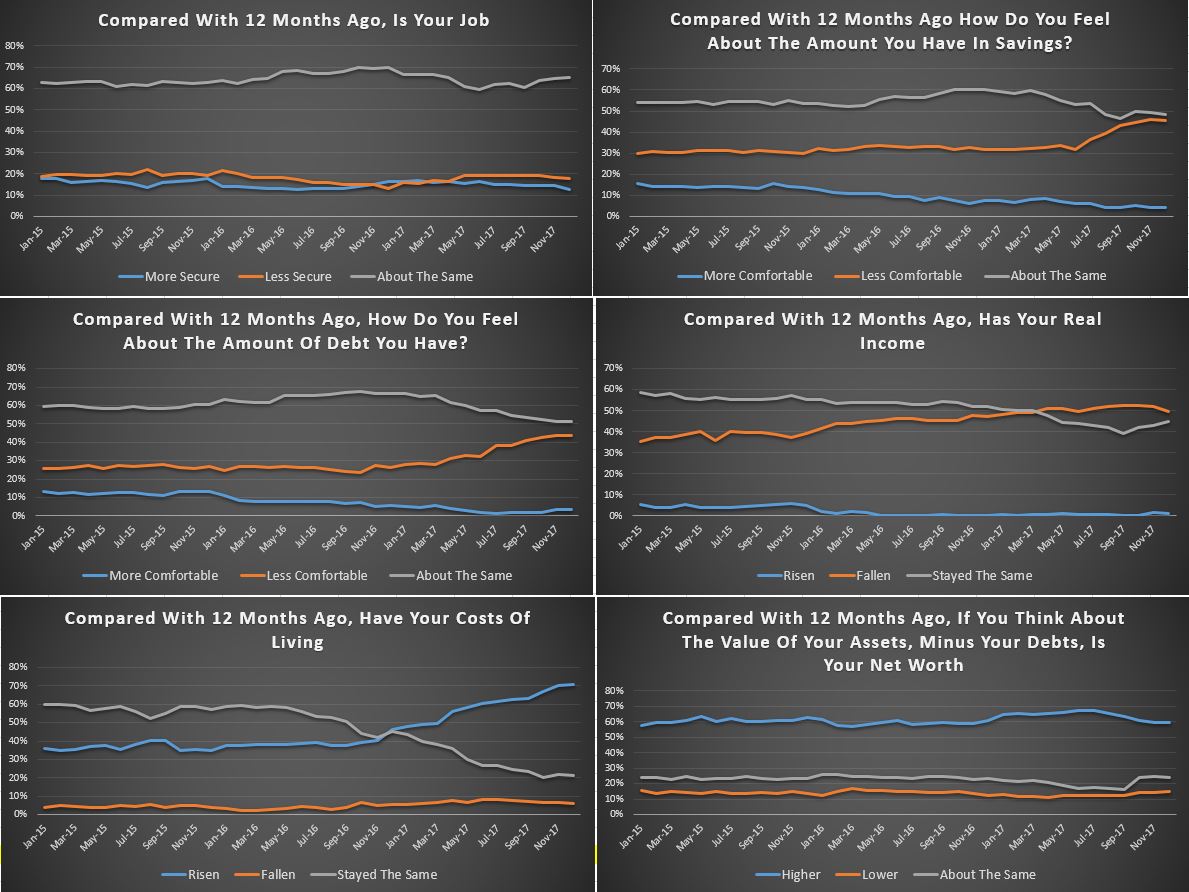
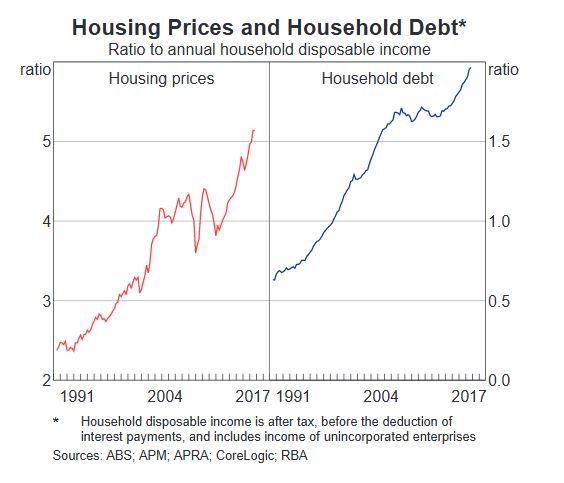 All this is bearing down on household consumption as real income growth stalls. The savings ratio is falling, as households tap these to prop up their finances, OK in the short term, but unsustainable longer term.