We look across the latest stats on credit, the economy, property and rental prices and construction.
Go to the Walk The World Universe at https://walktheworld.com.au/
Digital Finance Analytics (DFA) Blog
"Intelligent Insight"
We look across the latest stats on credit, the economy, property and rental prices and construction.
Go to the Walk The World Universe at https://walktheworld.com.au/
We look at the latest ABS stats for new lending commitments for April 2021. https://www.abs.gov.au/statistics/economy/finance/lending-indicators/apr-2021
Go to the Walk The World Universe at https://walktheworld.com.au/
We examine the latest on loan deferrals, credit aggregates and defaults. What does this mean for home prices and sales?
The latest edition of our finance and property news digest with a distinctively Australian flavour.
Go to the Walk The World Universe at https://walktheworld.com.au/
We update the latest credit aggregates from the RBA, and lending stats and loan deferrals from APRA.

The RBA and APRA released their monthly stats to end June on Friday.
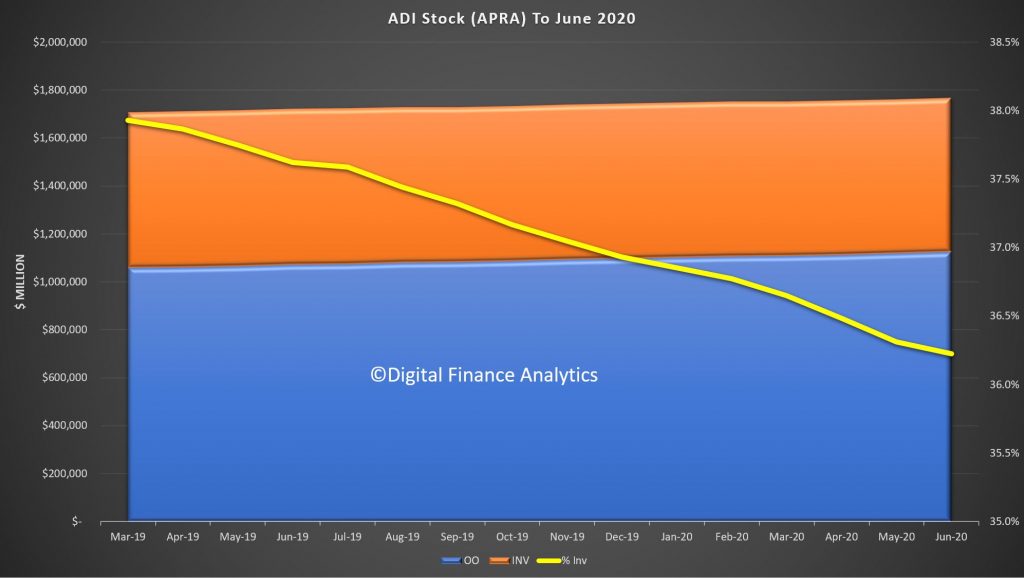
The stock data from APRA, relating to the ADI’s (banks etc.) revealed that total owner occupied housing lending rose 0.57% to $1.12 trillion, while investment lending rose 0.19% to $0.64 trillion. As a result total lending for housing from ADI’s was up 0.43% to $1.76 trillion. A record. Investment lending was 36.2%, dropping again. And remember, around 11% (~$200 billion) of borrowing households are on repayment holidays, so balances are automatically rising as a result. Something which I note few are commenting on.
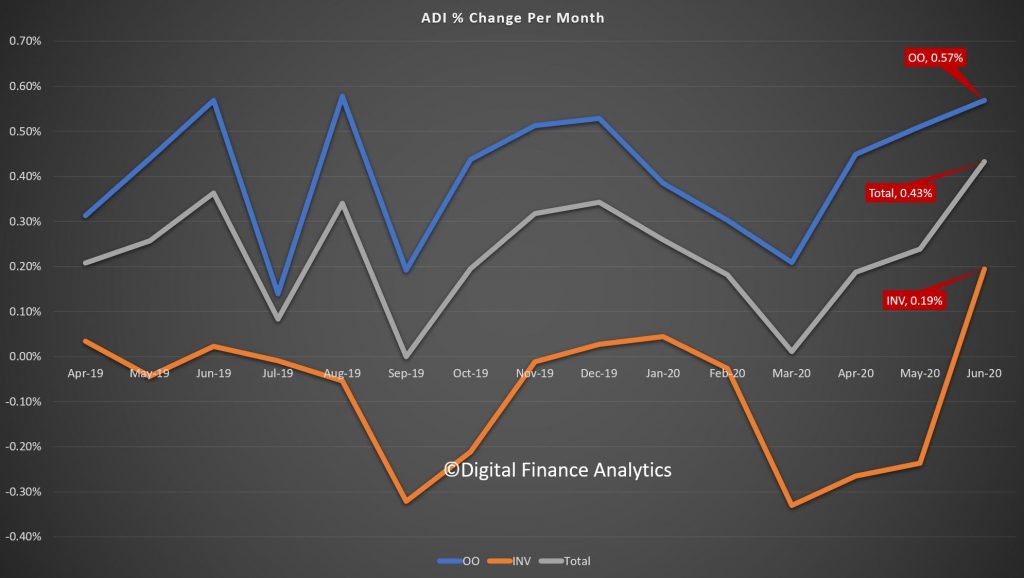
The change over time shows that as the lock downs were eased in June, demand for credit was higher, something which we suspect will be temporary. And of course refinancing is 40% higher, and we know that many drew down additional equity through the transaction. More on that in a later post.
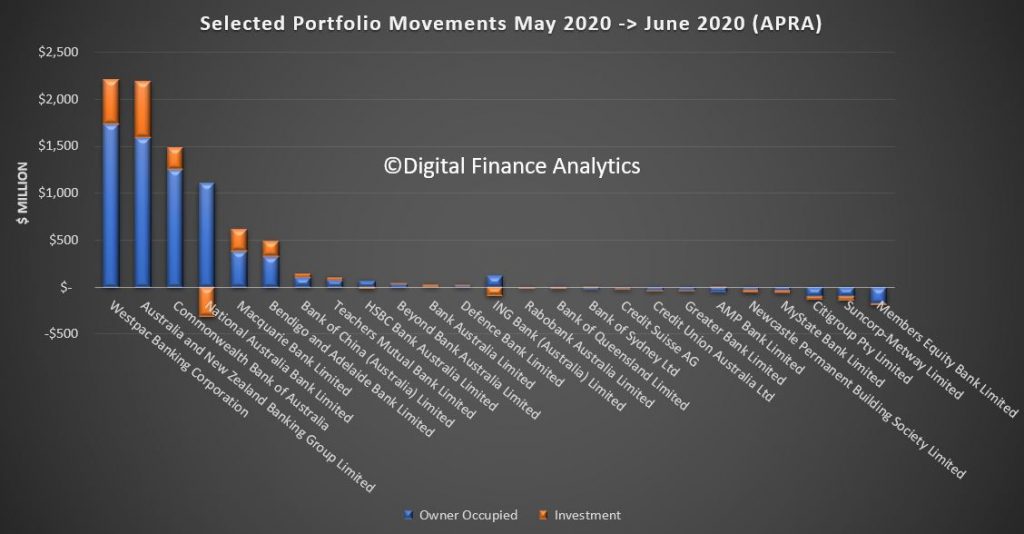
Westpac led the pack according to the bank level data, with growth that matched CBA, although CBA wrote more investor loans. NAB dropped investor loan balances according to the APRA report, while Members Equity and Suncorp dropped both investor and owner occupied balances. The cheap loans offered by the big four makes it hard for smaller players to compete as they fight for market share scraps in a difficult market. The 60 basis point drop in funding, thanks to the RBA, is of course helping to drive rates lower.
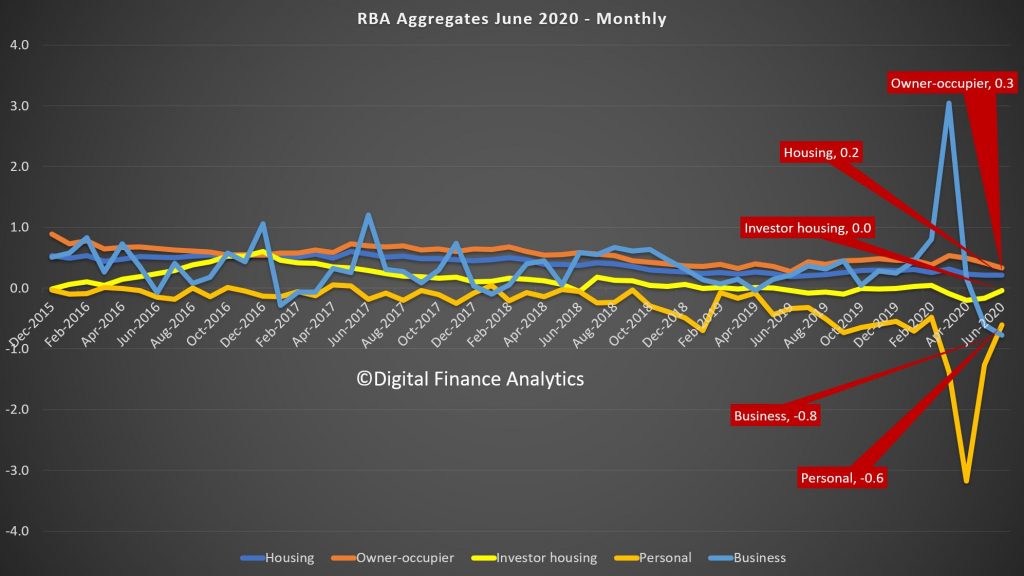
The RBA series, which includes the non-banks shows a somewhat similar story with the monthly housing for owner occupied higher, at 0.3% up, investment lending flat, and total housing up 0.2%. Business lending and personal credit were both lower.
The less noisy annual trends revealed that annualised growth of owner occupied loans is still an amazing 5,4%, while investor lending is down 0.7%, leading to average housing lending at 3.1%. Business credit is 4.8% but that was upped by drawn downs at the start of the virus phase, and is now lower, and personal lending is down 10.5%.
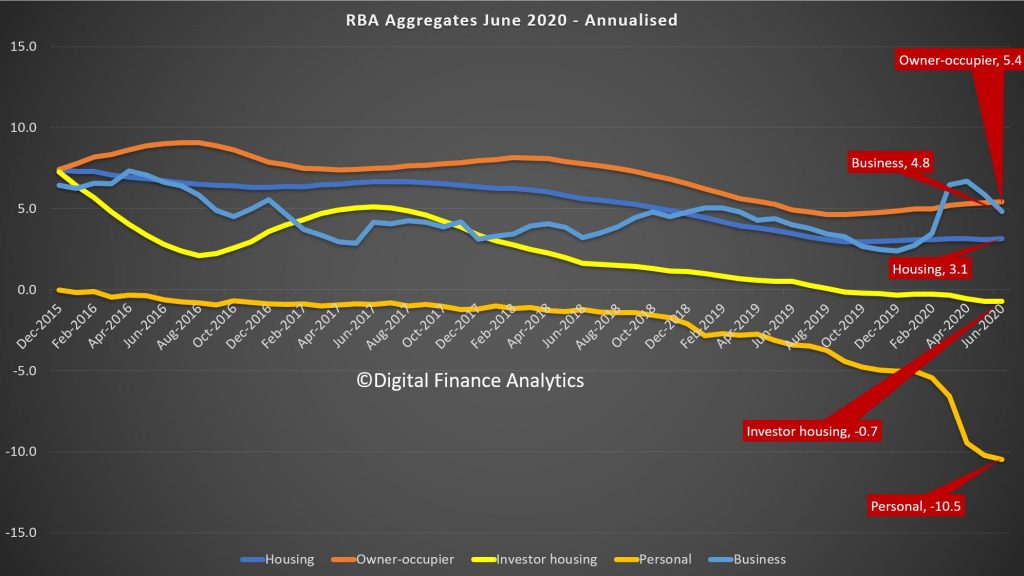
The total credit number was down to 2.9% and we suspect will continue to head south, while the broad money measure was up to 10.2% – thanks to the RBA interventions, JobSeeker, JobKeeper, Super withdrawals, and other stimulus measures. The question now becomes where will the money flow – to drive prices higher as people buy more, or into the financial system to drive stocks and other financial assets higher? One leads to inflation, the other to deflation – I suspect we will follow the Japan route but we will see.

The latest edition of our finance and property news digest with a distinctively Australian flavour.
APRA and the RBA released their May loan numbers yesterday. These are stock numbers, taking account of repayments, refinances and new loans. APRA said that banks increased their overall residential property lending by 0.24%, with owner occupied loans up 0.51% and investor loans down again, this time 0.24%.
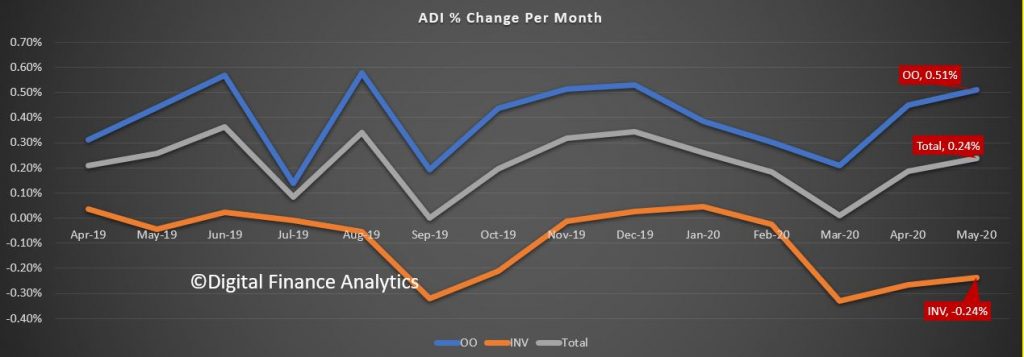
As result the proportion of loans for investment purposes dropped back to 36.3%. Total loans were 1.758 trillion dollars.

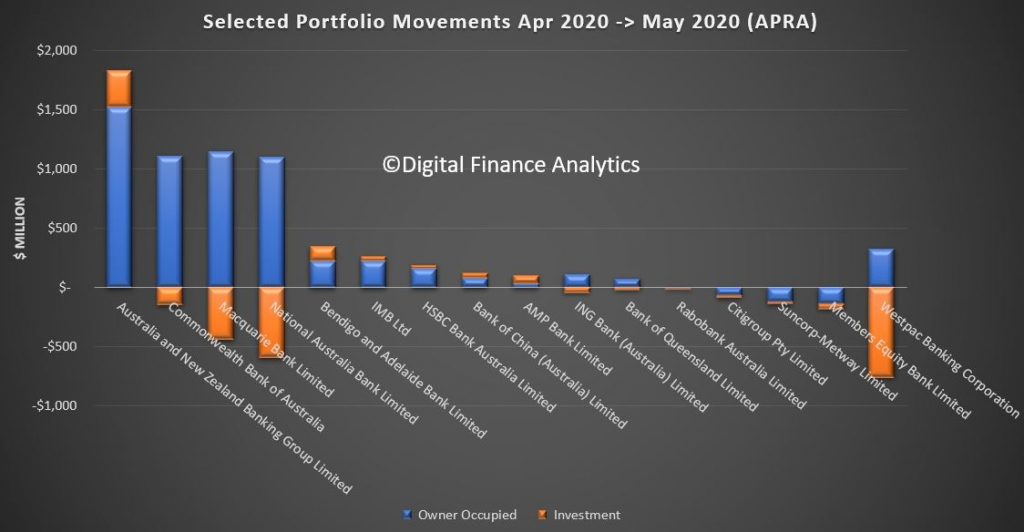
Within the individual lenders, Westpac dropped their investment portfolios, more than NAB, Macquarie and CBA, while ANZ expanded both investment and owner-occupied loans, as did Bendigo and Adelaide Bank and Bank of Queensland. Suncorp, Citigroup, and Members Equity Bank all reported lower balances to APRA this month.
Turning to the RBA series, which includes the non-bank sector, Credit to the private sector contracted in the month of May, the first decline in credit since June 2011.Demand for credit has weakened across across businesses and households.
The RBA reported that the May decline in total credit of 0.1% included: a 1.2% contraction in personal; a 0.6% fall in business; and a weak 0.24% rise in housing (with the investor segment in decline).
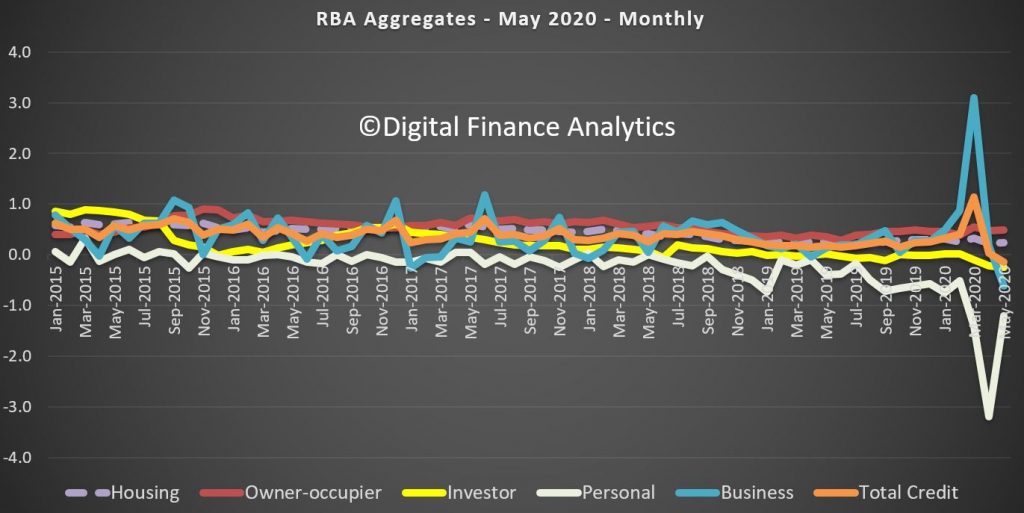
Businesses are in survival mode now, having initially pulled down available credit lines, which led to a March spike of 3.1%, the largest monthly increase in business credit since the start of 1988.
Now they are moving into cut mode with expenditure and investment both slowing. We expect this to continue, along with more structural job cuts.
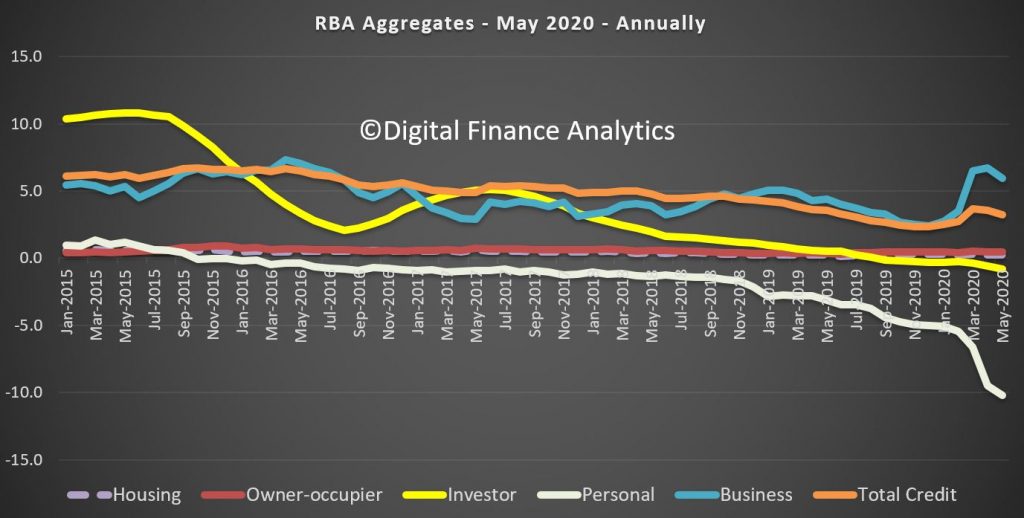
Personal household credit which makes up around 8% of total household credit fell, as confidence ebbs away. The temporary “lock-down” also impacted. In fact in the past 12 months personal credit is down more than 10%.
Overall housing credit was up 0.22% in April and by 0.24% in May, which translates into an annulaised 2.8%. It continues to weaken. Of course this is a function of confidence, off the back of COVID, plus rising underemployment, Investor Housing credit dropped -0.25% over the month, and down -0.8% across the year for May. Our research suggests many property investors are coming unglued as home prices fall and rents get crushed. Owner Occupied credit grew, up 0.49% over the month, or 5.4% annualised.
So to me the question will be the ongoing impact of underemployment, and the impact of the cliff, depending of what the banks do (will they continue to postpone repayments) and the shape of future government support, to say nothing of the passage of the virus.
APRA released their monthly stats showing total reported balances for each bank to the end of January 2020.
Total balances grew by 0.26%, to $1.75 trillion dollars, with loans for owner occupation up 0.38%, to $1.1 trillion dollars and investment loans up 0.04% to $0.64 trillion dollars. Investment loans made up 36.9% of the portfolio.
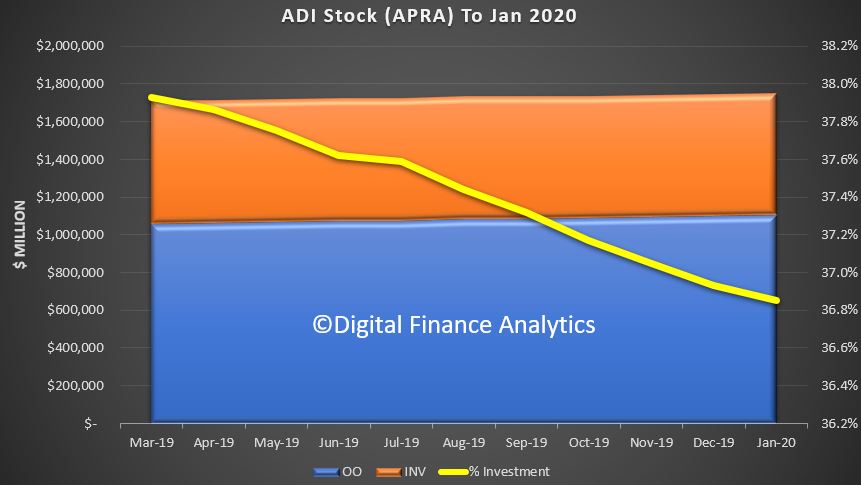
These are net balances, after repayments and new loans, and refinancing between banks.
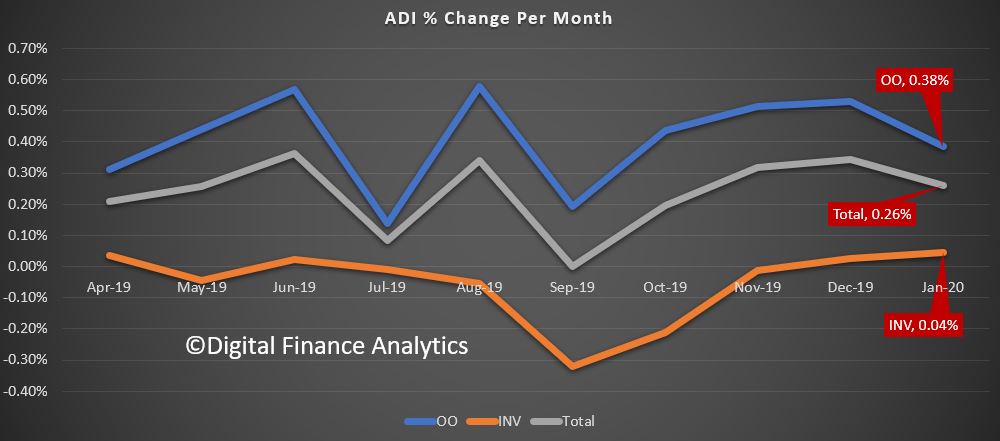
The individual movements between banks shows that CBA and Macquarie Bank are leading the growth, while NAB, and Westpac dropped investment loan balances, ANZ dropped both types, while Suncorp accelerated their investment lending. Macquarie still leads in investment lending however.
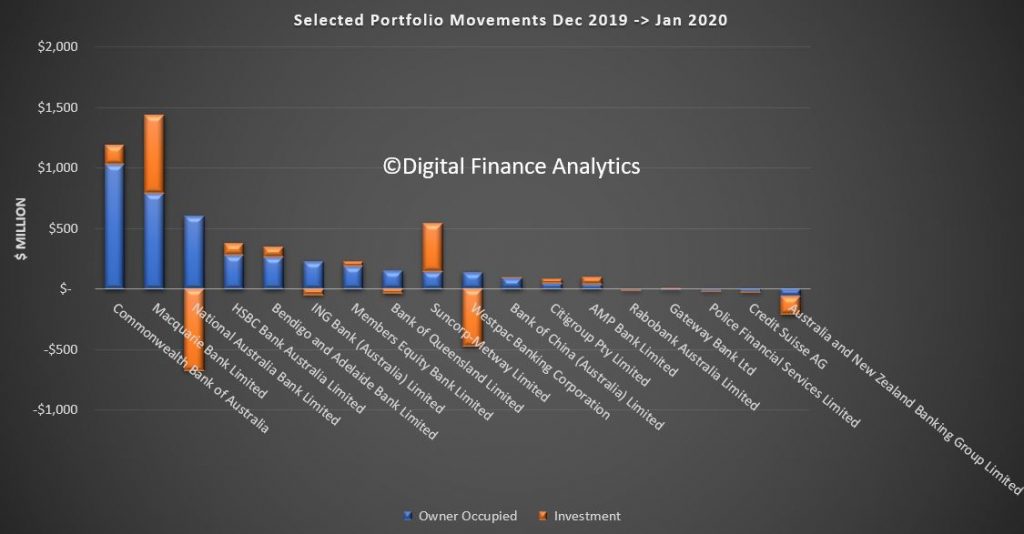
This suggests ongoing weakness in credit growth – and we will examine the RBA data shortly, also out today. But clearly individual lenders are executing different strategies, and the portfolio changes highlight the net impact.
Its the last day of January, so the RBA has released their credit aggregates to the end of December 2019 and APRA released their latest modified Monthly Authorised Deposit-taking Institution Statistics.
Looking at the RBA data first, over the past month housing credit stock (the net of new loans, repaid loans and existing loans) rose by 0.3%, driven by owner occupied housing up 0.5%, while investment loans slide just a little, but rounded to zero. Personal credit slid another 0.5% while business credit rose 0.2% compared with the previous month. These monthly series are always noisy, and they are also seasonally adjusted by the RBA, so there is plenty of latitude when interpreting them.
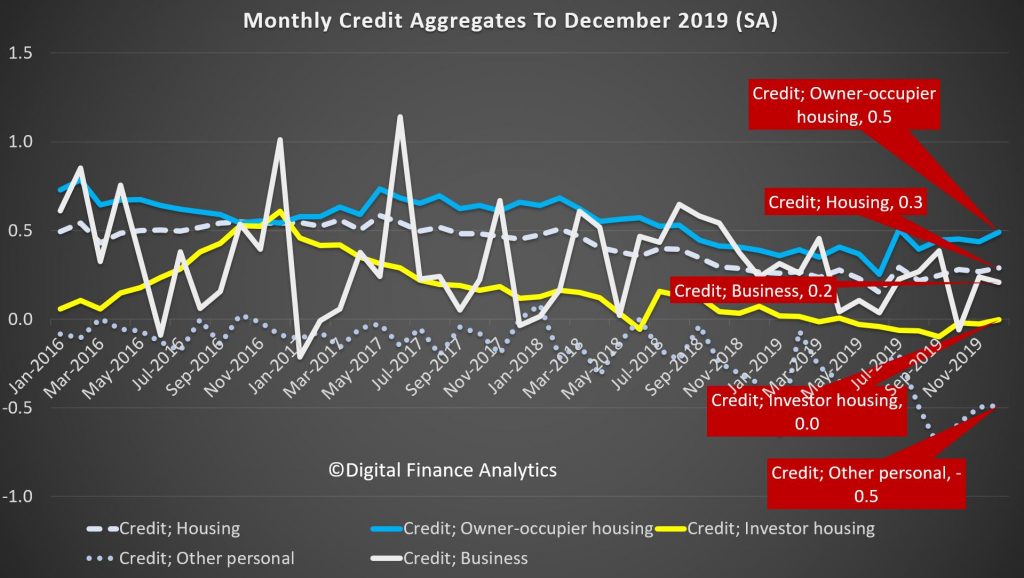
But overall, total credit grew by 0.2% over the month, while the broad measure of money rose just 0.1%.

The three month derived series helps to spotlight the key movements over the past few years. Credit growth for owner occupation rose 1.4%, and it has been rising a little since the May election, and the loosening of lending standards by APRA, and lower rates later. Its low point was a quarterly rise of 1% a few months ago. Investment lending continues to shrink, at 0.1%, but the rate of decline has eased from September, again thanks to loser lending standards. However this also reflects a net loan repayment scheme that many households, in the current tricky environment are on. Personal lending is still shrinking, falling at 1.6%, though the rate of slowing is reversing from a low of minus 1.8%. Business credit is o.4%, but has been falling since October where it stood at 1.8%, reflecting a serious downturn in business confidence and demand for credit. For businesses, the economic backdrop has been a challenging one. The global economy is sluggish and household spending is soft. In this environment business investment in the real economy has lost momentum across the non-mining sectors – weighing on credit demand. Rolling total credit for 3 months is 0.6%, up from a low of 0.5% a couple of months back.

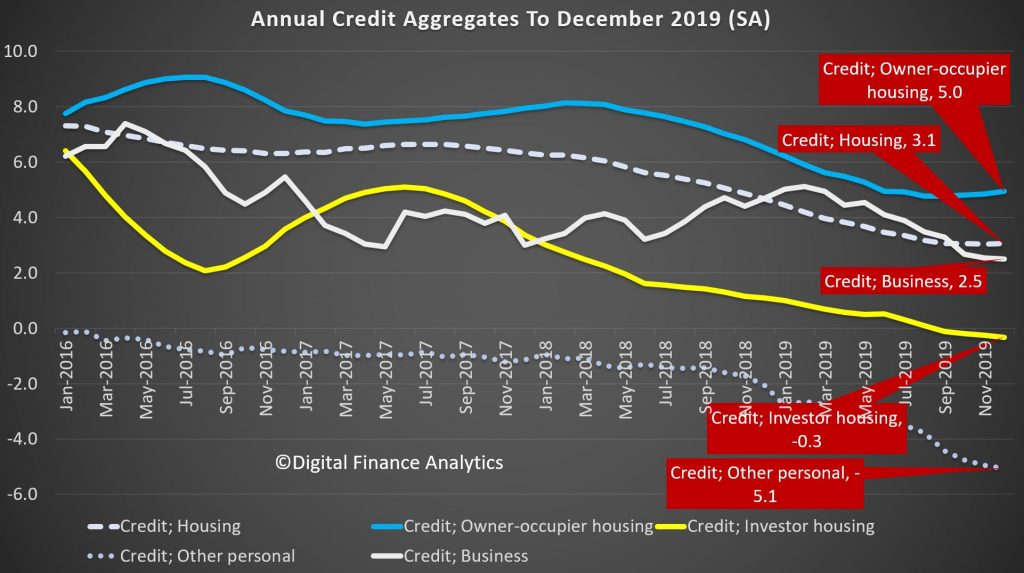
Turning to the annualised data series, housing credit is at 3.1% up from 3.03% last month. Annual owner occupied housing is up 5% from a low of 4.7% in August, while investor loans are down 0.3%, which is the largest fall we have ever seen. Personal credit is 5.1% lower, and that is another record low, while business credit grew by 2.5% on an annual basis, which is the lowest its been for years.
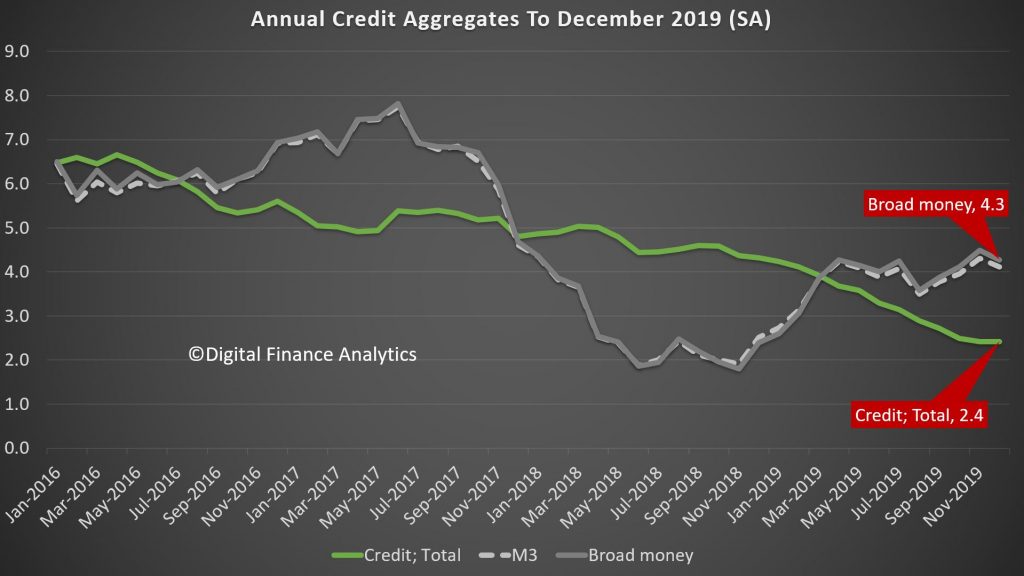
As a result, total credit grew 2.4%, which is the lowest level of growth since 2010, following the global financial crisis. Credit growth has progressively eased after peaking at 6.7% during the 2015/16 financial year. Key to the slowdown was the housing downturn as the cycle matured and lending conditions tightened. On the other hand, broad money is growing at 4.3%, and is significantly higher than last year, which we attribute to the positive terms of trade (thanks to iron ore prices and commodity volumes and RBA open market operations).
So while sentiment bounced after the May Federal election, which removed uncertainty around tax policy for the sector, as the RBA has lowered rates since June by a total of 75bps, with further cuts likely and APRA easing mortgage serviceability assessments; growth is anemaic, and of course sentiment is now in the gutter, thanks to the bushfires, coronavirus, and lack of income growth. While many analysts are predicting a bounce in credit in 2020, and a sentiment turnaround, pressure on global commodity prices and weak international tourism, as well as the drought are likely to take their toll.
We are also seeing more applications for mortgages being received, but also higher rejection rates, so we will see if this will really lead to stronger credit. And given such weak credit, we still question the veracity of the CoreLogic price series, which seems to exist in a different world. Our data supports much weaker average home price growth.
Turning to the APRA Bank series, the total value of mortgages lent (in original terms) grew by 0.34%, which is stronger than the market (0.3%), suggesting that the banks may be clawing back some business from the non-bank lenders, who have been quite active over the past couple of years. Within that owner occupied loans rose by 0.53% in the month, while investment loans grew 0.3%. The rate of growth remains slow.
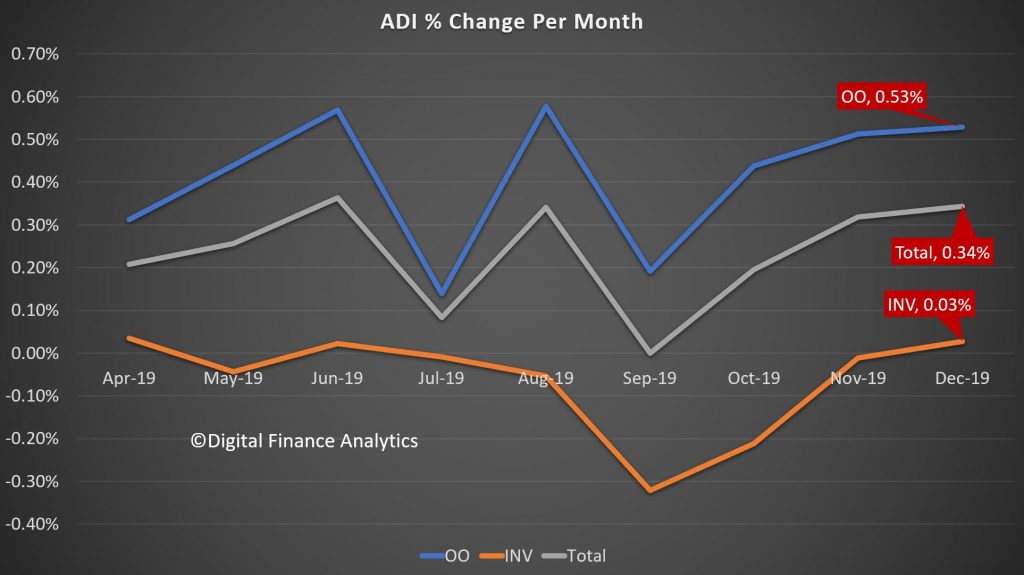
The total stock of loans did rise, up around $5 billion dollars to $1.09 trillion for owner occupied loans, and up only slightly to $644 billion, giving total exposures of $1.74 trillion, a record. The mix of investment loans fell to a low of 36.9%.
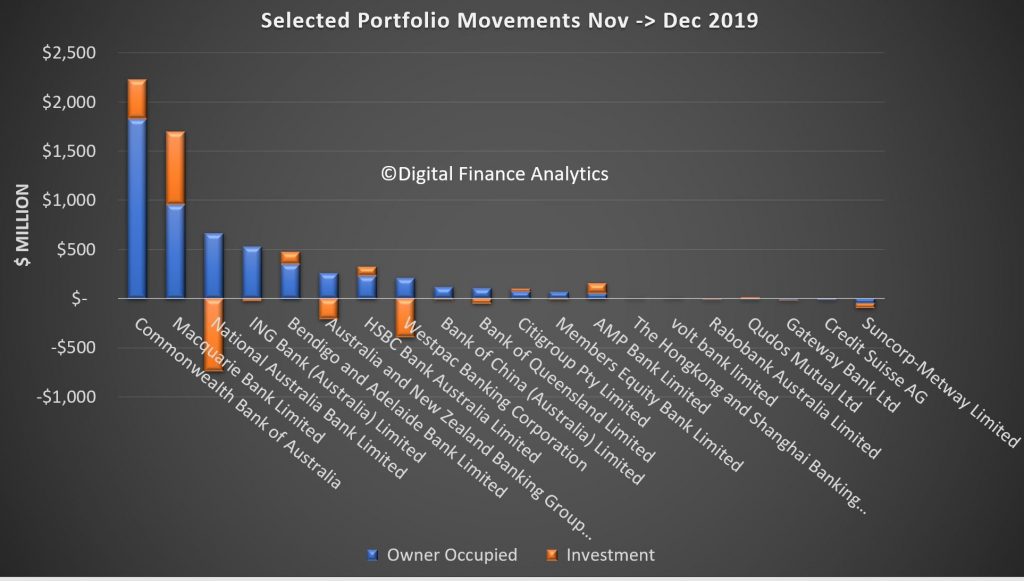
Finally we can examine the portfolio movements by individual lender, which reveals that, according to the data submitted by lenders (which may include some adjustments) CBA grew their portfolio the strongest, up more than $2.2 billion, including both owner occupied and investor loans, followed by Macquarie which continues to drive investor lending very hard, while NAB, Westpac and ANZ grew their owner occupied loans, while dropping their investor lending balances. Bendigo Bank, AMP and HSBC were also active in growing their investor loans. Neo-lender Volt Bank made an appearance in our selected list, while Suncorp dropped the value of both their owner occupied and investor loans. This highlights that lenders are steering quite different paths in their underwriting and marketing strategies. Time will tell whether the new loans being written are more risky.
And in closing, its interesting to note APRA’s release today saying that
The Australian Prudential Regulation Authority (APRA) will expand its quarterly property data publication to include new and more detailed statistics on residential mortgage lending.
In a letter to authorised deposit-taking institutions (ADIs) today, APRA confirmed the next edition of its Quarterly Authorised Deposit-taking Institution Property Exposures (QPEX) publication would include additional aggregate data on residential property exposures and new housing loan approvals.
The decision is part of APRA’s to move towards greater transparency, and will enable more in-depth market analysis by industry analysts, media and other interested parties.
The updated QPEX publication will also feature:
• reporting of additional sector-level statistics for the ‘Mutual ADI’ category; and
• clarified definitions for reported items, specifically for unreported loan-to-value ratios.
APRA Executive Director of Cross-Industry Insights and Data Division, Sean Carmody said: “APRA’s updated Corporate Plan commits us to increasing transparency of both our own operations and the industries we regulate. One of the key ways we can do that is by releasing more of the data we collect.
“With the ADI sector heavily reliant on commercial and residential property lending, enhancing QPEX will translate to greater transparency and sharper insights into one of the most crucial contributors to the economy.”
Consultation is continuing separately on a proposal for quarterly publication data sources to become non-confidential. This would mean that more of the underlying data may be disclosed to the public on a dis-aggregated basis. While this consultation remains open, APRA will continue to publish industry and peer group aggregate data, and mask data in QPEX where an individual entity’s confidential information could be revealed.
The next QPEX will be published on 10 March 2020 for the December 2019 reference period.
The letter to industry and non-confidential submissions can be found at: https://www.apra.gov.au/authorised-deposit-taking-institution-publications-refresh
We believe that the dis-aggregated data should indeed be released – because sunlight remains the best disinfectant to quote Supreme Court Justice Louis Brandeis. Compared with the disclosures in other markets, Australia is so behind the times, on the pretext of confidentially. So we endorse the need for more granular data to help separate the lending sheep from the lending goats.
APRA has released their monthly banking stats to the end of November 2019. They are of course in the process of a major revision of these statistics, but we are now beginning to get some trend data down to the individual ADI level. The data is based on gross balances outstanding by owner occupied and investment loans, but it does not show where new loans were added, or loans repaid. So little flow data can be imputed.
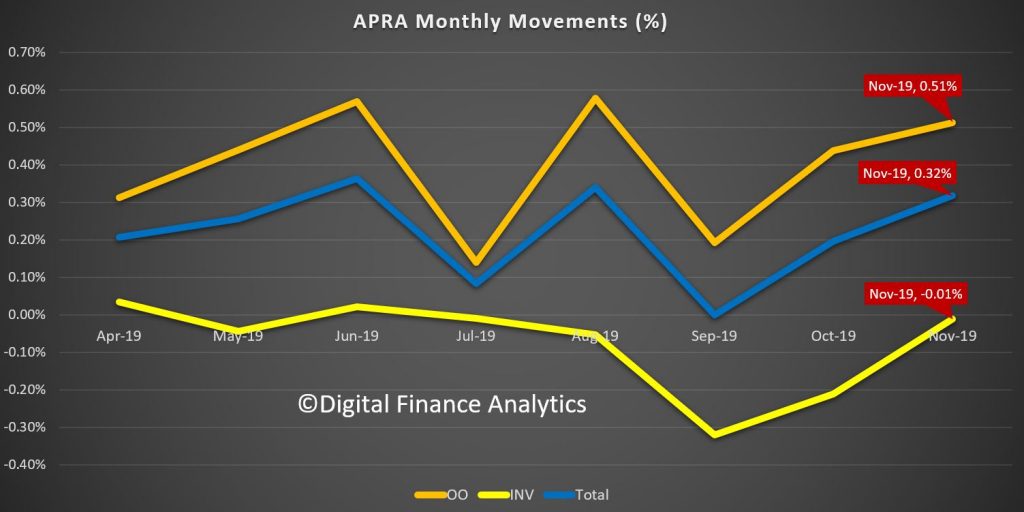
Total owner occupied loans rose 0.51% or $5.58 billion dollars in November to $1.09 trillion dollars, while investment loans fell 0.01% or $75 million dollars to $643 billion dollars. The share of loans for investment purposes fell again to 37%.

The trend movements show some improvement relative to earlier months. Total loans rose 0.32% in the month, which would given an annualised 3.8%.
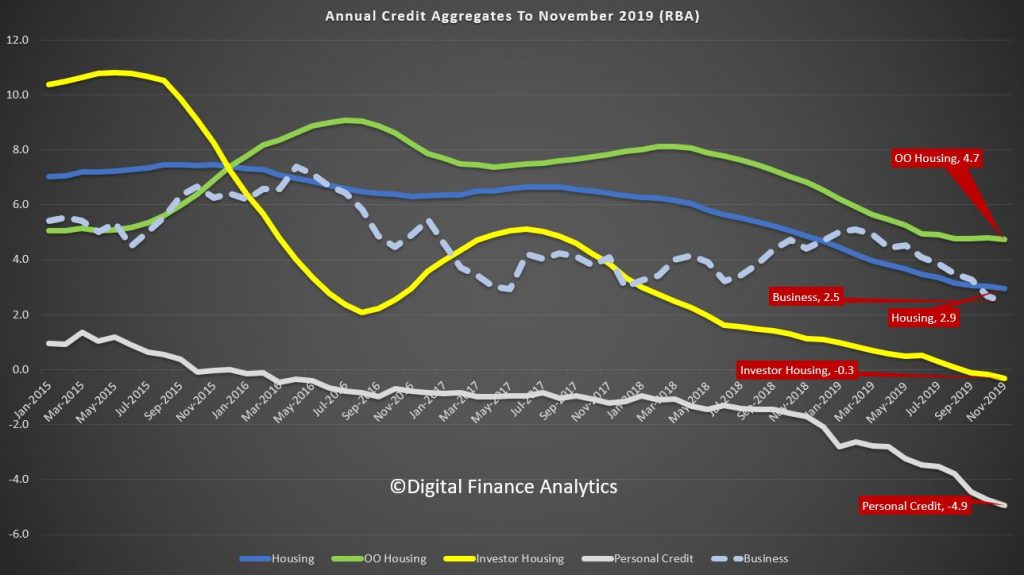
The RBA data released before Christmas showed that total loan growth over the past year for mortgages fell to the lowest ever (2.9%), which suggests that non-banks may be lending less now. But we cannot be sure of this.
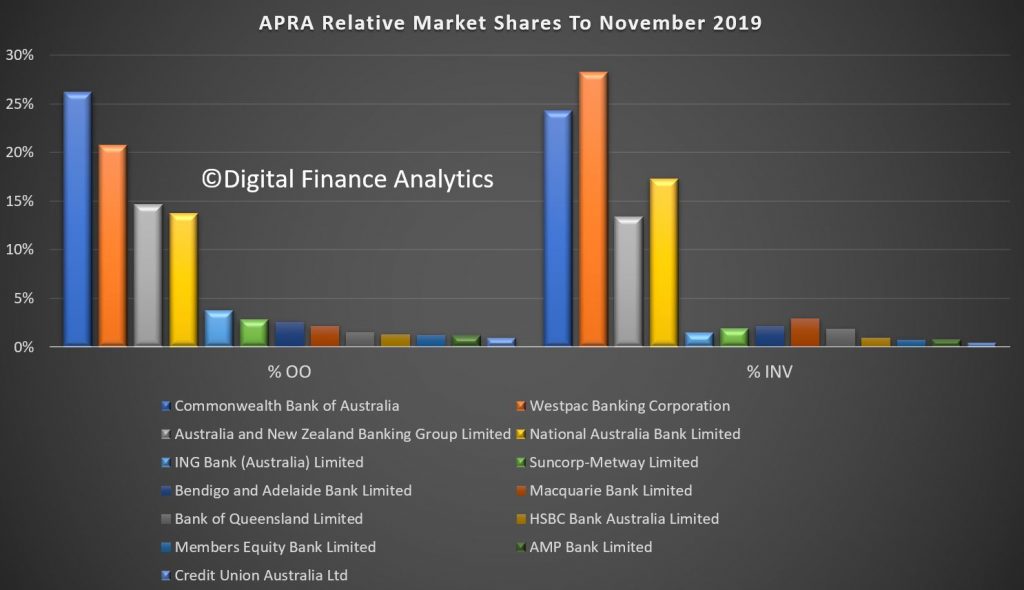
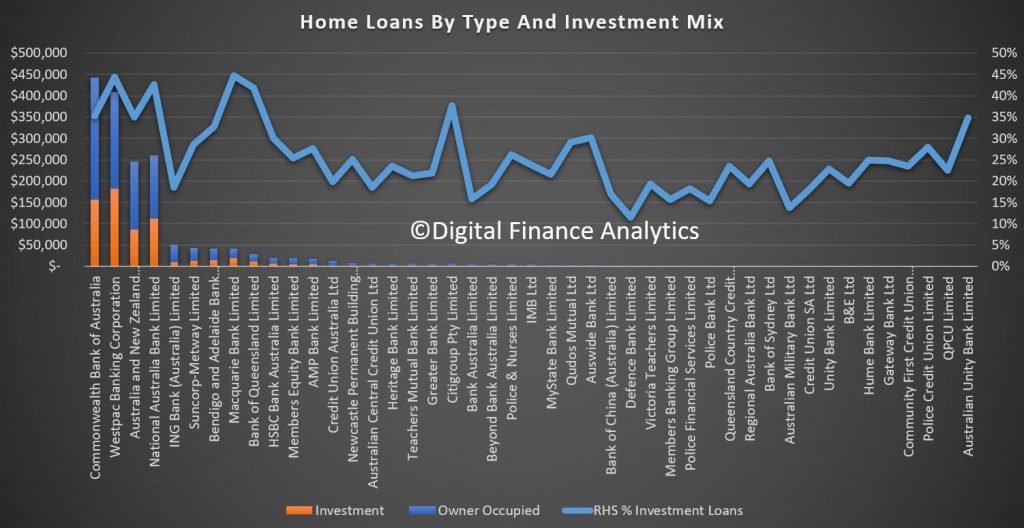
We can also look at individual lenders. The relative shares of the largest players hardly changed, with CBA the largest owner occupied lender, while Westpac has the largest share of investment loans.
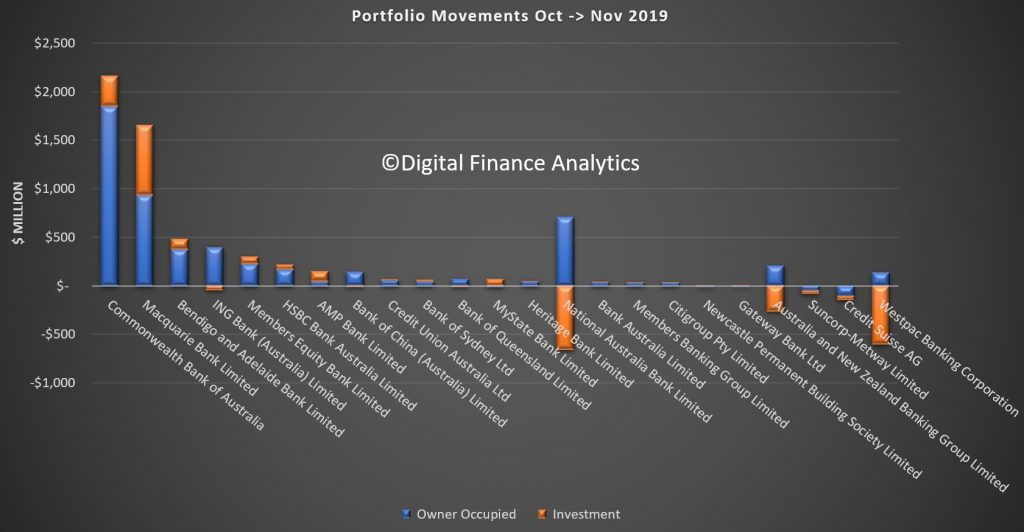
However, the relative movements this month underscored divergent results from lenders. CBA and Macquarie both saw significant growth in loans in the month, with Macquarie writing net more investment loans than any other lender at $718 million dollars. Bendigo Bank and AMP Bank are also chasing investment lending. On the other hand, ING dropped their investment loan balances, alongside the other big lenders, with NAB down $661 million, ANZ down $263 million and Westpac down $602 million. Suncorp and Credit Suisse both dropped their owner occupied and investment loan portfolios.
Finally, the relative proportion of loans for investment purposes reveals that Macquarie has 44.8% of its loans for this purpose, Westpac at 44.5%, NAB at 42.6% and Citi at 37.7%. Bearing in mind investment loans are intrinsically more risky, this is worth watching.
So, some small uplift in net volume of loans, but not equally spread across the sector, which suggests different players have different underwriting settings.
And the growth in lending suggests the household debt ratio is set to continue to rise, despite its already stratospheric level.