Banks Continue the Mortgage Lending Party In A Fog

The latest data form APRA on the banks (ADI’s) portfolios for October 2015 tells us a little, but much is lost in the fog of adjustments which continue to afflict the dataset. In fact, APRA now points to the “corrected” numbers which the RBA publish.

Some banks have reclassified housing loans that originated as investment loans to owner-occupied based on a review of customers’ circumstances or as advised by customers. See the Monthly Banking Statistics Important Notice for more information. These reclassifications will affect growth rates for investment and owner-occupied housing loans for October 2015. Questions about specific data should be directed to the relevant bank.

The Reserve Bank of Australia publishes industry-level housing loan growth rates in Growth in Selected Financial Aggregates. Table D1 in particular contains investment and owner-occupied loan growth rates, which have been adjusted for these reclassifications. Table D1 is available on the RBA website athttp://www.rba.gov.au/statistics/tables/index.html”

The RBA data shows that investment loans are probably growing a little below 10%, and owner occupied loans at about 6%.
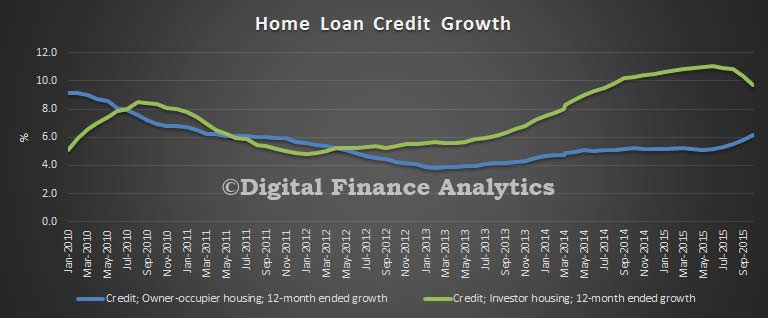
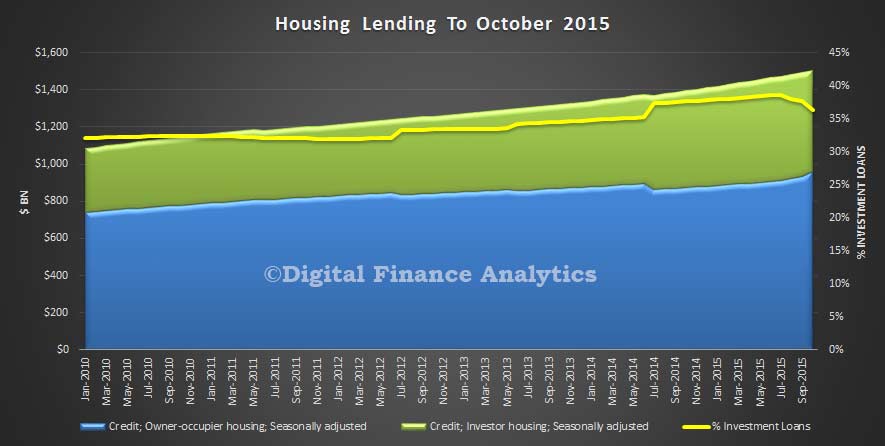
RBA-HL-Growth-D1-Oct-2015The monthly banking stats do not contain these adjustments, so cannot be directly reconciled. However, some interesting points are worth noting nevertheless. First is that total lending for housing rose by 7.5 bn to 1.4 trillion in the month. The RBA lending figure for the whole market (including the non-banks) was 1.5 trillion.  This is another record.  Investment lending sits at 37% on these numbers.  Net movements for OO loans was up 2.73%, whilst investment loans fell 2.95%.

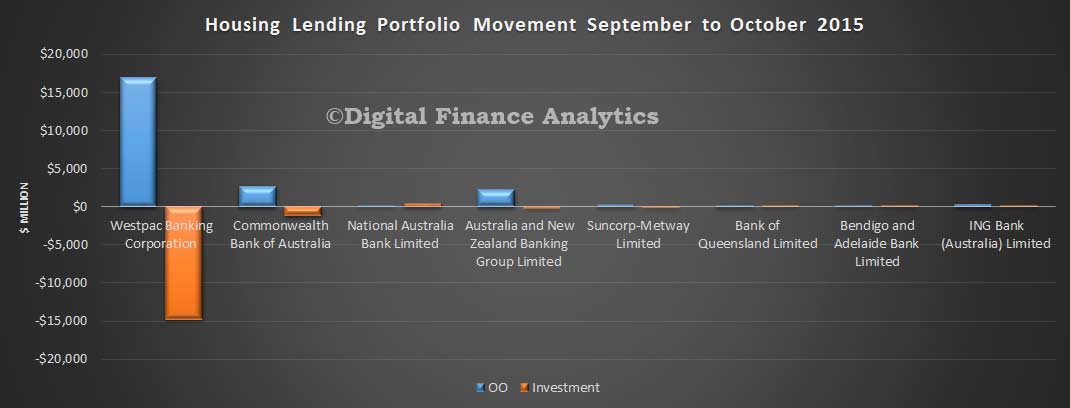
Beyond that, if we take the APRA data at face value, then Westpac continues to reclassify loans. In the monthly movements we see more than $15bn swung into the owner occupied category, with an adjustment to the investment side of the ledger. There were smaller movements in the other banks, but some of this looks like further adjustments.
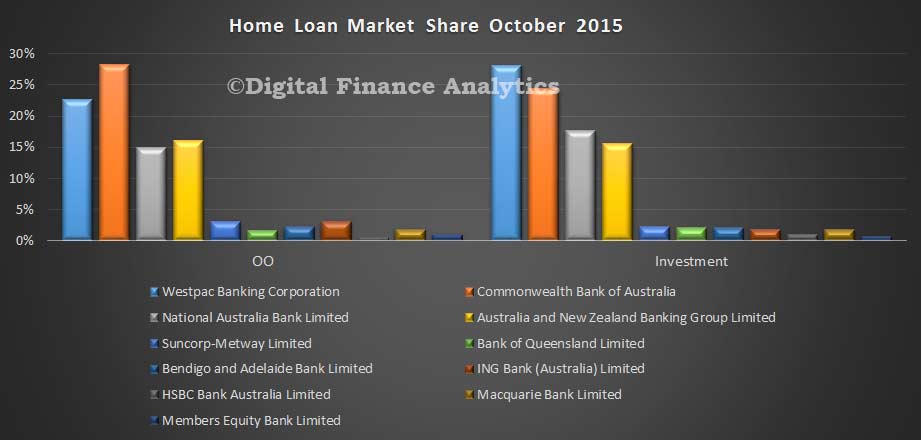
APRA-MBS-Oct-2015-1So the current market shares are revised to:
APRA-MBS-Oct-2015-2In our modelling of the monthly movements, based on the APRA data, where we sum the monthly movements for the past year (and include adjustments where we can), it appears Westpac is now in negative territory for investment loans, and that the growth rates for the other majors is slowing. The imputed annual market movement is 4.4% against the RBA data above of just under 10%.

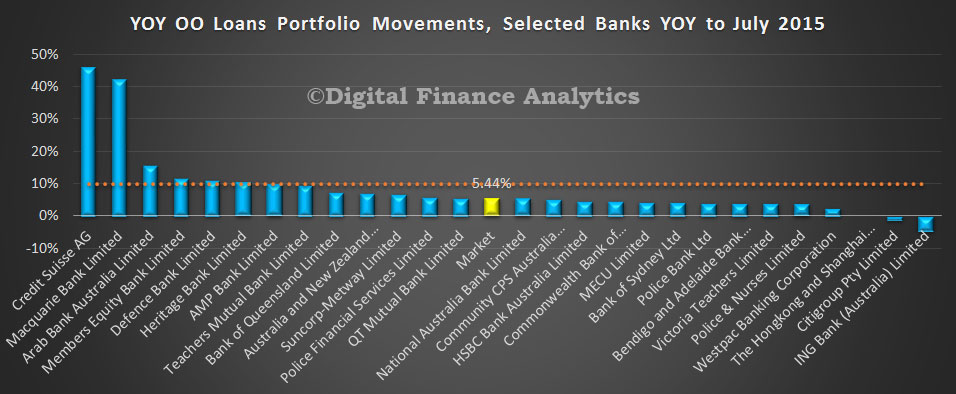
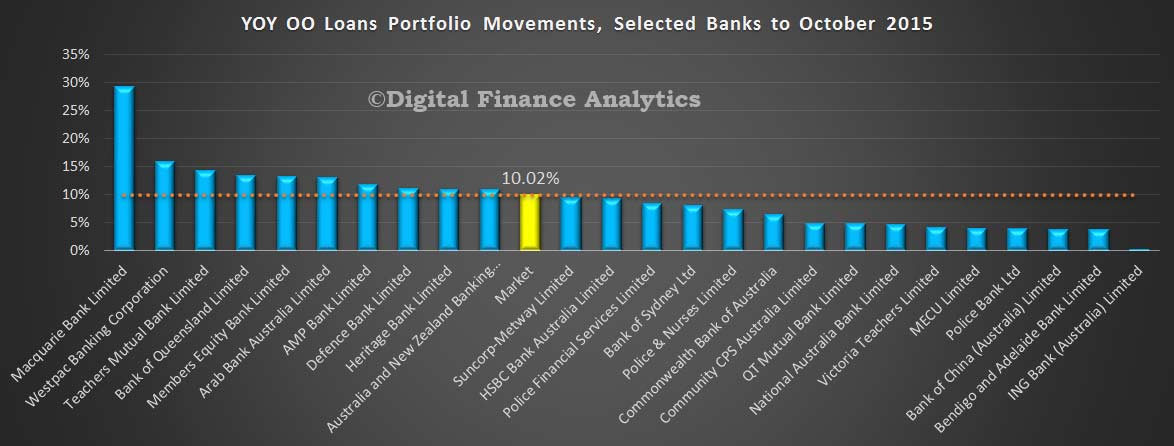
APRA-MBS-Oct-2015-4For completeness we also show the owner occupied movements. These too are impacted by reclassifications, and the imputed growth rate is 10%, compared with 6% from the RBA.
APRA-MBS-Oct-2015-3 The net effect of all this is that there is no true information about what individual banks are doing in their loan portfolios. Having tried to talk to a couple of them to clarify the story, I discover they are not willing to share additional data and refer back to the [flawed] APRA data.

The convenient “fog of war” will continue for some time to come. There is also no way to cross-check the RBA adjusted data, and no underlying detailed explanations. We are just supposed to trust them!



Housing Lending Up Again In October to $1.5 trillion.

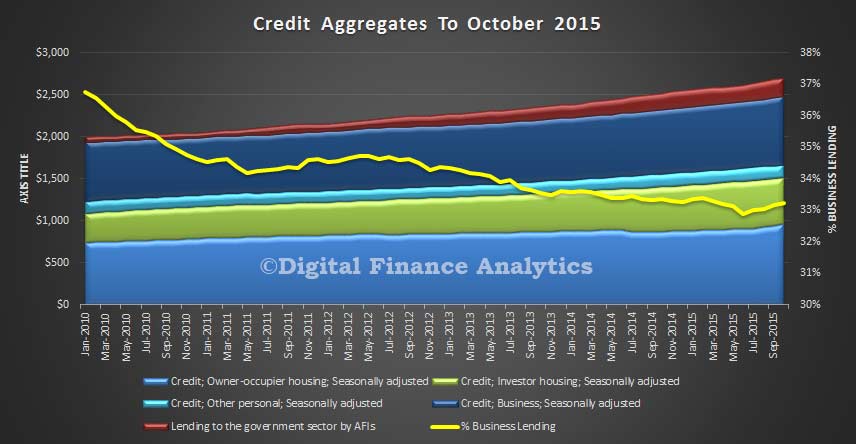
The latest RBA credit aggregates for October 2015, released today are not easy to interpret because of the myriad of adjustments.   Housing loans have more reached $1.5 trillion, another record.  But are these numbers trust-worthy?

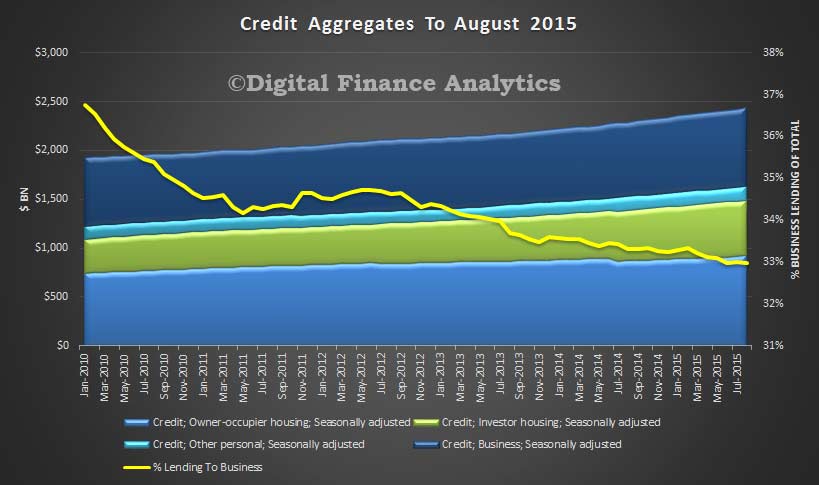
At the aggregate level, total credit rose a seasonally adjusted 0.61% in the month, or 6.11% in the past year. Lending to business grew 0.84% in the month, and 5.88% in the last year. Business lending as a proportion of all lending sits at 33.2%, from an all-time low of 32.9% in July, but clearly business investment continues to be constrained. Housing grew 0.58% in the month, and 7% in the past year, whilst personal credit fell 0.89% in the month and 0.27% in the year, a sign that households remain cautious.

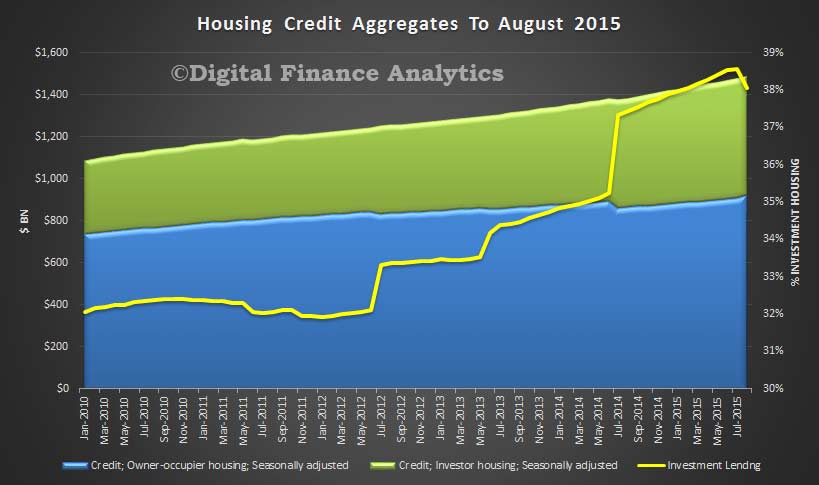
Credit-Aggregates-Oct-2015Turning to housing finance in more detail, and this is where it get complex; lending for owner occupied loans rose 2.62% in the month, representing 9.41% growth in the past year, while investment lending fell 2.8% in the month, and grew 3.03% in the year. But there are so many adjustments in these numbers, as the banks reclassify more loans, thanks to a combination of internal review, and customer request. Specifically, the differential movement in investment loans is making people check their loans are correctly classified, and RBA estimates $30bn of loans have been switched. Investor loans on book comprise 36.35% of all housing, down from its recent heights of 38.55% in July. The only thing we can be sure of is the numbers will move again next month. I discussed the recent RBA comments on this issue recently.

Housing-Aggregates-Oct-2015The RBA makes the following caveats:

All growth rates for the financial aggregates are seasonally adjusted, and adjusted for the effects of breaks in the series as recorded in the notes to the tables listed below. Data for the levels of financial aggregates are not adjusted for series breaks. Historical levels and growth rates for the financial aggregates have been revised owing to the resubmission of data by some financial intermediaries, the re-estimation of seasonal factors and the incorporation of securitisation data. The RBA credit aggregates measure credit provided by financial institutions operating domestically. They do not capture cross-border or non-intermediated lending.

Following the introduction of an interest rate differential between loans to investors and owner-occupiers a number of borrowers have changed the purpose of their existing loan; the net value of switching of loan purpose from investor to owner-occupier is estimated to have been $30.6 billion over the period of July 2015 to October 2015. These changes are reflected in the level of owner-occupier and investor credit outstanding. However, growth rates for these series have been adjusted to remove the effect of loan purpose changes.

The APRA ADI data is also out today, and we will look at this later.

September ADI Data Highlights Mortgage Shift

The monthly data from APRA on the banks for September makes interesting reading. This month we will focus on the home loan story (cards and deposits being pretty much as normal). First the total value of home loans in the bank’s books rose by 0.84% to $1.388 bn (compared with a total market of $1,495 bn as reported by the RBA – the gap is the non bank sector).  Among the ADI’s, owner occupied loans rose 1.48% to $856 bn, whilst investment lending FELL by 0.57% to $532 bn, and is 38.3% of all home lending. We saw a fall the previous month in investment loans of 0.75%, so investment lending continues to drift lower as the pressure from the regulators finally flows through.

Of course, the banks still need the mortgage lending drug, so they have switched to grabbing owner occupied refinance loans, and are discounting heavily now (thanks to the back book repricing they have shots in the locker).

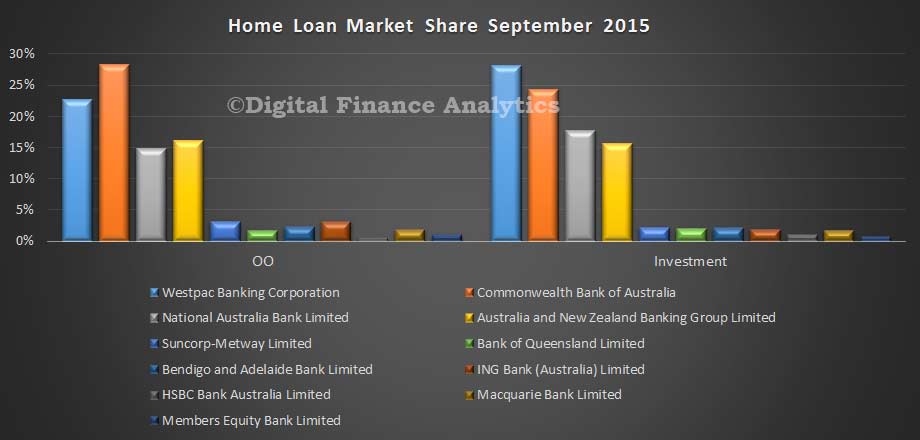
Looking at the bank specific data (and yes, we think the data is still noisy), the market shares in September look pretty similar, with Westpac still the king pin for investment lending, and CBA the champion of owner occupied loans.

MBS-Sept-2015---Home-Loan-Shares

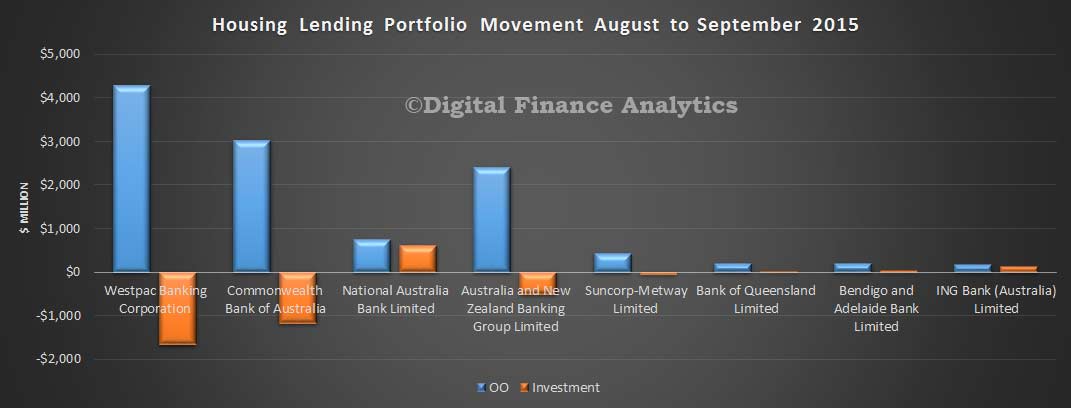
Looking at the portfolio movements though, from August to September, we see a significant swing at three of the big four, with Westpac, CBA and ANZ all dropping their investment loan portfolio a little, whilst driving owner occupied loans really hard. Suncorp also went backwards on investment lending. The focus is clearly owner occupied loans.

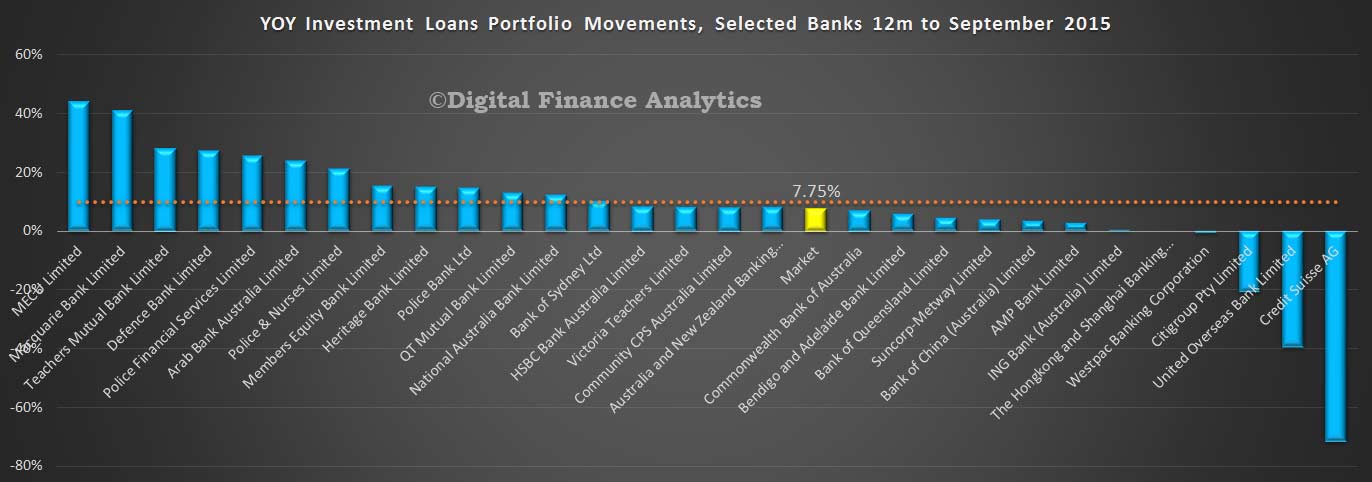
MBS-Sept-2015---Home-Loan-Portfolio-MovementsLooking at the 12 month moving data on investment loan portfolio growth, we see that some are still above the 10% speed limit, but several of the majors are now below the hurdle. The industry average is now at 7.75%. We expect it to fall further, because more banks will need to throttle back to keep their annual rates below 10%.

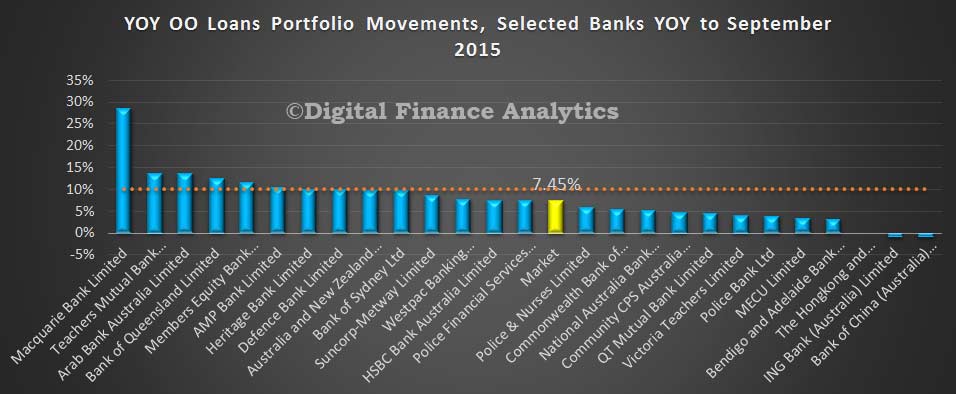
MBS-Sept-2015---INV-MovementsGrowth in owner occupied loans is stronger now than it has been for some time. The market annual average is 7.45%, and we expect the rate of growth to continue to rise. This begs the question, at what point will the regulators decide to erect a speed trap on the owner occupied side of the ledger?

MBS-Sept-2015---OO-Movements  The deep discounting of new owner occupied loans more than offsets any price increases on the headline rates for existing borrowers. We do not think the RBA should cut rates, as this will just stoke owner occupied demand further.

Housing Finance Still Strong In August

According to data released by the ABS, lending for housing is still very strong, though with some re-balancing away from lending for investment purposes. Total housing lending rose 0.63% seasonally adjusted to a new record of $1.49 trillion, of which $1.38 trillion sits with the banks, the rest is from the non-bank sector. However commercial lending fell using our preferred trend measurements. We do not think the current regulatory settings are right, because flows are still too strong in the housing sector. Of significant note is the relative fall in the proportion of lending going to business down to 14%; and the ongoing rise in the proportion of lending to business which relates to investment housing lending, up to 19%. Both indicators of a sick economy.

LendingFlowsAugust2015AllThe ABS says that in August, the total value of owner occupied housing commitments excluding alterations and additions rose 1.9% in trend terms, and the seasonally adjusted series rose 6.1%. Investment housing commitments fell 0.2%. The trend series for the value of total personal finance commitments fell 0.8%. Fixed lending commitments fell 0.9% and revolving credit commitments fell 0.5%. The trend series for the value of total commercial finance commitments fell 2.1%. Revolving credit commitments fell 2.5% and fixed lending commitments fell 1.9%. The trend series for the value of total lease finance commitments rose 1.6% in August 2015

But as you dig into the data, some interesting themes emerge. So we will run through the main findings in some detail, using data from the two ABS series. We will focus on the housing sector.

Recent heavy discounting and incentives have lead to a significant rise in owner occupied lending. The bulk relates to the purchase of existing property, lending for construction fell again. We also see a relative slight fall in the proportion of loans refinancing existing borrowing, but the proportion is still, by value at the strongest it has been since 2012. Overall more then 20% of transactions are for refinance purposes. Many of the banks have attractive low cost offers to switch, so we expect to see significant (though unproductive) churn in home loans, as banks fight for owner occupied share.

HousingFinanceAugust2015-OOTrendsInvestment lending continues to be a significant element in the numbers.

HousingFinanceAugust2015-All-FlowsIf you remove refinanced loans from the calculation, 50% of new loans were for investment purposes, a slight drop from the 52% in February, but still very strong.

HousingFinanceAugust2015-InvestorMixLooking at investment loans by lender type, we see the banks leading the way, with their stock of investment loans sitting in the high thirties. The chart also clearly shows the adjustments lenders made in their categories, from Jun 2014, (this is an artificial hike, as they did not re-baseline their loans in earlier years). We see growth in the stock of loans for investment purposes held by building societies and credit unions, but at a lower level than the banks.

HousingFinanceAugust2015-MixByADITypeWithin the investment sector, we see a rise in investment loans to entities other than  individuals. These will include companies and self-managed superannuation funds.

HousingFinanceAugust2015-InvestmentOtherFlowsAs previously highlighted the stock of housing continues to rise.

HousingFinanceAugust2015LoanStockNext we look at first time buyers. In original terms, the number of first home buyer commitments as a percentage of total owner occupied housing finance commitments rose to 15.7% in August 2015 from 15.4% in July 2015. However, the absolute number of first time buyer loans was lower in the month, down 2.4% on July. The average loan rose from $341,000 to $346,000, illustrating again that purchasers are reacting to higher prices by getting larger loans, despite apparently tighter lending criteria. Not sure how this works!

HousingFinanceAugust2015-FTBIf we then overlay the data from the DFA household surveys, we see that investment first time buyers are still active, but in slightly lower numbers, so overall, the number of first time buyer loans last month fell a little.

HousingFinanceAugust2015-FTB-DFA

Bank Portfolio Loan Movement Analysis

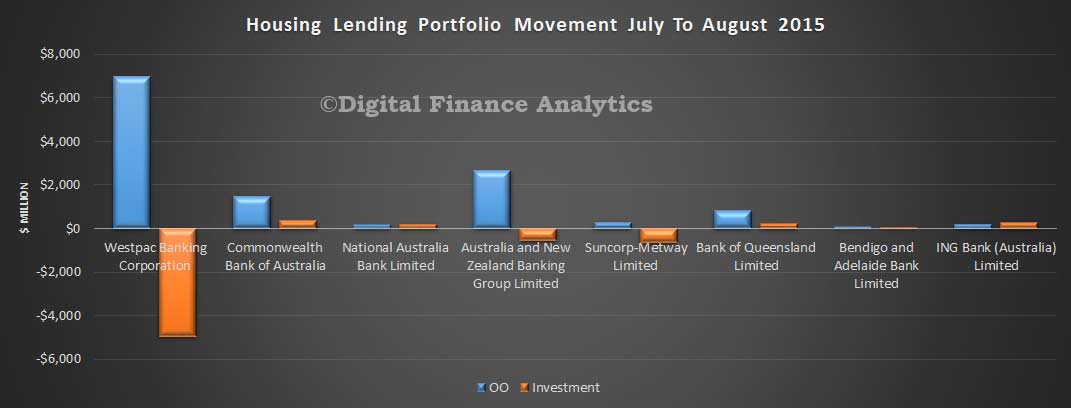
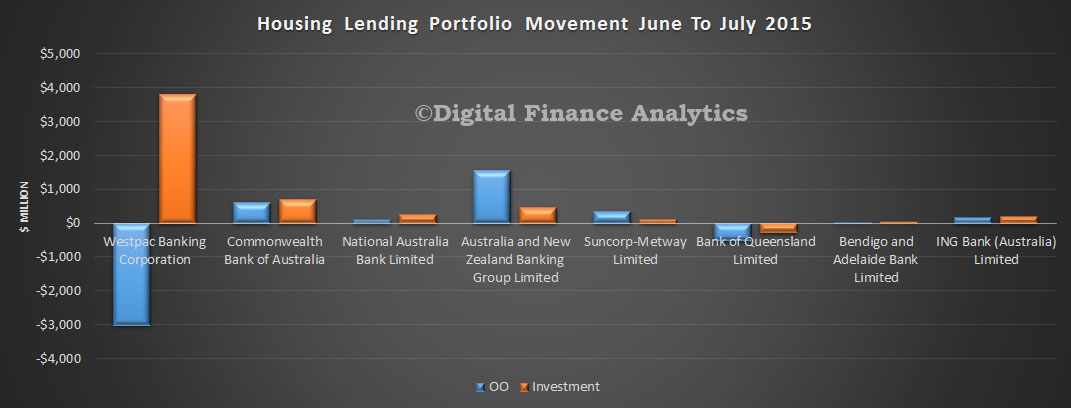
Following on from the APRA data released yesterday, today we look at the bank loan portfolio movements. Looking at home loans first, the APRA credit aggregates which focus on the ADI’s shows that the stock of home loans was $1.378 trillion, up from $1.367 trillion in July, or 0.8%. Within that, investment loans fell from $539.5 bn to $535.5 bn, down 0.7%, whilst owner occupied loans rose from $827 bn to $843 bn, up 1.9%, thanks to the ongoing reclassification. We see some significant portfolio re-balancing at Westpac between owner occupied and investment loans, continuing a trend we observed last month. We also see a relatively strong movement in owner occupied loans, as we predicted, as the focus shifts from investment lending to owner occupied loans.

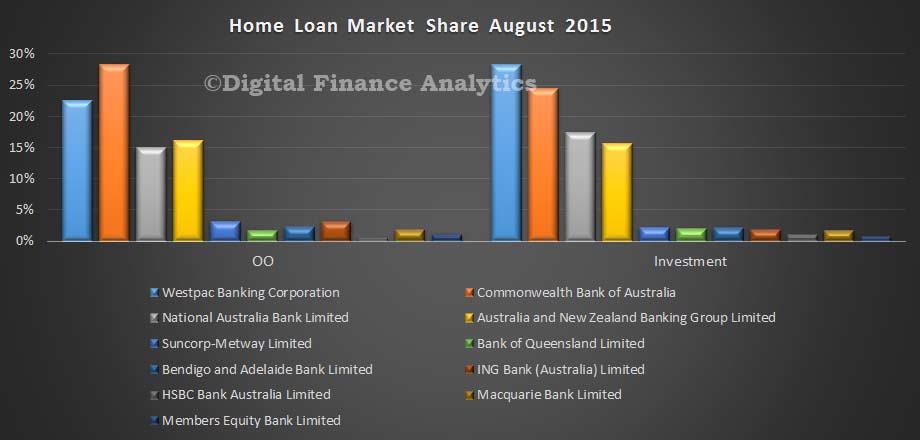
APRA-August-2015-Loan-Portfolio-MovementsThe relative portfolio shares have not changed that much, but the consequences of the Westpac moves means their relative share of investment lending is down somewhat from 28.9% to 28.2% of the market, whilst CBA moved from 24.2% to 24.4% and NAB from 17.3% to 17.4%.

APRA-Home-Lending-Shares-August-2015Looking at trend portfolio movements (which we calculate by summing the monthly movements from September 2014 to August 2015 using the APRA data, adjusted for the ANZ and NAB revisions which were announced earlier), the annual market growth for investment loans is 10%, in line with the APRA speed limit, and we see some banks above. We expect to see further revisions as we progress.

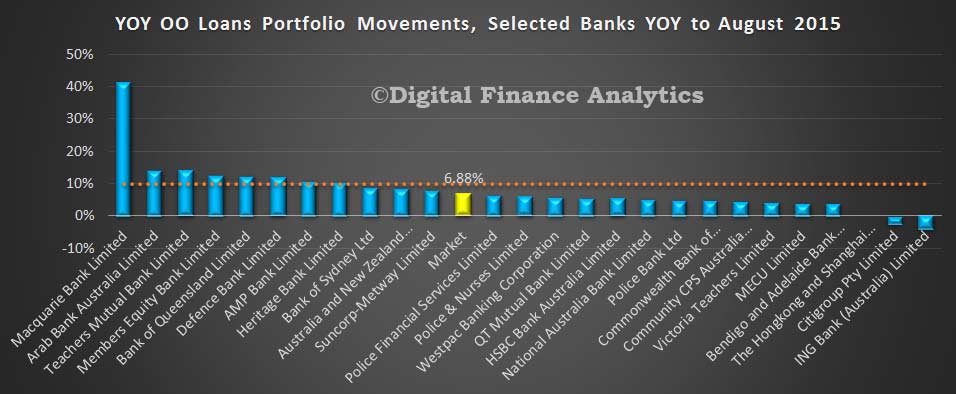
APRA-Investment-Loans-By-Lender-August-2015Looking at the owner occupied side of the ledger, average portfolio growth was 6.88%, and again we see a fair spread with some well above the 10% mark – though of course there is as yet no speed limit on owner occupied lending.

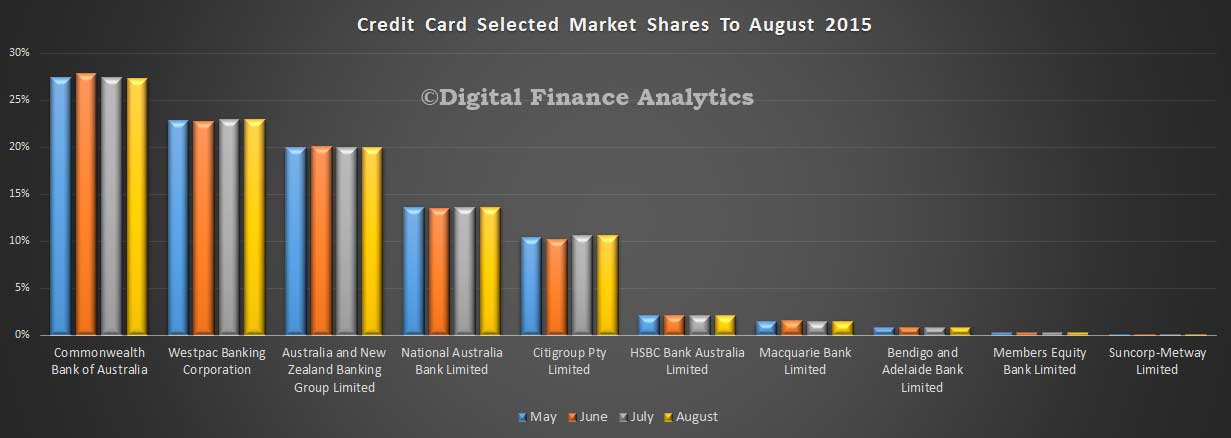
APRA-YOY-OO-Movements-August-2015Turning to credit cards, the $40.8 bn portfolio of loans hardly changed in the month of August, so the mix between providers showed no noticeable movement.

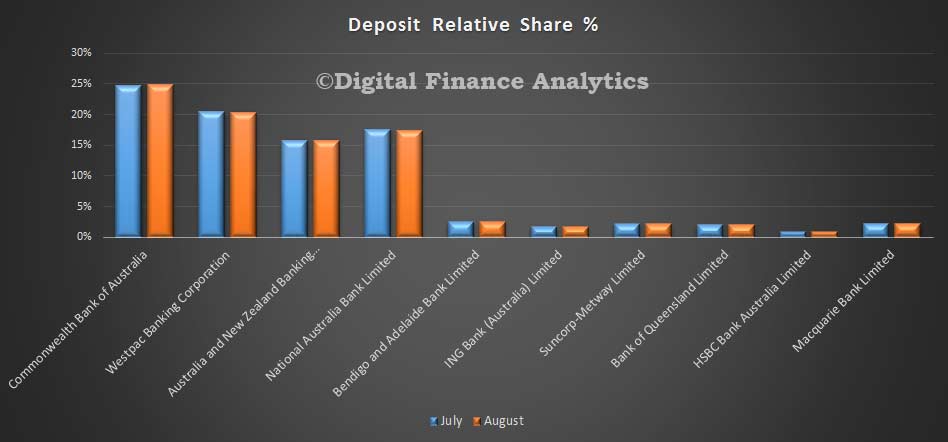
APRA-Cards-August-2015Finally, looking at deposits, there were small portfolio movements, with overall balances rising 0.6% to $1.87 trillion.

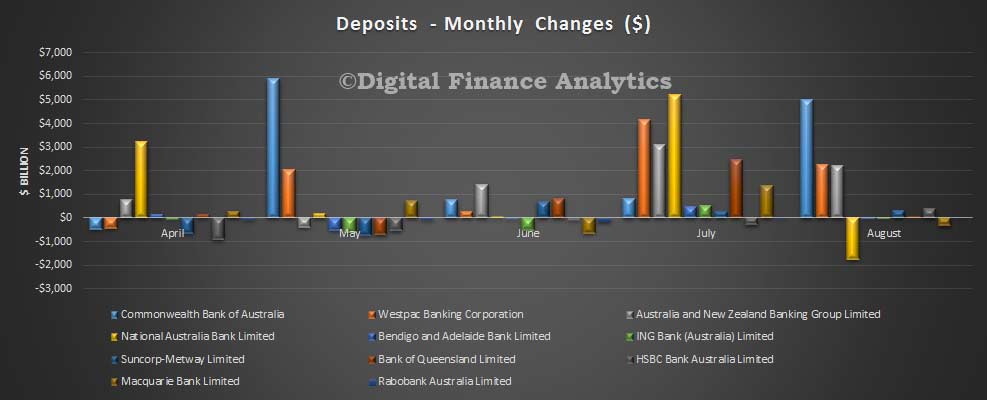
APRA-Deposits-Aug-2015  Looking at the banks, in dollar terms, NAB lost a little share, whilst CBA outperformed with an increase of $5bn in deposits. The noise in the data needs to be recognised, however, because in July, the position was somewhat reversed.

APRA-Deposit-Movements-August-2015

We also note APRA published a paper on revisions to the ADI data, APRA’s analysis shows that, in the 24 editions of MBS from January 2013 to December 2014:

  1. There were 82 reporting banks, an average 2,148 new data items published in each edition of MBS, for a two year total of 51,553 data items.
  2. there were 1,951 revisions to data items (an average of 81 data items revised per edition). There is approximately a 4.6 per cent likelihood of any data item being revised within a year from its first publication;
  3. on average, six banks (around nine per cent of all banks) resubmitted data per month that resulted in revisions to MBS;
  4. there were 557 revisions (about 29 per cent of all revisions, or 1.0 per cent of all data items) over 10 per cent and more than $100m of the original value (‘significant revisions’); and
  5. revisions to data items relating to the loans-to and deposits-from non-financial corporations were the two most significantly revised data items, together accounting for 20 per cent of all ‘significant revisions’, between January 2013 and December 2014.

Following analysis of MBS revisions, APRA intends to improve the usefulness of MBS by individually listing revisions of more than five per cent and $5m of the original value in future editions of MBS.

APRA publishes revisions to its statistics to improve the usefulness of its publications.  APRA publishes revised statistics when better source data becomes available or  occasionally, after a compilation error has been identified. Better source data typically becomes available from resubmissions of data by reporting institutions.  APRA lists ‘significant revisions’ to statistics and aims to explain the circumstances under which they were revised. Significant revisions currently include those revisions more than $100 million and over 10 per cent of the original value. These significant revisions are listed in the ‘revisions’ section of the Back Series of Monthly Banking Statistics publication.

To minimise the frequency of revisions, APRA analyses past revisions to identify potential improvements to source data and compilation techniques. Such analysis is considered international best practice. The International Monetary Fund’s (IMF’s) Data Quality Assessment Framework (DQAF) for example states that statistical agencies should ensure that “studies and analyses of revisions and/or updates are carried out and used internally to inform statistical processes.” The DQAF also recommends that “studies and analyses of revisions are made public.”

Given the substantial revisions we are currently seeing in the 2015 series, especially relating to investment and owner occupied lending, we would expect to see more details of significant changes in the future.

What Does The Latest Credit Data Really Tell Us?

Today we got the RBA Credit Aggregates and APRA Monthly Banking Statistics to August 2015.  Whilst the overall trends may superficially appear clear, actually, they are are clouded in uncertainty, thanks to significant reclassification between owner occupied and investment loans. As a result, any statement about “investment loans slowing” may be misleading. Total housing lending rose 0.63% seasonally adjusted to a new record of $1.49 trillion, of which $1.38 trillion sits with the banks, the rest is from the non-bank sector.

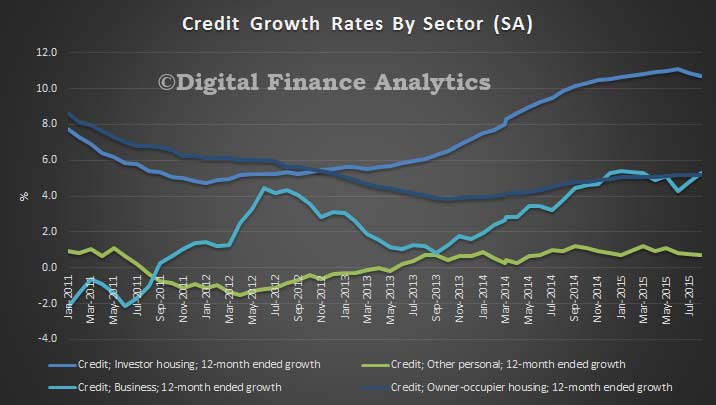
Starting with the RBA data (table D1),  overall housing growth for the month was 0.6%, and 7.5% for the 12 months (both seasonally adjusted). Owner occupied lending grew by 0.6% in the month, and 5.6% for the 12 months, whilst investment lending grew 0.7% for the month, and 10.7% for the year – still above the APRA speed limit. The chart below show the 12 month movements. It also shows business lending at 0.5% in the month, and 5.3% in the 12 months, and personal credit 0.1% in the month and 0.7% in the 12 months. It is fair to say from these aggregates that investment lending fell a little, and we think it is likely to continue to fall as lending criteria are tightened, but there is still momentum, and as we showed in our surveys demand, though tempered by tighter lending criteria.

RBA-Aggregates-Credit-Growth-PC-August-2015However, and this is where it starts to get confusing, the RBA says “Growth rates for owner-occupier and investor housing credit reported in RBA Statistical Table D1 have been adjusted to take into account the fact that the purpose of a large number of loans was reported to have changed in August, mainly from investment to owner-occupation. Similar adjustments are likely to be required in coming months. However, the stocks of owner-occupier and investor housing credit reported in RBA Statistical Table D2 have not been adjusted. The total stock of housing credit and its rate of growth are unaffected by this change.”

So, the data in D2 shows a significant fall in the stock of investment loans, and because of the adjustments not being made to these numbers (RBA please explain why you are using two different basis for the data) we need to be careful. On these numbers, owner occupied loans rise 1.5% in the month and investment lending fell 0.7%. The 12 month movements would be for owner occupied loans 6% and investment loans 8.3%.

RBA-Housing-Credit-Aggregates-Aug-2015What we can see is that the proportion of lending to business is still at a very low 33%, and this highlights that the banks are still focusing on home lending, with an intense competitive focus on the owner occupied refinance sector, and much work behind the scenes to push as much lending into the owner occupied bucket as possible. Remember that some banks had previously identified loans which should have been in the investment category, so more than 3% of loans were switched, lifting the proportion of investment loans above 38%.

RBA-Credit-Aggregates-Aug-2015The APRA credit aggregates which focus on the ADI’s shows that the stock of home loans was $1.378 trillion, up from $1.367 trillion in July, or 0.8%. Within that, investment loans fell from $539.5 bn to $535.5 bn, down 0.7%, whilst owner occupied loans rose from $827 bn to $843 bn, up 1.9%, thanks to the ongoing reclassification.  Looking at the movements by banks, the average market movement for investment loans over 12 months (and using the APRA monthly movements as a baseline) was 9.92%, just below the speed limit, and we see some of the major banks below the speed limit now, whilst other lenders remain above. These numbers have become so volatile however, that the regulators really do not know what the true score is, and the banks have proved their ability to recast their data in a more favorable light.

APRA-Investment-Loans-By-Lender-August-2015It is unlikely the “fog of war” will abate any time soon, so we caution that the numbers being generated by the regulators need to be handled carefully.

We will be looking at the individual portfolio movements as reported by APRA in a later post. We like a challenge!

ADI Data July 2015 – Investment Loans Grow Again – However…

APRA released their monthly banking stats for ADI’s to end July 2015 today. Looking in detail at the data, we start with home loans. Total ADI loan portfolios grew in the month by 0.4% to $1.37 trillion. The RBA data, already discussed gave a total growth of 0.6% to $1.48 trillion, so this suggests the non-banking sector is growing faster than ADIs. There are lags in the non-bank data streams, so we need to watch future trends carefully.  Investment lending grew more than 11% in the past 12 months.

Looking at the mix between owner occupied and investment home lending, we see that owner occupied loans were static, ($827,905, compared with $827,700 in July), whilst investment loans grew (from $827,905 to $827,700 million) with a rise of $5,799 million, or 1.1%. However, we think the data is corrupted by further restatements of loans as they are reclassified between owner occupied and investment categories.

Looking at the lender data, we start with the all important year on year portfolio movements. Depending on how you calculate this (sum of each month movement, last 3 month annualised, etc) you can make the number move around. We have adopted a simple approach. We sum the portfolio movement each month for 12 months. This gives a market growth average for the year of 11.46%. We also see that many banks – including some of the majors, are still well above the speed limit of 10%. Regulatory pressure does not seem to be having much impact, despite the rhetoric, and repricing. Our thesis appears proven.

MBSJuly2014InvPortfolioMovementsFor completeness, we show the same picture for owner occupied loans – though there is of course no formal speed limit as we think currently competitive action is focussed here.

MBSJuly2014OOPortfolioJulyTurning to the portfolio movements, we see a significant swing at Westpac – we suspect a restatement of loans – but have not found any announcements on this so far. Logically, a $3bn lift in investment lending is too significant to be normal market behaviour, in our opinion. We have factored in the restatements at NAB and ANZ.

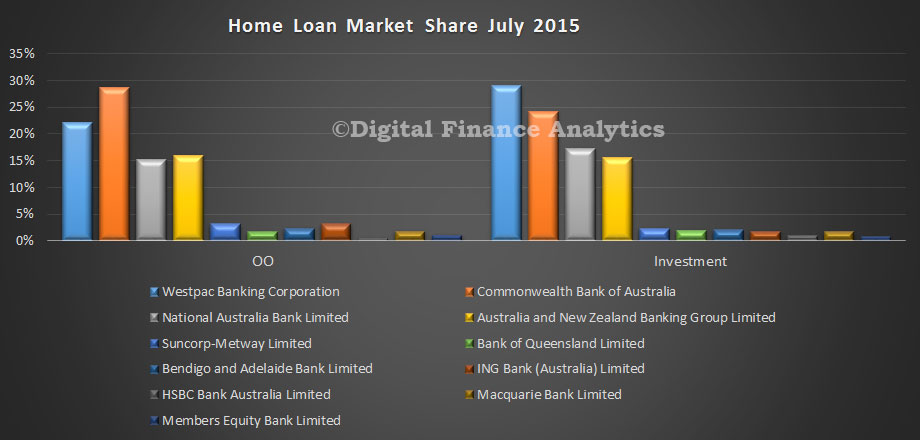
MBSJuly2014HomeLenidngMovementsThe relative market share analysis shows that Westpac has the largest investment portfolio, whilst CBA has the largest owner occupied loan portfolio.

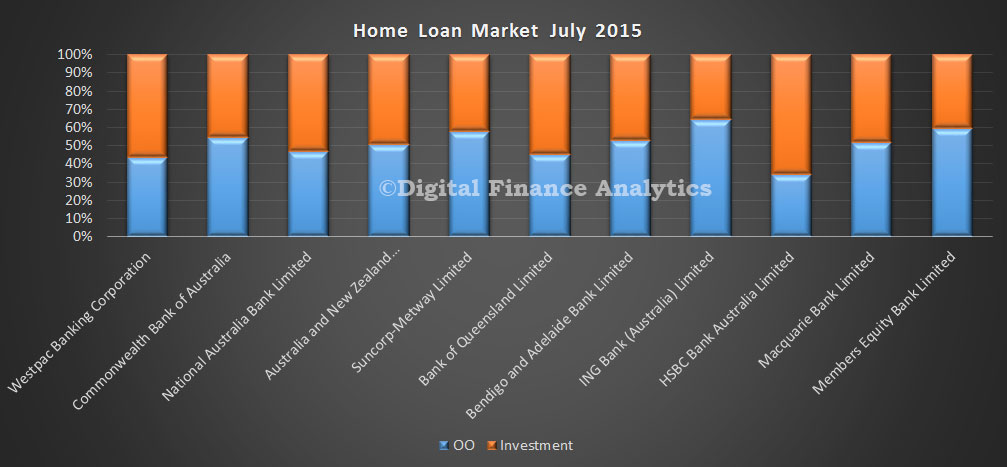
MBSJuly2014HomeLendingSharesIt is also worth looking at the relative percentage splits between owner occupied and investment loans by bank. Westpac and Bank of Queensland have the largest relative proportions, so are under more pressure from the 10% question.

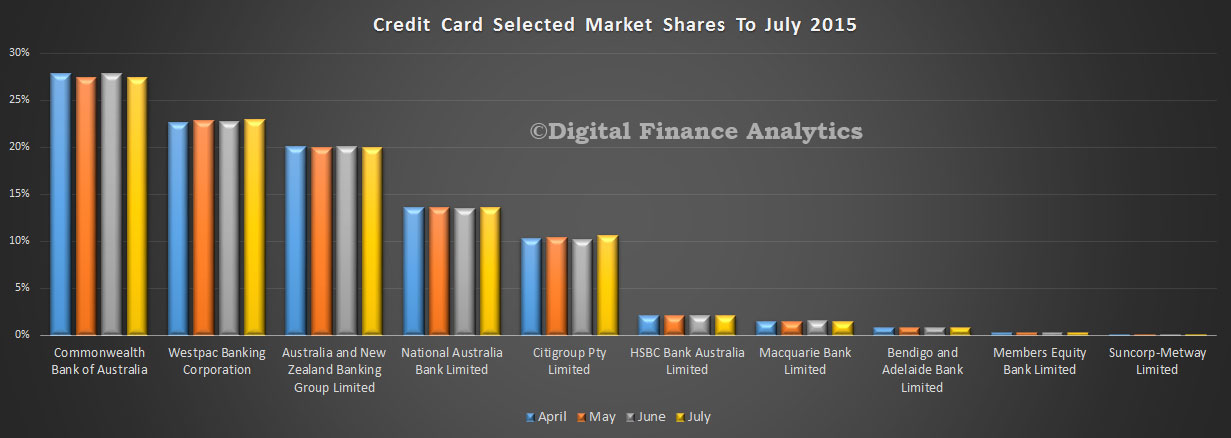
MBSJuly2014HomeLendingSplitsIn the credit card portfolio, total balances were up 1% from $40.4 billion to $40.8 billion. We see small movements in relative share, with CBA loosing a little whilst Westpac and Citigroup grew share slightly.

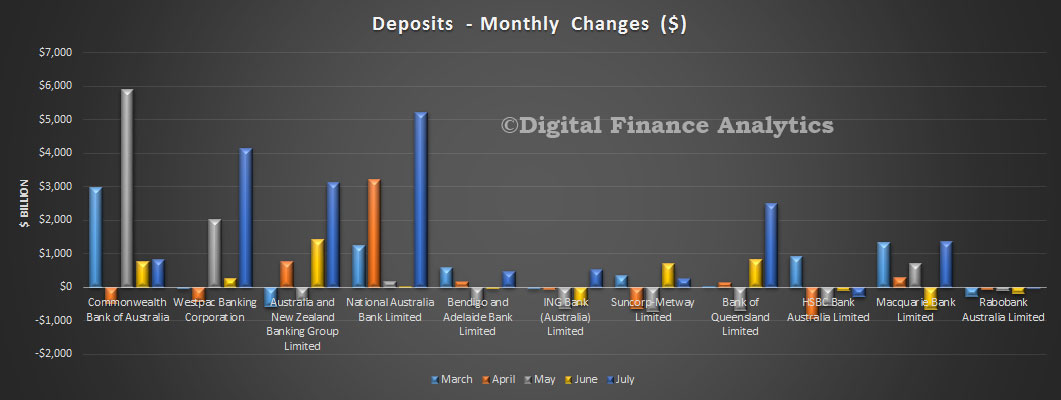
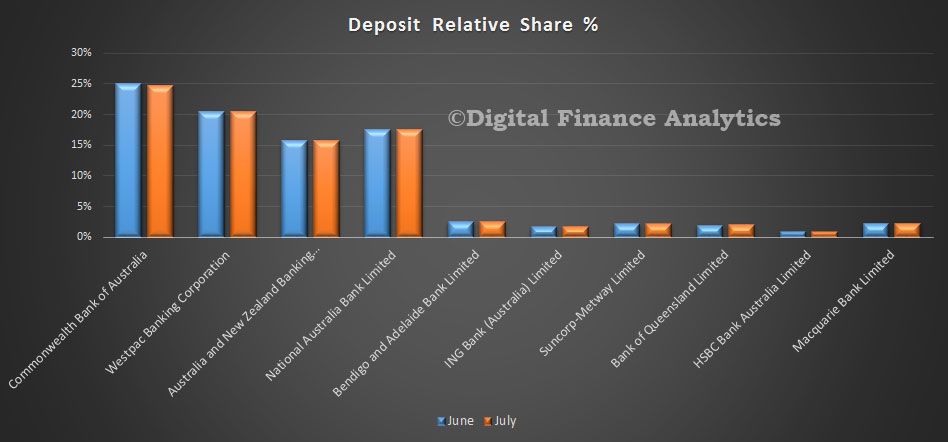
MBSJuly2015CardsFinally, on deposits, we see three of the majors growing their portfolio, with NAB showing the largest inflow.  Total balances grew from $1.83 billion to 1.86 billion, of 1.27%.

MBSJuly2015DepositMovementsRelative deposit share changed just slightly as a result.

MBSJuly2015DepostShares

Lending Finance Still About Housing – Record $35bn in June

The latest ABS data for June 2015, covering all lending, continues to portray the momentum in home finance. In June overall $35bn was lent across all the property sectors, out of an overall $94bn lent across the board. $12.bn was for owner occupied loans, $6bn for refinance (an all time record) and $13.7bn for investment loans. Regulatory intervention is too little too late. The 10% speed limit on investment loans was too high, and its implementation too slow to curb the excesses. Property lending is also concentrated in the eastern states.  The risks are mounting.

Housing-Finance-June-2015-GrossThe total value of owner occupied housing commitments excluding alterations and additions rose 0.1% in trend terms (our preferred measure). Within the housing data, we see that 53% of lending for housing, excluding refinance and unsecured was for investment purposes, a record. Moreover, even if you add in unsecured finance, and refinance, it is still a peak, of 43% of all lending.

FinainceJune2012Looking across all finance categories, the trend series for the value of total personal finance commitments rose 0.5%. Fixed lending commitments rose 1.5%, while revolving credit commitments fell 1.2%. The trend series for the value of total commercial finance commitments fell 0.2%. Fixed lending commitments fell 0.4%, while revolving credit commitments rose 0.5%. The trend series for the value of total lease finance commitments rose 1.0% in June 2015. In this picture, commercial lending includes both fixed and revolving loans. We also show the proportion of fixed loans which are for investment property purposes – its sitting at 37%.

Interestingly, the ABS also notes that

statistics in this publication are currently derived from returns submitted to the Australian Prudential Regulation Authority (APRA) under the Financial Sector (Collection of Data) Act 2001, primarily for use by the Australian Bureau of Statistics (ABS). The ABS anticipates that in the coming months some lenders will revise residential mortgage data reported to APRA. These revisions are expected to result in changes in the proportion of the investment housing statistics relative to owner occupation statistics. It is not expected that aggregate data on lending statistics for housing will change significantly. The ABS is working closely with APRA and affected lenders as they remediate their data and processes.

We may get more “ANZ” type restatements between loan categories.

Investment Lending Highest Ever At 52.8%

The latest housing finance data from the ABS to June 2015 shows continued growth, especially in refinancing and investment lending. Excluding refinance, 52.8% of all loans written in the month were for investment purposes – another record. No sign of any impact of tighter regulation showing yet. Total lending in the month (trend) was $32.2 billion (up 0.16% from last month), of which owner occupied loans were $12.2 billion (down 0.18%), refinance $6.1 billion (up 0.21%) and investment lending $13.7 billion (up 0.75%).  The ABS rolls in refinance into the owner occupied numbers, which overall went up 0.1%.

Housing-Finance-June-2015Within owner occupied loans, the trend changes clearly show that the purchase of new dwellings continues to grow the strongest,  Refinancing was up as a percentage of all lending to 33.2%. Another record.

OO-Housing-June-2015The rate of change of owner occupied refinancing is slowing, along with construction lending and purchased of established dwellings.

OOPCHousngJune2015The number of first home buyer commitments as a percentage of total owner occupied housing finance commitments rose to 15.9% in June 2015 from 15.6% in May 2015. First time buyers were active, with the original number of first time owner occupied borrowers up 6.8%, to 8,737. In addition, we overlay the DFA household survey data of investor first time buyers, which rose by 3.5% in the month to 4,453. Whilst the bulk were in Sydney we are continue to see a rise in investors in other states. As a result the total number of first time buyer transactions was 13,191, up 5.65%.

FTB-Adjusted-June-2015

[Revised] APRA Data Shows Investment Growth Still Strong

Now we have the data from ANZ, we have revised the APRA data sets for the last year, to see the true position with regards to movements in the home loans portfolios. This post revises that made Friday, (though the data is correct based on the released APRA figures.

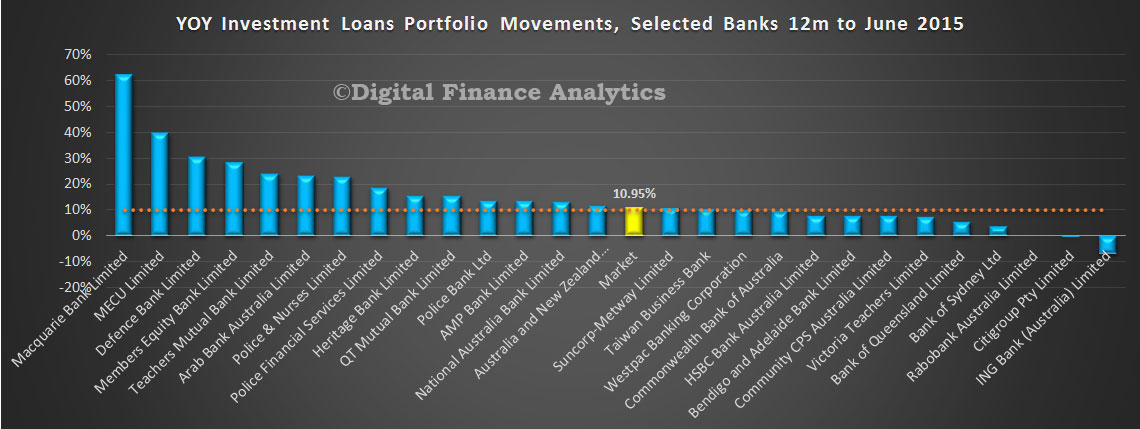
We have adjusted the ANZ and market total lines by the changes ANZ announced late Friday.  As a result, ADI market growth for investment loans is 10.95% (based on the total movements over the 12 months to June 2015). A number of players remain well above the 10% speed limit.

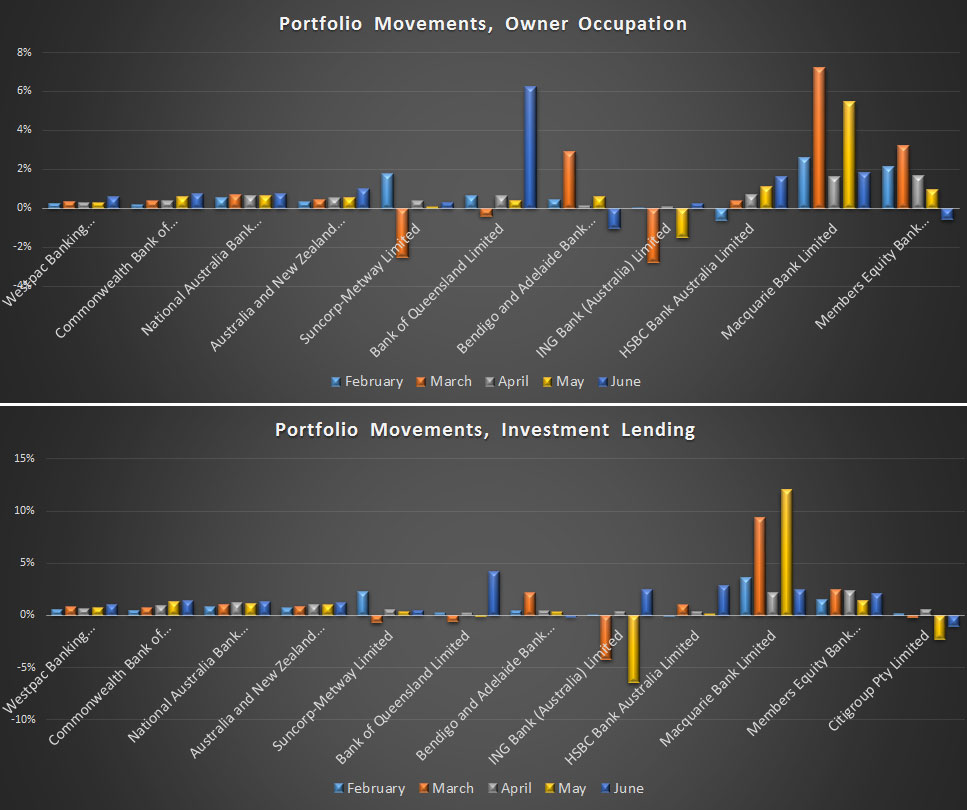
APRA-MBS-June2015-INVGrowthANZTweakThe next charts show the portfolio movements for both owner occupied and investment loans.

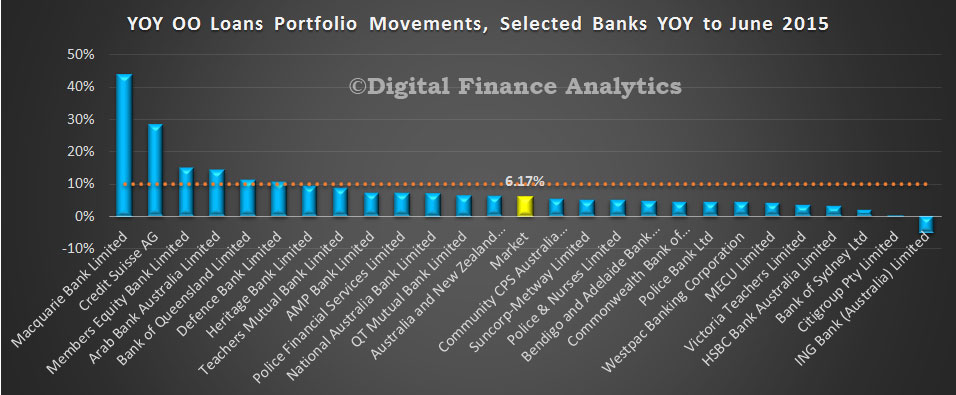
APRA-MBS-June2015-MonMovementANZTweakedFinally, here is the revised owner occupied loans data. Annual growth 6.17%. There is no 10% speed limit from the regulator, but we put the line in for comparison purposes.

APRA-MBS-June2015-OOGrowthANZTweak A final observation, the investment loan growth depends how you calculate it, and where you draw the numbers from. Our preferred approach is to take the growth each month, and add 12 months data together to make the 10.95%. The other approach is to take the data from June 2015, and compare it with July 2014. In that case the market growth is 10.6%. Some analysts gross up the last three months to give annualised rate of over 13%. The RBA data (which includes the non-banks) shows a 12 month growth rate of 10.4% (both original and seasonally adjusted) by summing the monthly changes, or 12.4% if you take the last 3 months data and annualise that. The conclusion is that investment loan growth rates were showing no signs of slowing to June. Lets see what happens in future months.  Also, consider this. APRA imposed the speed limit at 10%, but with no explanation why 10% was a good number. DFA is of the view that the hurdle rate should be significantly lower to have any meaningful impact.