Tweaked Volcker Rule still has teeth, which is credit positive

Last Wednesday, US regulatory agencies (namely the Federal Reserve, Office of the Comptroller of the Currency, the Federal Deposit Insurance Corporation, the Securities and Exchange Commission and the Commodity Futures Trading Commission) jointly proposed changes to simplify and clarify the Volcker Rule and tailor the compliance obligations of US banks, based on their trading activities. The changes are based on several years of regulatory experience applying the Volcker Rule says Moody’s.

For banks with the most trading activity – including Bank of America Corporation, Citigroup Inc., The Goldman Sachs Group, Inc., JPMorgan Chase & Co., Morgan Stanley and Wells Fargo & Company – the proposed changes should reduce the uncertainty about the rule’s enforcement and simplify reporting requirements, which is credit positive for the banks.

The Volcker Rule will continue to prohibit most forms of proprietary trading, which it defines as purchasing or selling financial instruments (exempting of US government securities) with the intent to profit from short-term price movements.

There are three noteworthy proposed amendments to the Volcker Rule. First, to tailor the rule based on the degree of trading risk, banks will be divided into those with gross trading assets and liabilities exceeding $10 billion, those with between $1 billion and $10 billion and those with less than $1 billion – each with varying compliance requirements. The six aforementioned banks will all remain in the category with the most stringent reporting and compliance requirements.

Second, the definition of a trading account will be modified by replacing a “short-term intent” criterion with a more objective criteria that the account be recorded at fair value under applicable accounting standards. Finally, measurement of reasonably expected near-term demand (RENTD) is being modified. Under the existing rule, to be exempt from the ban on proprietary trading a bank must demonstrate that its purchase and sale of financial instruments relating to market-making and underwriting activities does not exceed RENTD. In practice, this has been difficult to demonstrate and may have contributed to banks’ reluctance to use the underwriting and market-making exemptions. Under the proposed amendments, a bank will be presumed to have stayed within RENTD if it implements, maintains and enforces internal risk limits surrounding its market-making and underwriting activities.

For the most active trading banks, added certainty about the provisos of the Volcker Rule should make it cheaper and easier to comply with the rule and provide greater certainty about allowable market-making and underwriting activities. At the same time, it may also make it easier for regulators to enforce the rule – and maintain a regulatory guardrail that protects creditors against the risk that banks drift into proprietary trading away from their core market-making activities.

A clarified Volcker Rule that is easier to comply with and enforce, when combined with other post-crisis regulatory enhancements that still require banks to hold greater amounts capital and liquidity for less liquid and more volatile exposures (including the Basel III capital and liquidity framework, the Dodd-Frank Stress Tests, and the Fed’s Comprehensive Capital Analysis and Review), is a credit-positive development.

Higher US Mortgage Yields Offset Lowest Jobless Rate Since 2000

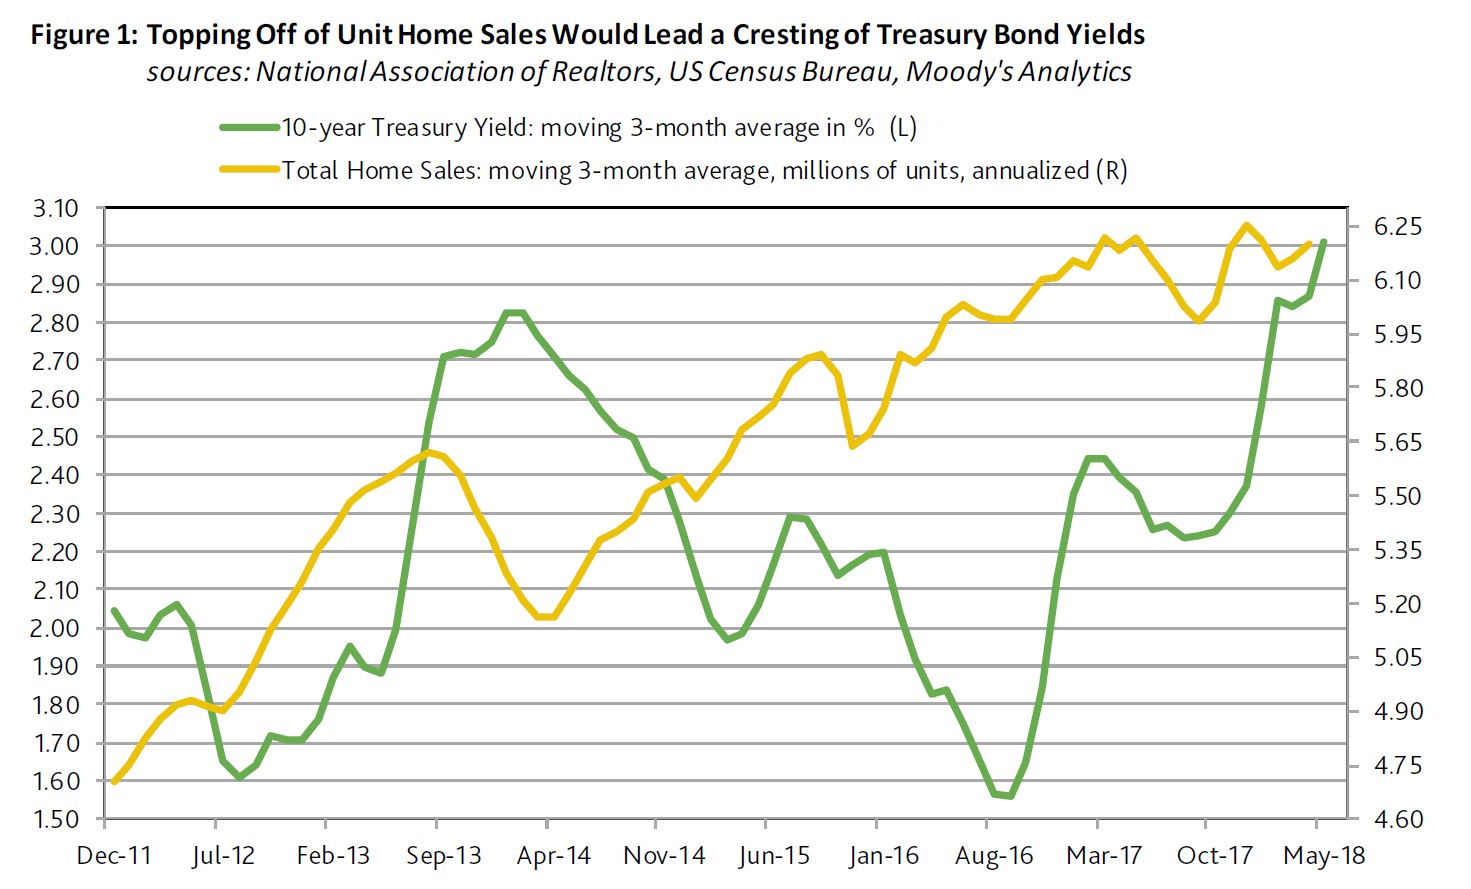
The return of a 3% 10-year Treasury yield is making itself known in the housing industry. Markets have already priced in a loss of housing activity to the highest mortgage yields since 2011, according to Moody’s. They conclude that just as it is overly presumptuous to predict the nearness of a 4% 10-year Treasury yield, it is premature to declare an impending top for the benchmark Treasury yield.

Thus far in 2018, the 11% drop by the PHLX index of housing-sector share prices differs drastically from the accompanying 3% rise by the market value of U.S. common stock. In addition, the CDS spreads of housing-related issuers show a median increase of 78 bp for 2018-to-date, which is greater than the overall market’s increase of roughly 23 bp. Finally, 2018-to-date’s -1.97% return from high-yield bonds is worse than the -0.13% return from the U.S.’ overall high-yield bond market. Despite the lowest unemployment rate since 2000, the sum of new and existing home sales dipped by 0.7% year-over-year during January-April 2018. Unit home sales may not soon accelerate by enough to strengthen the case for higher Treasury yields. First-quarter 2018’s average index of pending sales of existing homes contracted by 11.5% annualized from 2017’s final quarter on a seasonally-adjusted basis, while shrinking by 3.7% year-over-year before seasonal adjustment. The recent record suggests that the 10-year Treasury yield will ultimately follow home sales.

March 2018’s 7% yearly drop by the NAR’s index of home affordability showed that the growth of after tax income was not rapid enough to overcome the combination of higher home prices and costlier mortgage yields. March incurred the 17th consecutive yearly decline by the home affordability index. The moving three-month average of home affordability now trails its current cycle high of the span-ended January 2013 by 23%.

Fewest Applications for Mortgage Refinancings since 2000

The highest effective 30-year mortgage yield in seven years has depressed applications for mortgage refinancings. For the week-ended May 18, the MBA’s effective 30-year mortgage yield reached 5.01% for its highest reading since the 5.04% of April 15, 2011. The effective 30-year mortgage yield’s latest fourweek average of 4.95% was up by 63 bp from the 4.32% of a year earlier.

The yearly increase by the effective 30-year mortgage yield’s moving four-week average last swelled by at least 63 bp during the span-ended July 12, 2013. The 10-year Treasury yield’s month-long average would climb from July 2013’s 2.56% to a December 2013 peak of 2.89%. Thereafter, a decline by unit home sales had helped to lower the 10-year Treasury yield to 2.53% by July 2014.

As of May 18, 2018, the Mortgage Bankers Association’s seasonally-adjusted weekly index of applications for mortgage refinancings sank to its lowest reading since December 29, 2000. Nevertheless, it should be noted that the MBA commenced a new sample on September 16, 2011. During the four-weeks-ended May 18, applications for mortgage refinancings sank by 19.6% year-overyear.

Moreover, the latest moving 13-week average of applications for mortgage refinancings is a very deep 77.8% under its current cycle high of October 12, 2012. By contrast, mortgage applications from prospective homebuyers are holding up much better. During the four weeks ended May 18, the MBA’s average index for homebuyer mortgage applications dipped by 0.9% from the contiguous four-weeks-ended April 20, 2018, as the year-over-year increase slowed from April 20’s 6.6% to May 18’s 3.5%.

The sum of new and existing sales of single-family homes sank annually in only nine of the calendar years since 1988. In eight of those nine years, the 10-year Treasury yield’s yearlong average fell in the following calendar year. For the nine years following a drop by single-family home sales, the median annual change for the 10-year Treasury yield’s yearlong average was -41 bp.

In summary, the longer that higher interest rates weigh on business activity and financial markets, the closer is a peak for bond yields. Nonetheless, just as it is overly presumptuous to predict the nearness of a 4% 10-year Treasury yield, it is premature to declare an impending top for the benchmark Treasury yield.

Singapore banks will benefit from regulatory push to strengthen artificial intelligence capabilities

From Moody’s

On Monday, the Monetary Authority of Singapore (MAS) announced that it is collaborating with the Economic Development Board (EDB), Infocomm Media Development Authority (IMDA) and Institute of Banking and Finance (IBF) to accelerate the adoption of artificial intelligence (AI) in the financial sector. The four agencies will jointly facilitate research and development of new AI technologies and adoption of AI-enabled products, services and processes. The effort will encompass three key initiatives: developing AI products, matching users and solution providers and strengthening AI capabilities.

The increased use of AI and data analytics by financial institutions, including Singapore’s three-largest banks, DBS Bank Ltd., Oversea-Chinese Banking Corp. Ltd. and United Overseas Bank Limited (UOB, will help them achieve greater operational cost efficiencies and tap new revenue opportunities, and is positive for their profitability. In addition, the banks will also benefit from a greater number of financial technology (fintech) companies with AI capabilities with which they can work to strengthen AI capabilities in their digital transformation.

In the collaborative effort, the EDB will augment MAS’ Artificial Intelligence and Data Analytics programme by providing support for AI solution providers locally and globally to conduct both upstream research and product development activities and create new AI products and services for Singapore’s financial sector. The MAS will work with EDB and IMDA to facilitate link-ups between companies in the financial and technology sectors, and pair local companies seeking AI solutions with credible AI solutions providers. The MAS will work closely with IBF and IMDA to equip financial industry professionals with the necessary skill set to transition into new jobs arising from the use of AI in financial services.

As part of their digital transformation, the three Singapore banks already have adopted the use of AI and analytics across various parts of their organizations and businesses. According to the banks’ managements, leveraging AI technology, for instance for machine learning and data analytics, has allowed them to automate repetitive and time-consuming manual tasks and processes, strengthen their risk management capabilities in handling complex surveillance activities and improve the productivity of their sales force and marketing efforts.

In November 2017, UOB reported that it adopted robotic process automation to handle repetitive data entry and computation tasks for its trade finance operations and retail unsecured loan processing function, which were able to substantially cut down processing time compared with the time taken to complete the tasks manually. Also in November 2017, OCBC unveiled its plans to work with fintech company ThetaRay to implement an algorithm-based solution to detect suspicious transactions in its anti-money laundering monitoring. According to the bank, the accuracy of identifying suspicious transactions increased by more than four times using the new technology.

OCBC also set up an AI-powered chatbot application in April 2017 that is able to address customer questions and compute debt-servicing requirements. The application managed to convert customer enquiries into new loan approvals totaling more than SGD100 million in 2017.
DBS reported that its sales productivity improved after relationship managers were provided with customer analytics on a mobile platform, raising the income per head by 57% over three years.

We expect Singapore’s banks to remain committed to their digital growth strategies to keep pace with customer expectations for more digital services and solutions, and remain competitive given the increasing number of fintech companies in the ecosystem. At the same time, we expect that banks will actively engage fintech companies in collaborative ventures to enhance their digital capabilities.

Regulator’s governance concerns at Commonwealth Bank of Australia are credit negative

From Moody’s.

On Tuesday, the Australian Prudential Regulation Authority (APRA) released the results of its prudential inquiry into Commonwealth Bank of Australia, which cited its concerns about the bank’s management of non-financial risks and made recommendations to address those issues. APRA also will apply a capital adjustment by adding AUD1 billion to CBA’s operational risk capital requirement until it is satisfied that CBA has addressed the recommendations. APRA’s inquiry results are credit negative for CBA because it exposes the bank to reputational damage and costs associated with addressing its shortcomings. Additionally, the capital adjustment will lower CBA’s Common Equity Tier 1 ratio to a pro forma 10.1% as of year-end 2017 from an actual 10.4%.

APRA’s report noted that CBA’s continued financial success negatively affected the bank’s ability to manage its operational, compliance and conduct risks. In particular, the report highlighted the board and its committees’ inadequate oversight of emerging non-financial risks; unclear accountabilities, starting with a lack of ownership of key risks; weaknesses in how issues, incidents and risks were identified and escalated and overly complex and bureaucratic decision-making processes. The report cited an operational risk-management framework that worked better on paper than in practice, supported by an immature and under-resourced compliance function. In addition, APRA criticized the bank’s remuneration framework, which before the prudential inquiry began in August 2017, had few consequences for senior management for poor risk management and compliance performance.

The report made 35 recommendations to strengthen the bank’s governance, accountability and culture, and gave the bank 60 days to provide a remedial action plan to APRA. An independent reviewer will be appointed to provide quarterly updates to APRA on CBA’s progress. The recommendations are focused on five key areas: more rigorous board- and executive-committee-level governance of non-financial risks; exacting accountability standards reinforced by remuneration practices; a substantial upgrade of the authority and capability of the operational risk management and compliance functions; questioning the appropriateness of all dealings with and decisions on customers; and cultural changes that aim for best practices in risk identification and remediation.

APRA began the inquiry after a number of incidents that have negatively affected the bank’s reputation. In August 2017, the Australian Transaction Reports and Analysis Centre began proceedings against CBA for non-compliance of the Anti-Money Laundering and Counter-Terrorism Financing Act. The same month, the Australian Securities and Investments Commission (ASIC) announced that CBA would refund more than 65,000 customers a total of approximately AUD10 million after selling them unsuitable consumer credit insurance. In March 2016, the bank’s life insurance business, CommInsure, was accused of deliberately avoiding or delaying paying claims to its customers (ASIC cleared CommInsure of any breaches of the law in March 2017). In 2014, CBA announced a review into the poor quality of advice and compliance breaches by its financial planning businesses.

The report comes against a backdrop of the ongoing Royal Commission into Misconduct in the Banking, Superannuation and Financial Services Industry, which has identified conduct and culture challenges at some of Australia’s largest financial institutions. We note that the franchise dominance of Australia’s major banks and their exceptionally low credit costs during an extended period of low interest rates may have elevated the risk of complacency in their approach to operational and governance risks.

APRA Contains Risk From Removal of Investor Lending Restrictions

Interesting to read Moody’s assessment of APRA’s changed stance relative to the 10% speed limit for investor loans in “Australia’s tighter bank regulation will contain risk from removal of investor lending restriction, a credit positive.”  Overall they see the underwriting standards rising, reducing risk, though they recognize some potential to lift investment loan volumes, which are inherently more risky.

Last Thursday, the Australia Prudential Regulation Authority (APRA) announced its intention to remove the current 10% limit on investor loan growth, replacing it with additional requirements for bank boards to comply with APRA’s guidelines for lending policies and practices. Although removal of the cap on investor loan growth will likely spur growth in investor lending, which we view as more risky than lending to owner occupiers, APRA’s increased oversight to ensure that bank underwriting continues to strengthen contains the risk, a credit positive.

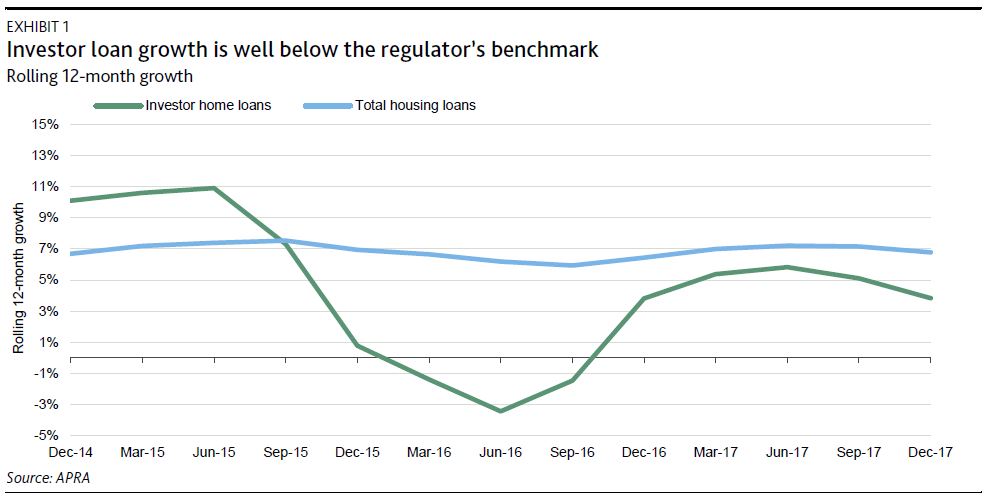
For a bank to gain an exemption from the limit on investor loan growth, the bank’s board must confirm that it has operated below the 10% limit for at least the past six months. As shown in Exhibit 1, investor loan growth for the banking system has been running at well below 10%.

The board also will have to provide written confirmation that lending policies meet APRA’s guidance on serviceability assessments as set out in Prudential Practice Guide APG 223 – Residential Mortgage Lending (APG 223). In particular, bank’s underwriting will need to include interest rate buffers comfortably above two percentage points and interest rate floors comfortably above 7%, which must apply to a borrower’s new and existing debt; haircuts on uncertain and variable income, such as, for example, at least a 20% haircut on nonsalary and rental income; and for interest-only loans, an assessment of serviceability for the remaining principal and interest repayments after the interest-only term.

Furthermore, the board also must confirm that lending practices meet APRA’s guidance on the assessment of borrower financial information and management of overrides, as set out in APG 223. In particular, banks will need to commit to the following:

  • Improved collection of a borrower’s expenses to reduce reliance on benchmark estimates such as the Household Expenditure Measure
  • Strengthen controls to verify a borrower’s existing debt and prepare to participate in the new comprehensive credit reporting regime that takes effect 1 July 2018. Under the new regime, information shared by banks on a customer’s credit history will be expanded beyond just reporting negative behaviour to provide a more balanced assessment
  • Setting risk tolerances on the extent of overrides to lending policies
  • Develop limits on the proportion of new lending at high debt-to-income levels (where debt is greater than 6x a borrower’s income), and policy limits on maximum debt-to-income levels for individual borrowers

We consider APRA’s increased focus on lending policies and practices a strong mitigant against the risk of a significant rise in investor lending. Indeed, APRA has cautioned that a return to more rapid rates of investor loan growth could warrant the application of a countercyclical capital buffer or some other industrywide measure.

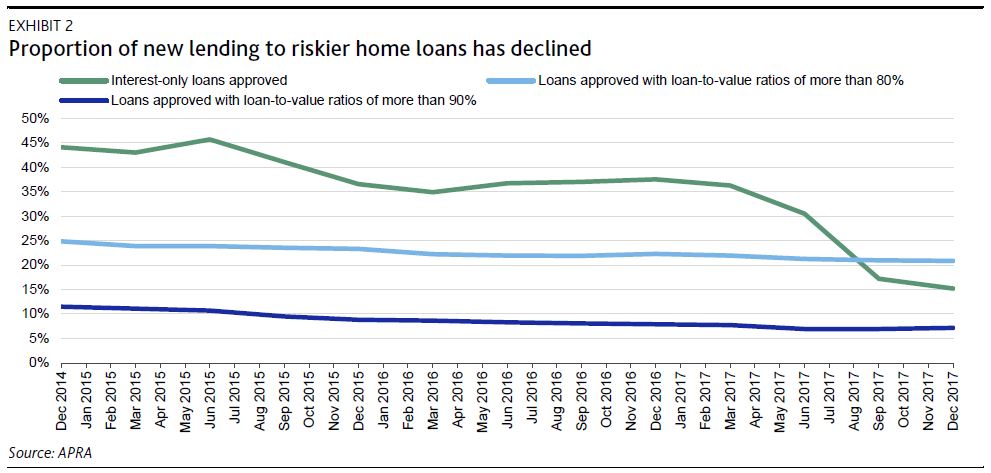
Furthermore, APRA’s announcement reflects its recognition that since the introduction of the limit in December 2014, banks’ loan underwriting and lending practices have improved, as reflected by the decline in investor interest-only and high loan-to-value lending (see Exhibit 2). APRA also cited strengthening bank capitalisation, which has been supported by higher regulatory capital requirements.

Banks will have until 31 May 2018 to provide all necessary confirmations for the removal of the investor loan growth benchmark on 1 July 2018.


Who to Blame for the Flattening Yield Curve

From Moody’s

The U.S. economy is humming along, but we believe that the economy will weaken and likely fall into recession sometime in 2020 as the boost from the fiscal stimulus fades. There is considerable uncertainty in the timing of the next recession, but the U.S. bond market increases our concerns about the economy in the next couple of years.

Since the mid-1960s, the yield curve, or the difference between the 10-year Treasury yield and three month yield, has been nearly perfect in predicting recessions. On average a recession occurs 15 months after the yield curve inverts. The shortest time between an inversion and a recession was eight months in the early 1970s. The longest was 20 months in the late 1960s. It has given only one false signal, in 1966, when a slowdown—but not an official recession—followed an inversion.

Assuming our forecast for the next downturn is correct, the yield curve should invert late this year or early next. Further flattening in the yield curve doesn’t alter our forecast for GDP growth this year, but it does pose some downside risk. As the yield curve flattens, it could weigh on the collective psyche, particularly among investors. Investors are a fickle bunch, and the further flattening in the yield curve could increase the odds of a sudden decline in stock prices, which if significant and persistent could have noticeable economic costs.

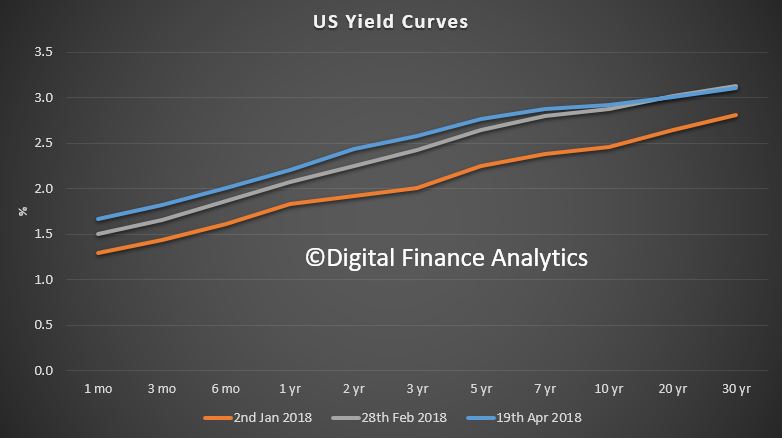
Knowing why the yield curve is flattening is important in assessing whether there should be concern about growth this year and early next. If it is because the lower long-term rates are fueled by concerns about U.S. growth, that would raise a red flag. This doesn’t appear to be the case now, because the 10-year U.S. Treasury yield has been hovering generally between 2.8% and 2.9% since the beginning of February and is up 40 basis points since the end of 2017. Therefore, the flattening in the yield curve is coming from the short end, which has put the focus on the Fed. But the central bank is only part of the story.

The flattening in the yield curve is less troubling for the economy in the very short run if it’s occurring because the economy is doing well and the Fed is raising short-term rates while the long-term rate continues to be depressed by the size of the Fed’s and other global central banks’ balance sheets.

It doesn’t appear that the dynamics for long-term rates will change significantly soon, so the next rate hike by the Fed, likely in June, will flatten the yield curve further. Therefore, the Fed will feel the heat for flattening the yield curve, potentially fanning concerns that it is headed for a policy mistake that will end this expansion.

However, the Fed isn’t the only reason that the yield curve is flattening. The Treasury Department has ramped up its issuance in anticipation of a higher deficit from last year’s tax overhaul and a two-year budget deal that will increase federal spending over the next two years. Over the past few months, Treasury net issuance of bills has spiked. Net issuance of bills in March was $211 billion following a net $111 billion in February. The increase in supply has driven short-term interest rates higher. In fact, prior to the Fed rate hike in March, the spread between the three-month Treasury bill and the fed funds rate was the widest over the past 15 years.

We see the odds rising that the yield curve inverts by the end of this year. This would increase the odds of a recession in the subsequent 12 months.

Elevated US Leverage and Rate Rises

Markets are beginning to ask whether companies will be capable of passing on higher costs to the U.S.’ less than financially robust middle class, according to Moodys.

The U.S.’ still relatively low personal savings rate questions how easily consumers will absorb recent and any forthcoming price hikes. Moreover, the recent slide by Moody’s industrial metals price index amid dollar exchange rate weakness hints of a leveling off of global business activity.

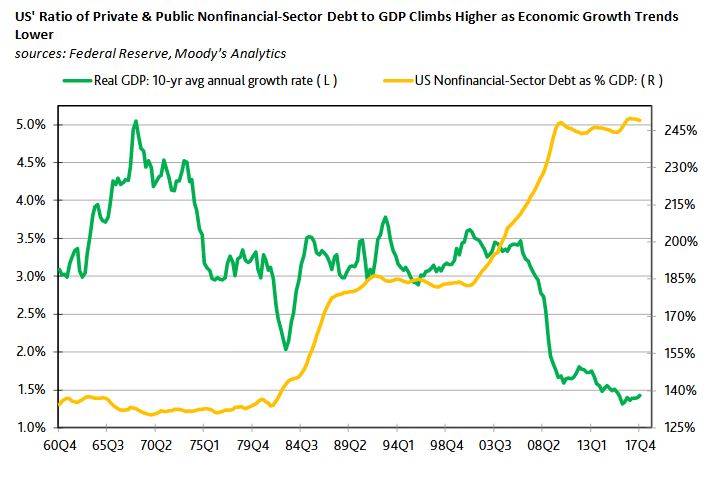
Missing from last week’s discussion of a record ratio of U.S. nonfinancial-corporate debt to GDP was any mention of 2017’s near-record high ratio of total U.S. private and public nonfinancial-sector debt relative to GDP. The yearlong averages of 2017 showed $49.05 trillion of total nonfinancial-sector debt and $19.74 trillion of nominal GDP that put nonfinancial-sector debt at 249% of GDP—or just a tad under 2016’s record 250%.

The leveraging up of the U.S. economy has coincided with a downshifting of U.S. economic growth. From 1961 through 1979, U.S. real GDP expanded by an astounding 3.9% annually, on average, while total nonfinancial-sector debt approximated 133% of nominal GDP. When real GDP’s average annual rate of growth eased to the 3.2% of 1979-2000, the ratio of nonfinancial-sector debt to GDP rose to 176%. Since the end of 2000, U.S. economic growth has averaged only 1.8% annually and, in a possible response to subpar growth, nonfinancial-sector debt has soared to 232% of GDP

High Systemic Leverage Reins in Benchmark Yields

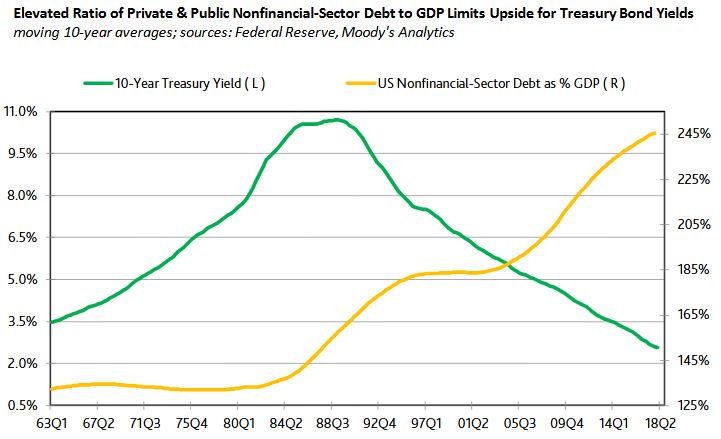
Over time, the record shows that the climb by the moving 10-year ratio of nonfinancial-sector debt to GDP has been accompanied by a declining 10-year moving average for the 10-year Treasury yield. For example, as the moving 10-year ratio of debt to GDP rose from 1997’s 183% to 2017’s 245%, the 10-year Treasury yield’s moving 10-year average fell from 7.31% to 2.59%.

Two factors may be at work. First, lower interest rates encourage an increase in balance-sheet leverage. Second, to the degree an elevated ratio of debt to GDP heightens the economy’s sensitivity to an increase in interest rates, lofty readings for leverage limit the upside for interest rates. Moreover, as shown by the historical record, if higher leverage tends to occur amid a slower underlying pace of economic growth, then the case favoring relatively low interest rates amid high leverage is strengthened.

None of this dismisses the possibility of an extended stay above 3% by the 10-year Treasury yield. Instead, today’s record ratio of debt to GDP warns of greater downside risk for business activity whenever interest rates enter into a protracted climb.

NSW Property Prices To “Correct” ~10% – Moody’s

As reported in the Business Insider, Moody’s Investor Services thinks there will be further declines to come, suggesting that Sydney prices will suffer a “correction” in the year ahead.

“Incomes in NSW have increased faster than the national average and underpin some of the recent gains in home values,” Moody’s says, pointing to the chart below. “However, housing values have risen even faster and are overvalued relative to equilibrium value. Therefore, Moody’s Analytics expects a correction across NSW.”

Higher asset threshold for US SIFI designation will ease some banks’ regulatory oversight, a credit negative

From Moody’s

Last Wednesday, the US Senate passed the Economic Growth, Regulatory Relief, and Consumer Protection Act. A key component of this bill increases the asset threshold for a bank to be designated a systemically important financial institution (SIFI) to $250 billion of total consolidated assets from $50 billion, the threshold defined in the Dodd-Frank Act of 2010.

For US banks with assets of less than $250 billion, the higher asset threshold for SIFI designation is likely to lead to a relaxation of risk governance and encourage more aggressive capital management, a credit-negative outcome.

SIFI banks are subject to the enhanced prudential standards of the US Federal Reserve (Fed). The regulatory oversight of SIFIs is greater than for other banks, and SIFIs participate in the Fed’s annual Dodd-Frank Act stress test (DFAST) and the Comprehensive Capital Analysis and Review (CCAR), which evaluate banks’ capital adequacy under stress scenarios. Furthermore, transparency will decline with fewer participants in the public comparative assessment the stress tests provide.

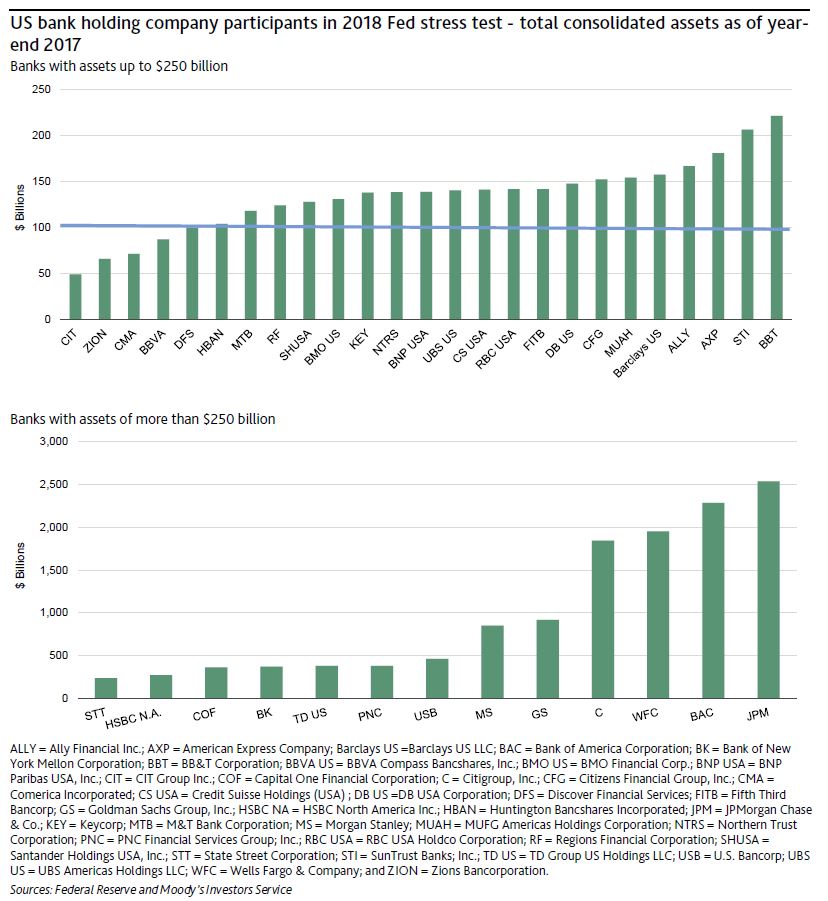
In 2018, the 38 bank holding companies shown in the exhibit below are subject to the Fed’s annual capital stress test. Passage of the bill into law would immediately exempt four banks with less than $100 billion of assets from the Fed’s enhanced prudential standards, which includes the stress test and living will requirements. These banks will have the most leeway in relaxing risk governance practices and managing their capital.

The 21 banks at the right of the top exhibit that have assets of $100-$250 billion1 could become exempt from enhanced prudential standards 18 months after passage of the bill into law. However, the Fed will have the authority to apply enhanced oversight to any bank holding company of this asset size and will still conduct periodic stress tests. In the 18 months after passage into law, it will be up to the Fed to develop a more tailored enhanced oversight regime for the $100-$250 billion asset group. The Fed also could continue to apply the same enhanced prudential standards. Therefore, it is difficult to assess the potential for their easier risk governance practices until more about the regulatory oversight is known.

If many of these banks are no longer required to participate in the public stress tests, it would reduce transparency. The quantitative results of DFAST and CCAR provide a relative rank ordering of stress capital resilience under a common set of assumptions. The loss of such transparency is credit negative.

For the largest banks, those with more than $250 billion in assets that remain SIFIs, there are no changes in the Fed’s supervision. The bill also specifies that foreign banking organizations with consolidated assets of $100 billion or more are still subject to enhanced prudential standards and intermediate holding company requirements.

In order to become law, the bill must also be passed by the US House of Representatives and signed by the president. This year’s annual Fed stress test will proceed as usual with submissions by the banks due 5 April, with results announced in June.


Norwegian parliament’s debate of Bank Recovery and Resolution Directive is credit negative for banks

From Moody’s.

Last Tuesday, Norway’s parliament began debating proposed legislation to implement the Bank Recovery and Resolution Directive (BRRD) and an amended deposit guarantee scheme.

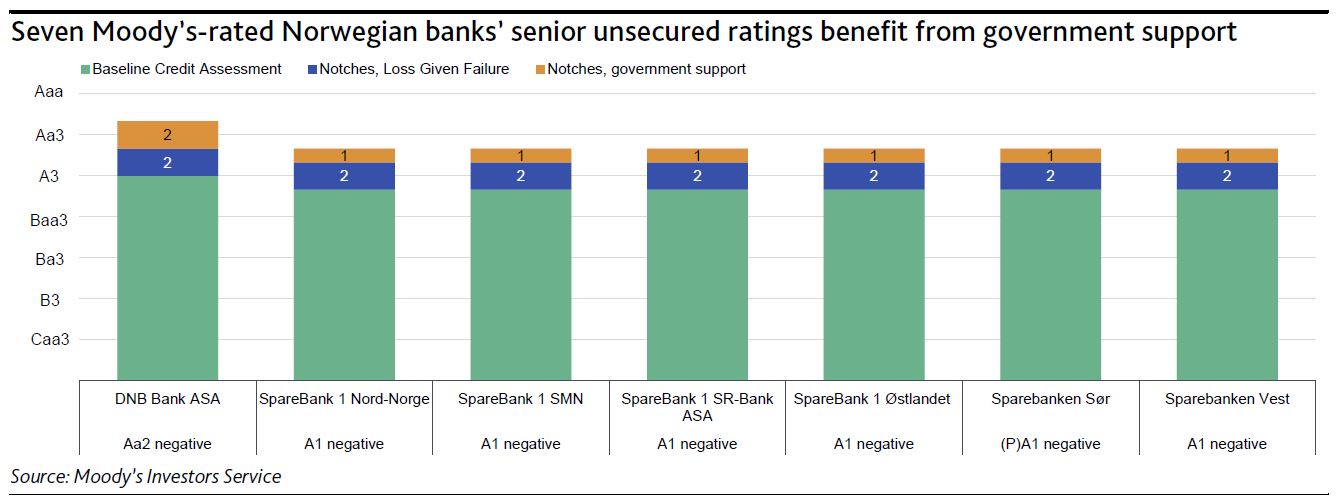
The intention of the BRRD law is to promote financial stability and ensure that losses are borne by a bank’s shareholders and creditors rather thantaxpayers. Although the first reading in parliament concluded with a unanimous vote in favour for the proposal, a second reading (at least three days after the initial reading) is required before the bill can be transposed into Norwegian law. The BRRD law’s enactment, which we expect within the next few weeks, would be credit negative for seven of the 17 Norwegian banks we rate because it would reduce the probability that they would receive government support in case of need.

In line with the European Union’s (EU) BRRD, the proposed legal framework features recovery and resolution plans for banks, early intervention measures and resolution tools including the bail-in of creditors. Additionally, the proposal includes small changes to the current deposit guarantee scheme to align it with that of the EU. However, in contrast to the EU’s deposit guarantee scheme limit of €100,000 per depositor per bank, the Norwegian Ministry of Finance has proposed maintaining its current coverage of NOK2 million (approximately €200,000) per depositor in each bank.

The bail-in tool is a central feature in the BRRD framework, intended to reduce the need for government intervention in failing banks. Consequently, government support is less likely for Norwegian banks since bail-in can be used to recapitalise financial institutions and absorb losses.

We assigned negative outlooks to those banks’ ratings following the submission of the legislative proposal in June 2017 in anticipation of the law’s passage, and the eventual moderation of our government support assumptions, which likely will lead us to remove the one-notch rating uplift incorporated into the banks’ ratings.

We expect Norway’s implementation of BRRD to be followed by a minimum requirement for own funds and liabilities (MREL) for each bank within the next 12 months. Nevertheless, no relevant details have been disclosed yet, although the BRRD proposal includes MREL requirements in line with the EU’s BRRD.

We expect Norwegian banks that will be subject to MREL requirements to gradually change their funding plans by raising non-preferred senior debt instruments in order to be compliant. This likely will provide senior unsecured creditors additional protection against potential losses, which eventually could counterbalance the negative rating effect on banks from revised government support assumptions.