Wealth Management A Risk To Wells Fargo

Wells Fargo’s review of its wealth management business threatens to broaden its reputational damage, according to Moody’s.

Last Thursday, Wells Fargo & Company filed its annual 10-K report with the US Securities and Exchange Commission. The report disclosed the existence of an ongoing review by Wells Fargo’s board of directors into potentially inappropriate referrals or recommendations at its Wealth and Investment Management (WIM) business, as well as a separate company review of fee calculations within WIM that resulted in overcharges for some customers. The existence of these reviews is credit negative.

Before last week’s disclosures, Wells Fargo’s inappropriate sales practices centered on its large retail banking operations. Since September 2016, when Wells Fargo first announced regulatory settlements related to retail banking sales misconduct, the bank has also disclosed issues in its auto lending business and in its assessment of fees for mortgage rate-lock extensions. These disclosures have resulted in significant reputational damage.

Consequently, we believe Wells Fargo’s reputation would suffer further if inappropriate practices were found in its nationwide WIM business.

Wells Fargo has made rebuilding trust its top priority, and over the past year and a half has taken numerous credit-positive steps to strengthen its governance and risk oversight. However, the widespread nature of Wells Fargo’s wrongdoing also resulted in a broadly publicized consent order with the US Federal Reserve that restricts the bank from growing its balance sheet beyond its year-end 2017 size and calls for more enhancements to its governance and risk management.

These circumstances, and the heightened scrutiny that Wells Fargo faces, magnify each additional revelation of inappropriate practices. Therefore, although the newly disclosed reviews into Wells Fargo’s WIM business are in their preliminary stages, we believe they undermine the bank’s effort to rebuild trust.

Moreover, the board’s review into whether there have been inappropriate referrals or recommendations affecting WIM’s brokerage and other customers was initiated in response to inquiries from US government agencies, raising the possibility of another regulatory sanction at the conclusion of the review. Similarly, Wells Fargo’s filing highlighted a separate internal review of policies, practices and procedures in its foreign-exchange business that is also a response to inquiries from government agencies.

Wells Fargo’s 10-K also included a report from its auditor, KPMG, in which KPMG expressed an unqualified opinion on Wells Fargo’s financial statements and an unqualified opinion on the effectiveness of its internal controls over financial reporting. This is positive because it indicates that Wells Fargo’s auditors do not believe the bank’s aggressive sales practices compromised its financial reporting in any material respect.

Norway Tightens Mortgage Regulation

Norway, one of the countries mirroring the Australian mortgage debt bubble (223%) has taken steps to tighten mortgage lending further. This includes a limit of 5x gross annual income and a 5% interest rate buffer.

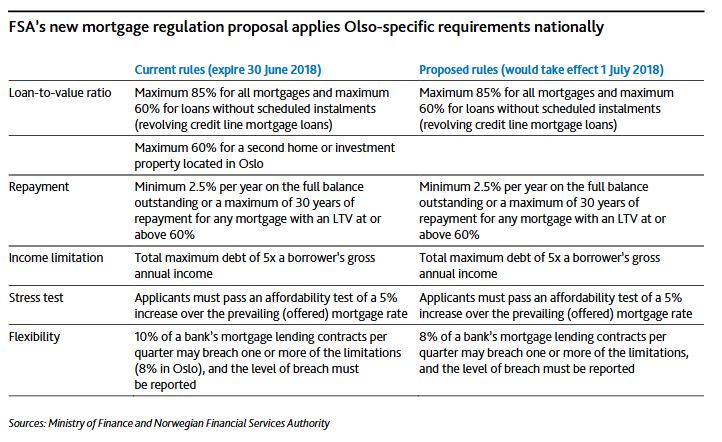
According to Moody’s, last Wednesday, the Norwegian Financial Services Authority (FSA) proposed to the Ministry of Finance a new regulation on requirements for residential loans. The proposed national regulation is based on existing and Oslo-specific policy measures introduced in January 2017 and scheduled to expire 30 June 2018 that cap the portion of a mortgage that does not comply with the national applicable loan-to-value (LTV) ratio limit at 8% from 10% previously. Extending these measures past their scheduled expiration will contain borrower leverage, a structural risk for Norway’s banking sector, and dampen house price inflation, both credit positive.

The proposal maintains the maximum LTV for home equity credit lines at 60%, continues to cap the LTV on mortgages at 85%, and leaves unchanged the limit on borrowers’ aggregate debt at 5x gross annual income. However, the FSA suggests eliminating the existing LTV limit of 60% for secondary homes located in Oslo (see exhibit).

Household debt reached a record 223% of disposable income in June 2017, far above that of other Nordic countries, and we expect it to remain close to current levels over the next 12-18 months. This trend remains a structural risk for Norway’s banking sector.

Although the Ministry of Finance will make the final decision on whether to accept the recommendation and in what form, the proposal is a step to improve mortgage underwriting standards by containing borrower leverage. Norwegian banks are retail focused, with mortgages accounting for almost 50% of their total lending. The proposed expansion of the previously Oslo-specific measures will improve banks’ asset quality and increase mortgage competition in Oslo. Smaller regional banks will be able to compete for mortgages in Oslo with DNB Bank ASA (Aa2/Aa2 negative, a34), which has the largest share of Oslo’s retail market, because they will be able to account for deviations from the suggested LTV limits against their entire loan book rather than the small share of Oslo-originated loans in accordance with current regulation.

House prices in Norway have declined 4.2% since peaking in March 2017. The decline followed the Ministry of Finance’s 2017 implementation of tighter mortgage lending criteria in response to accelerating property price inflation and rising household indebtedness. The restrictions have cut demand for investment properties in large city centres, particularly the Oslo metropolitan area, where house prices have grown fastest in recent years.

US Debt Will Grow, But It’s Mostly Government Borrowing

Moody’s says a possible $975 billion increase in U.S. government debt for fiscal 2018 would leave Q3-2018’s outstanding federal debt up by 5.9% annually. As of Q3-2017, federal debt outstanding grew by $597
billion, or 3.8%, from a year earlier.

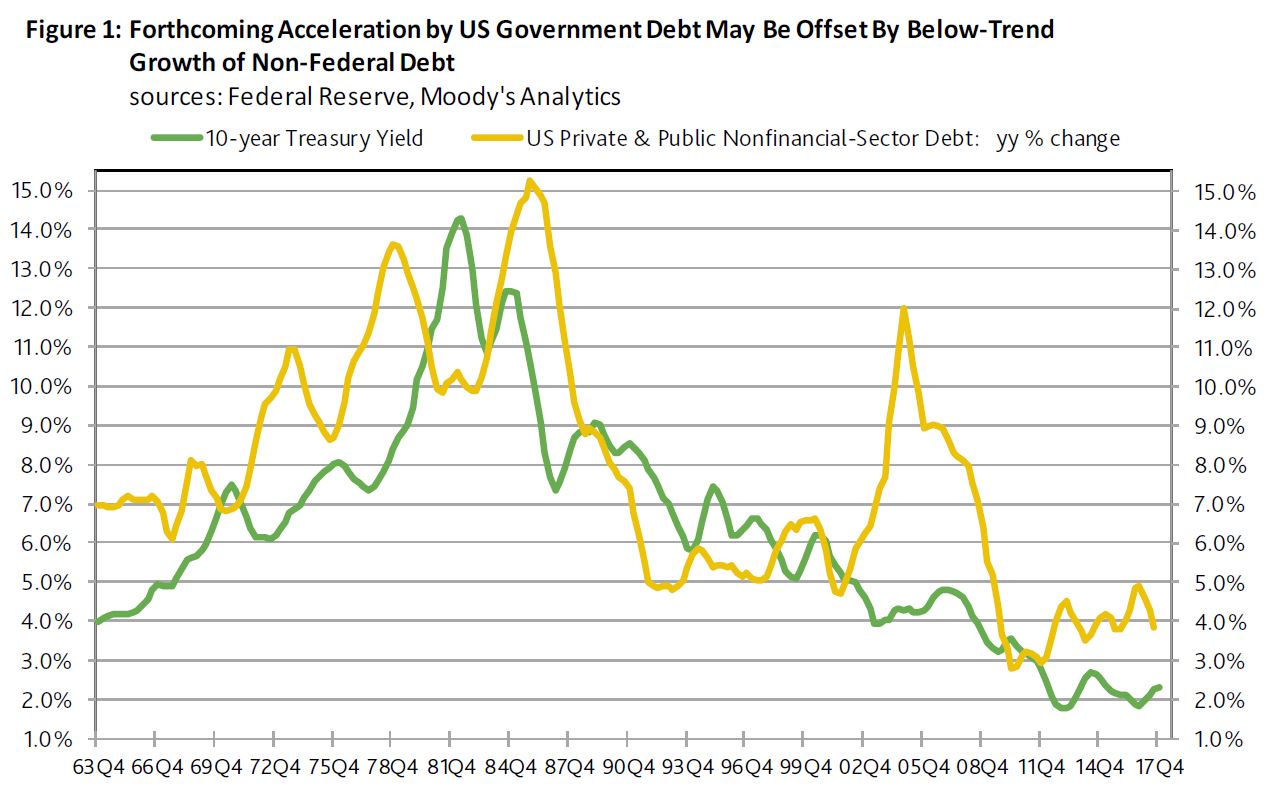
Into the indefinite future, federal debt is likely to materially outrun each of the other broad components of U.S. nonfinancial-sector debt. Because of non-federal debt’s relatively slow growth, the private and public debt of the U.S.’ nonfinancial sectors may grow no faster than 4.3% annually during the year ended Q3-2018 to a record $50.77 trillion. For the year-ended Q3-2017, this most comprehensive estimate of U.S. nonfinancial-sector debt rose by 3.8% to $48.64 trillion.

Though expectations of faster growth for total nonfinancial-sector debt complements forecasts of higher short- and long-term interest rates for 2018, the quickening of total nonfinancial-sector debt growth may not be enough to sustain the 10-year Treasury yield above the 2.85% average that the Blue Chip consensus recently predicted for 2018.

The projected growth of nonfinancial-sector debt looks manageable from a historical perspective. For one thing, 2018’s projected percent increase by debt lags far behind the 9.1% average annual advance by U.S. nonfinancial sector debt from the five-years-ended 2007. Back then, unsustainably rapid growth for total nonfinancial-sector debt and 2003-2007’s 2.1% annualized rate of core PCE price index inflation supplied a 4.4% average for the 10-year Treasury yield of the five-years-ended 2007. By contrast, the 10-year Treasury yield’s moving five-year average sagged to 2.2% during the span-ended September 2017 as the accompanying five-year average annualized growth rates descended to 4.4% for nonfinancial-sector debt and 1.5% for core PCE price index inflation.

Moody’s On APRA’s Credit Reforms

Last Wednesday, the Australian Prudential Regulation Authority (APRA) proposed key revisions to its capital framework for authorized deposit taking institutions (ADIs). The revisions cover the calculation of credit,
market and operational risks. These proposed changes are credit positive for Australian ADIs because they will improve the alignment of capital and asset risks in their loan portfolios. Moody’s says the key proposals are as follows:

  • Revisions to the capital treatment of residential mortgage portfolios under the standardized and advanced approaches, with higher capital requirements for higher-risk segments
  • Amendments to the treatment of other exposures to improve the risk sensitivity of risk-weighted asset outcomes by including both additional granularity and recalibrating existing risk weights and credit
    conversion factors for some portfolios
  • Additional constraints on the use of ADIs’ own risk parameter estimates under internal ratings-based approaches to determine capital requirements for credit risks and introducing an overall floor to riskweighted assets for ADIs using the standardized approach
  • Introduction of a single replacement methodology for the current advanced and standardized approaches to operational risks
  • Introduction of a simpler approach for small, less complex ADIs to reduce the regulatory burden without compromising prudential soundness

A particularly significant element of the new regime is a reform of the capital treatment of residential mortgages, given that more than 60% of Australian banks’ total loans were residential mortgages as of January 2018.

The improved alignment of capital to risk for residential mortgages will come from hikes in risk weights on several higher-risk loan segments. APRA proposes increased risk weights for mortgages used for investment purposes, those with interest-only features and those with higher loan-to-valuation ratios (LVR). At the same time, risk weights for some lower-risk segments likely will drop. For example, under the standardized approach, standard mortgages with LVR ratios lower than 80% will require risk weights of only 20%-30%, down from 35% under current requirements.

The higher capital charges on investment loans will better reflect their higher sensitivity to economic cycles. During periods of economic strength investment loans perform well. As Exhibit 1 shows, on a national basis
and during a time of strong economic growth, defaults on investment loans have been lower than owner occupier loans.

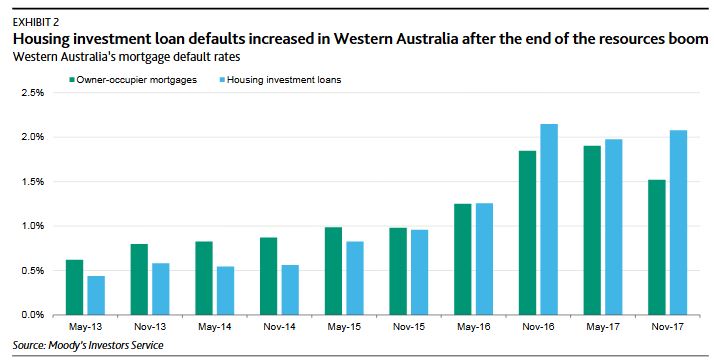
However, in Western Australia, where the economy has deteriorated following the end of the investment boom in resources, defaults on investment loans have been higher than owner-occupier loans, as Exhibit 2 shows.

Investment loans also are sensitive to the interest rate cycle. During periods of rising interest rates, investment loans tend to experience higher default rates than owner-occupier loans, as shown in Exhibit 3.

Corporate Bonds Beg to Differ with Their Equity Brethren

From Moody’s

Thus far, the corporate credit market has been relatively steady amid equity market turmoil. Corporate credit’s comparative calm stems from expectations of continued profit growth that underpins a still likely slide by the high-yield default rate. The record shows that 90% of the year-to-year declines by the default rate were joined by year-to-year growth for the market value of U.S. common stock.

Today’s positive outlooks for business sales and operating profits suggest that equities will recover once issues pertaining to interest rates are sufficiently resolved. For now, equities may be paying dearly for having been more richly priced vis-a-vis fundamentals when compared to corporate bonds.

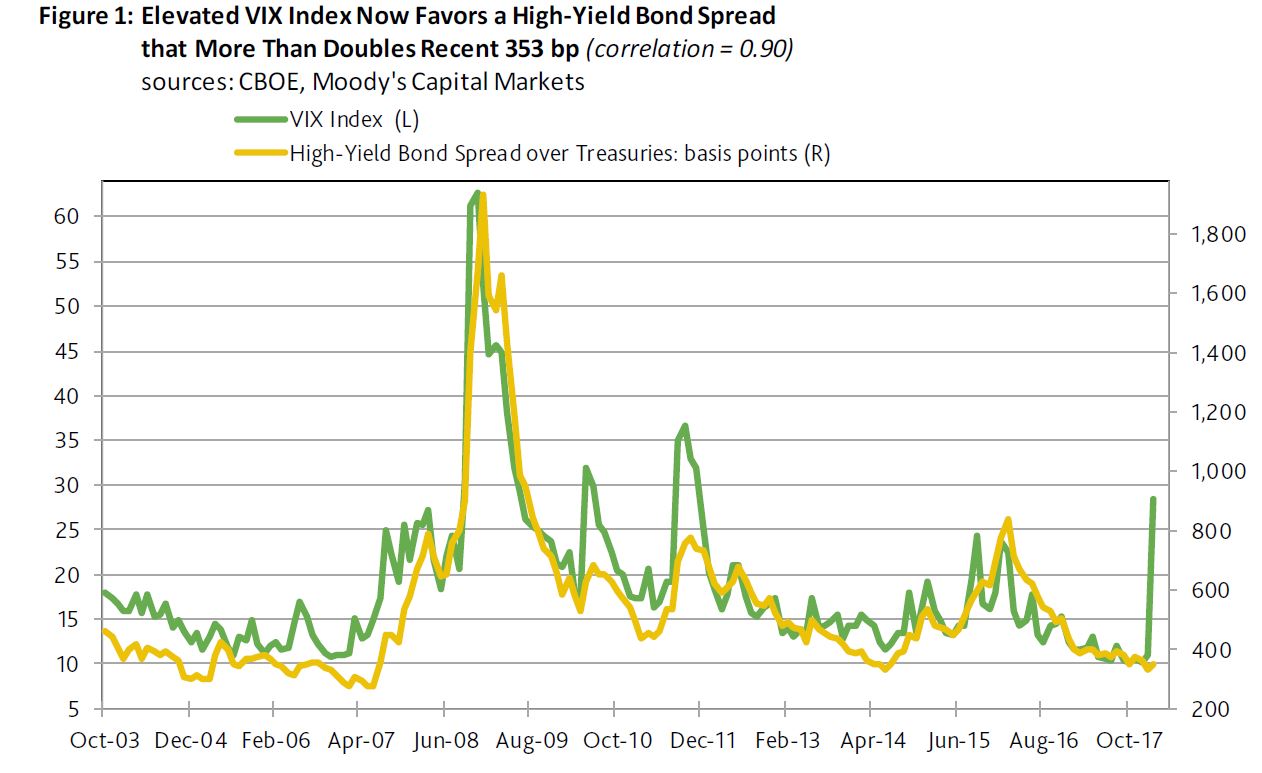
Since the VIX index’s current estimation methodology took effect in September 2003, the high-yield bond spread has generated a strong correlation of 0.90 with the VIX index. However, for now that ordinarily tight relationship has broken down. Never before has the high-yield bond spread been so unresponsive to a skyrocketing VIX index.

The VIX index’s 28.5-point average of February-to-date has been statistically associated with an 832-basis-point midpoint for the high-yield bond spread. Instead, the high-yield bond spread recently approximated 353 bp. Thus, the high-yield spread predicted by the VIX index now exceeds the actual spread by a record 479 bp.

The old record high gap was the 364 bp of October 2008, or when the actual spread of 1,398 bp would eventually surpass the 1,762 bp predicted by the VIX index. Not long thereafter, the actual high-yield spread would peak at the 1,932 bp of December 2008.

More recently, or during the euro zone crisis of 2011, the 1,018 bp high-yield spread predicted by the VIX index was as much as 323 bp above August 2011’s actual spread of 695 bp. After eventually peaking at October 2011’s 775 bp, the spread narrowed to 590 bp by August 2012.

What transpired following August 2011 and October 2008 warns against being too quick to dismiss the possibility of at least a 100 bp widening by the latest high-yield spread. Nevertheless, high-yield spreads would be significantly thinner one year after the gap between the predicted and actual spreads peaked.

For example, by August 2012, the high-yield spread had narrowed to 590 bp, while the spread had thinned to 737 bp by October 2009.

Are US Rates Going Higher?

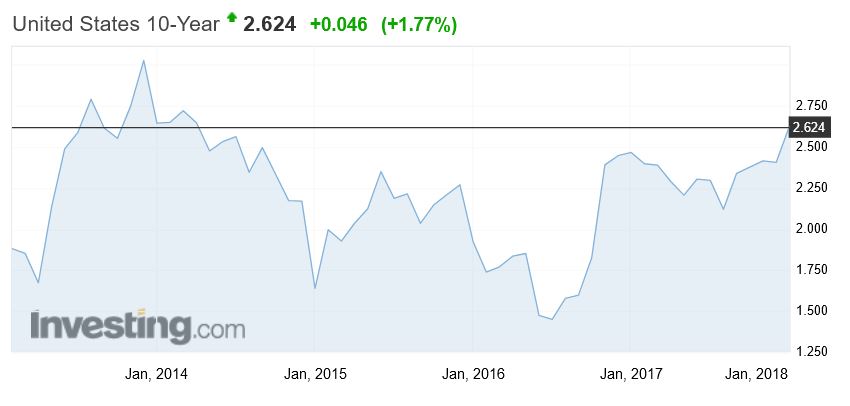
The 10-Year US Bond yield is moving higher.  This is important because it has a knock-on effect in the capital markets and so Australian Bank funding costs, potentially putting upward pressure on mortgage rates.

Whilst the US Mortgage rates were only moderately higher today, the move was enough to officially bring them to the highest levels since the (Northern) Spring of 2017.

So this piece from Moody’s is interesting.  Is the markets view that rates won’t go higher credible?

Earnings-sensitive securities have thrived thus far in 2018. Not only was the market value of U.S. common stock recently up by 4.5% since year-end 2017, but a composite high-yield bond spread narrowed by 23 basis points to 336 bp. The latter brings attention to how the accompanying composite speculative-grade bond yield fell from year-end 2017’s 5.82% to a recent 5.72% despite the 5-year Treasury yield’s increase from 2.21% to 2.39%, respectively.

Thus, the latest climb by the 10-year Treasury yield from year-end 2017’s 2.41% to a recent 2.62% is largely in response to the upwardly revised outlook for real returns that are implicit to the equity rally and the drop by the speculative-grade bond yield. The 10-year Treasury yield is likely to continue to trend higher until equity prices stagnate, the high-yield bond spread widens, interest-sensitive spending softens, and the industrial metals price index establishes a recurring slide. In view of how the PHLX index of housing sector share prices has risen by 4.5% thus far in 2018, investors sense that home sales will grow despite the forthcoming rise by mortgage yields.

Moreover, increased confidence in the timely servicing of home mortgage debt has narrowed the gap between the 30-year mortgage yield and its 10-year Treasury yield benchmark from the 172 bp of a year earlier to a recent 152 bp. The latter is the narrowest such difference since the 150 bp of January 2014, which roughly coincided with a peaking of the 10-year Treasury yield amid 2013-2014’s taper tantrum.

Do suppliers of credit to the high-yield bond market and mortgage market correctly sense an impending top for benchmark Treasury yields? If they are wrong and the 10-year Treasury yield quickly climbs above its 2.71% average of the six-months-ended March 2014, they will regret having acquiesced to the atypically thin spreads of mid-January 2018.

The UK’s “Open Banking” Initiative Went Live Last Saturday

Open Banking, where customers can elect to share their banking transaction information with third parties went live in the UK.

This initiative is designed to lift completion across financial services, and of course in Australia, there are early moves in this direction, though the shape of those here are not yet clear. An issues paper from August 2017 outlines the questions being considered by the Australian Review into Open Banking.

What data should be shared, and between whom?

How should data be shared?

How to ensure shared data is kept secure and privacy is respected?

What regulatory framework is needed to give effect to and administer the regime?

Implementation – timelines, roadmap, costs


The report was due to report end 2017.  So the UK experience is useful.

In essence, consumers (if they choose to) are able to give access to the data on their bank accounts to selected third parties, which allows them potentially to offer new and differentiated banking and financial services products.  In practice, whilst some firms rely on simple (and risky) “screen scraping” the idea is that banks will provide a standard application programme interface (API) to allow selected third parties to access agreed data.  Screen scraping is based on sharing the standard internet banking password and credentials, whilst API’s are more selective, using special passwords, which can time-limit access. This is more secure.

In addition, customers give access by logging on to their bank account, and establishing the data share from there, so again is more secure. Also, in the UK, firms wanting to access the data must be registered, and will be listed on an FCA directory. This is to avoid fraud. In addition, there is some protection for consumers if validly shared credential are misused, unlike the current state of play, where if banking passwords are shared, banks may avoid liability.

It is too soon to know whether this is truly a banking revolution, or something more incremental, but in the light of the emerging Fintech wave, we think the opportunities could be large, and the impact disruptive.

For example, Moody’s says the UK’s Open Banking initiative is credit positive for consumer securitisations.

By directly accessing current accounts, the lenders will gain valuable data about its customers’ disposable income and spending patterns. This data will complement the less detailed data that credit reference agencies provide and will result in stronger underwriting and better risk-adjusted returns when prudently applied.

The improved access to information also will benefit the debt collection process. Data on disposable income provides a realistic picture of a consumer’s debt repayment patterns. A clearer picture of consumers’ repayment patterns increases the probability of successful debt collection while ensuring compliance with the UK’s Financial Conduct Authority’s guidelines on fair treatment of customers.

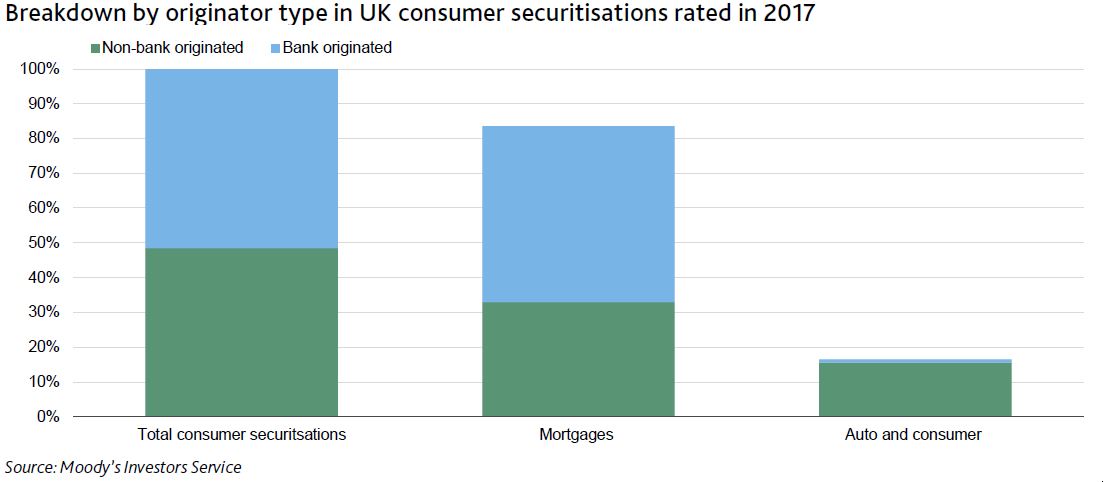
Of the approximately £32 billion of UK consumer securitisations that we publicly rated in 2017, around half were backed by pools solely originated by non-banks. The exhibit below shows that auto and consumer pools, which will benefit most from improved underwriting, are almost entirely originated by non-banks lenders. We include auto-captive bank lenders in the non-bank category since they do not have a material current account presence.

The nine banks with the largest current accounts market share in the UK that will be obliged to share their data are Allied Irish Banks, Bank of Ireland (UK), Barclays Bank , Danske Bank, HSBC Bank, Lloyds Bank, Nationwide Building Society, The Royal Bank of Scotland and Santander UK plc. Four of the nine banks have been granted an extension of six weeks and the Bank of Ireland has until September to meet the technical requirements.

There is an initial six weeks trial during which only bank staff and third parties will be able to test new services.

Moody’s also notes that “the Open Banking requirements coincide with the European Union’s (EU) Second Payment Services Directive (PSD2), which requires all payment account providers across the EU to provide third-party access. For as long as the UK remains part of the EU, it will need to comply with the EU’s legal framework. However, the regulatory technical standards on customer authentication and secure communication under PSD2 have yet to be agreed, meaning that full data sharing under PSD2 likely will be applied no earlier than third-quarter 2019”.

China implements Basel Committee framework for controlling large exposures, curtailing bank risk

From Moody’s.

Last Friday, the China Banking Regulatory Commission published for public comment a draft regulation of commercial banks’ large exposure management in accordance with the Basel Committee on Banking Supervision’s framework. The draft regulation is credit positive for banks because it will quantifiably curtail the shadow-banking practice of investing in structured products without risk-managing the underlying exposures and will limit the concentration risk in traditional non-structured loan portfolios.

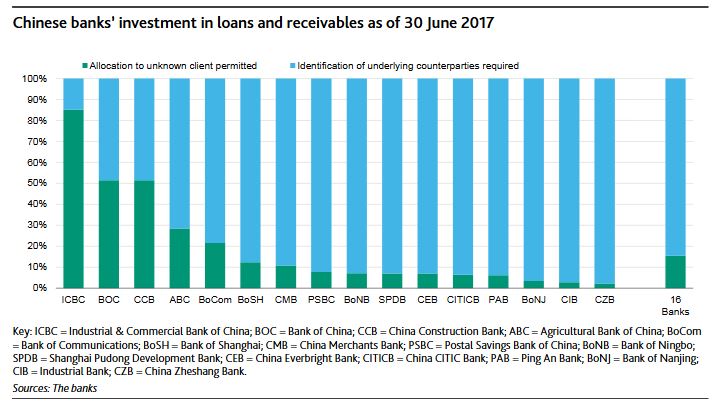
For the first time, regulators are introducing binding and quantifiable metrics to implement the look-through approach when measuring credit exposures of investments in structured products, as emphasized in a series of recent steps to tighten shadow banking activities.  A bank must aggregate unidentified counterparty risk in a structured investment’s underlying assets as if the credit exposures relate to a single counterparty (i.e., the unknown client) and reduce that aggregate exposure to below 15% of the bank’s Tier 1 capital by the end of 2018. Any investment in structured products above the capped amount must identify counterparty risks associated with underlying assets so that investing banks can manage the risks accordingly.

The draft regulation’s measure of the unknown client limit will discipline banks’ implementation of the look-through approach to their investment portfolio to address opaque bank investment categories such as “investment in loans and receivables” that have been originated by other financial institutions. For the 16 listed banks that we rate, which account for more than 70% of the country’s commercial banking-sector assets, total investment in loans and receivables was slightly more than 100% of Tier 1 capital as of 30 June 2017. This implies a forced look-through approach will be applied to more than 85% of this segment of banks’ investment portfolios (see exhibit).

For the concentration risk in traditional non-structured loan portfolios, the draft regulation reiterates the current rule limiting a bank’s loans to a single customer to 10% of the bank’s Tier 1 capital, and extends the limit to include non-loan credit exposure to a single customer at 15% of Tier 1 capital. For a group of connected customers, either through corporate governance or through economic dependence, the draft regulation caps a bank’s total credit exposure at 20% of Tier 1 capital.

For a group of connected financial-institution counterparties, the draft regulation caps a bank’s total credit exposure at 100% of Tier 1 capital by 30 June 2019 and steadily lowers the cap to 25% by the end of 2021. In the case of credit exposures between global systemically important banks (G-SIBs), the cap is 15% of Tier 1 capital within a year of the bank’s designation as a G-SIB.

Will APRA Loosen Lending Standards Next Year?

Interesting economic summary from Moody’s. They recognise the problem with household finances, and low income growth. They also suggest, mirroring the Reserve Bank NZ, that macroprudential policy might be loosened a little next year.

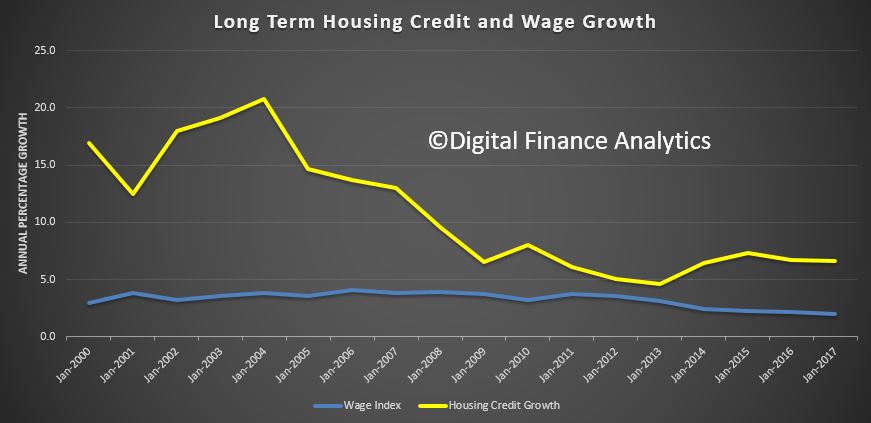
I have to say, given credit for housing is still running at three times income growth, and at very high debt levels, we are not convinced! I find it weird that there is a fixation among many on home price movements, yet the concentration and level of household debt (and the implications for the economy should rates rise), plays second fiddle.

Also, the NZ measures were significantly tighter, and the recent loosening only slight (and in the face of significant political measures introduced to tame the housing market). So we think lending controls should be tighter still in 2018.

It’s strange examining third quarter data when the fourth stanza has almost passed, but the Australian Bureau of Statistics isn’t known for timely national accounts data. Australia is the last major Asia-Pacific economy to release quarterly GDP numbers. Despite the tardiness, the national accounts gives valuable insight, especially on the investment front in the absence of a reliable monthly gauge.

Australia’s GDP growth hit 0.6% q/q in the September quarter following an upwardly revised 0.9% (previously reported as 0.8%) gain in the June stanza. Annual growth accelerated to 2.8% from the prior 1.8% gain. The annual growth figure is now hovering at potential, which we estimate is around 3%. However, momentum is overstated, given low base effects. In the September quarter of 2016, the Australian economy contracted by 0.5% q/q, only the fourth quarterly contraction in 25 years. This was driven by a sharp fall in investment alongside higher imports. During this period, annual growth slowed by 1.3 percentage point to 1.8%.

Private investment booms

Private investment was a bright spot in the third quarter because of a sharp rise in non-dwelling construction, which made the largest contribution to GDP growth at 0.9 percentage point.

Non-dwelling construction has often become a proxy for mining investment, and the third quarter gain is likely due to the installation of two liquefied natural gas platforms in Western Australia and the Northern Territory. LNG exports are expected to pick up late in the fourth quarter amid increased production capacity. The Wheatstone project began production earlier in October after a two-year construction phrase and
shipped its first export to Japan late in the month. Wheatstone is the sixth of eight projects included in a A$200 billion LNG construction boom that is now in its final stretch. Once the remaining two projects are finalized, Australia could topple Qatar as the world’s biggest LNG exporter. Australia has recently become the world’s second largest exporter of LNG.

Public investment didn’t score as well in the third quarter, declining by 7.5% q/q. This is mainly payback after a boost in the June quarter from the acquisition of the Royal Adelaide Hospital from the private sector.

The housing market has cooled in 2017, and price growth is expected to keep decelerating through 2018; this will keep downward pressure on dwelling investment. For instance, dwelling price growth in Sydney was 5% y/y in November, well down from its double-digit growth in 2016 and earlier in 2017.

This is the result of the lagged impact of earlier macroprudential action that has included higher borrowing costs for homebuyers, especially investors or those taking out interest-only loans. The Australian Prudential Regulation Authority has also imposed limits on bank portfolio exposure to new mortgages.

Owner-occupied housing finance commitments tend to track house price growth and are a good gauge of the underlying pulse. Data released this week show October commitments rose just 0.3% m/m on a trend basis. Growth has slowed substantially from earlier in 2017.

An interesting tidbit we have observed in recent years: Housing regulation in New Zealand tends to lead Australia’s by at least a year. The Reserve Bank of New Zealand was on the front foot trying to cool certain heated housing pockets such as Auckland well before the Australian Prudential Regulation
Authority introduced housing-targeted measures, even though both economies were experiencing strong price growth in some areas. Just recently, the RBNZ announced it had eased some macroprudential measures in light of softer house price growth. Now that Australia’s housing market has cooled, APRA may follow suit with minor reversals in the next year.

Households missing in action

At first glance it was a relief that consumption made a positive contribution to GDP growth, but the details were less pleasing, as spending was concentrated on essential items while discretionary purchases suffered. We calculated that nondiscretionary items rose an average 0.6% over the quarter, and discretionary spending fell by 0.7%.

Of the nondiscretionary items, utility spending rose 1.4% q/q, food was up 1%, rent gained 0.6%, and insurance and financial services grew 1.3%. On the discretionary front, clothing spending fell 1% q/q, recreation and culture was down 0.6%, and spending at cafes and restaurants fell by 0.9%.

All told, softness in the consumer sector was largely masked by spending on nondiscretionary items. The monthly retail trade data do not capture nondiscretionary spending as thoroughly as the national accounts; over the third quarter retail volumes were up just 0.1% q/q.

We know from earlier testing that consumer sentiment does not have a causal relationship with retail spending, but incomes do. Sentiment is a symptom of weak income growth, rather than a forward indicator of spending behaviour. The Westpac consumer sentiment index fell to 99.7 in November, below the neutral 100 that indicates optimists equal pessimists. Overall, consumers have been downbeat through most of 2017, concerned about family finances and the economic outlook. At 2% y/y, income growth is hovering near a record low, so it’s little surprise households have pulled
back on discretionary purchases, while other costs such as utilities rose in the third quarter because of seasonal price hikes. The net household saving ratio rose to 3.2% in the third quarter, higher than the decade low of 3% in the June quarter, suggesting that consumers aren’t willing to keep dipping into their savings to fund discretionary purchases. It’s concerning that household consumption is weak, given that it constitutes 75% of GDP.

Businesses are faring better than consumers at the moment. This is reflected in soaring private investment, lofty gains in company profits, and strong employment growth, particularly full-time, through 2017. Unfortunately, this has not yet flowed through to stronger income growth, and there are likely several factors at play. The first is cyclical: Low productivity is mooted as a reason for benign wages in the developed world. More Australia-specific is that underemployment has been very high in
Australia and the correlation with income growth is around -0.88. Underemployment has started to edge lower as full-time positions outpace part-time, and our baseline scenario is for the tighter labour market to yield stronger income growth by mid-2018. Although Australia’s Phillips curve has flattened in the past decade, there is still a reasonable relationship between unemployment and income growth.

Some structural factors: The rise of the gig economy has contributed to the rise in casual employment. These positions are more flexible and more easily adapt to changing demand, but there’s no union representation, which can hurt wage bargaining. Also, as the positions are more flexible, there’s more acceptance that lower wages can be a consequence.

Another structural reason for low incomes could be the higher prevalence of offshoring roles. There’s no reliable industry- or economy-wide data measuring the extent of offshoring, but we know that it is an unrelenting phenomenon, given the disparity in operating costs between Australia and the developed world. Employers are not locally replacing jobs lost offshore, so they are not potentially driving up labour costs to secure the appropriate candidate.

All told, these structural factors suggest that national income growth is unlikely to enjoy a significant rebound but rather gradual and modest improvement in 2018.

How’s the fourth quarter tracking?

Our high-frequency GDP tracker suggests a 2.7% y/y expansion in the December quarter following the barrage of October activity data this week. Retail trade came in at a strong 0.5% m/m, although this was payback for sustained weakness through the third quarter, when retail turnover fell an average 0.3% m/m.

October foreign trade data weren’t inspiring, as merchandise exports fell by 2% m/m amid lower iron ore prices and, to a lesser extent, volumes. The iron ore spot price increased by 22% from its late-October slump to US$71.51 per metric tonne in early December. We expect this will enable iron ore export receipts to improve heading into 2018 as higher global prices are incorporated into contracts; usually the lag is short. It’s too early to determine whether volumes will be adversely affected by higher prices.

We maintain our view that monetary tightening is firmly off the table for at least another year as the central bank sits on the sidelines waiting for consumption to show meaningful signs of a pickup. Our expectation is that the Australian dollar will depreciate around an additional 3% against the U.S. dollar over the next six months, serving to encourage more  consumption onshore and lift export competitiveness and helping core inflation return to and creep through the central bank’s 2% to 3%
target range.

Mortgage arrears to increase in 2018: Moody’s

According to Moody’s “RMBS, ABS and covered bonds – Australia, 2018 outlook – Delinquencies will increase moderately from low levels, report”, delinquencies underlying Australian residential mortgage-backed securities (RMBS) are expected to “moderately” increase in 2018 from their current low levels.

The housing market is expected to ease, and household finances remain under pressure.

Of note is the rise in the relative share of non-bank lending (who are not under the same regulatory control as the banks) and the continued impact from the mining downturn, especially in WA.

We expect mortgage delinquencies in outstanding RMBS deals  to increase moderately from their low levels because of the continued after-effects of weaker conditions in states reliant on the mining industry and less favourable housing market and income dynamics.

With Western Australia and other states reliant on mining pushing up delinquencies this year, this will continue in 2018,

The balance of risks in new RMBS deals will also change, as bank-sponsored RMBS issued in 2018 will include a lower proportion of interest-only, high loan-to-value ratio (LVR) and housing investment loans, following regulatory measures to curb the origination of riskier mortgages.

RMBS issued by the non-banks will include a greater percentage of interest-only and investment loans than has been recorded in the past as these lenders have fallen outside of APRA’s regulatory remit thus far.