We review the latest S&P Ratings mortgage default data. Its not looking good!
 Blog")
/
RSS Feed
Digital Finance Analytics (DFA) Blog
"Intelligent Insight"

We review the latest S&P Ratings mortgage default data. Its not looking good!
Digital Finance Analytics (DFA) has released the May 2019 mortgage stress and default analysis update. Perhaps the rate cuts, rise to the minimum wage, and tax cuts ahead may turn the tide, but so far none of this matters for current household budgets. On the other hand more lending may make budgets even tighter if standards are dropped further.
Once again, it’s the continuing story of pressure on households as ongoing wages growth is not offsetting costs of living, and mortgage repayments as total debt continues to rise. Moreover, the trends have continued post the election.
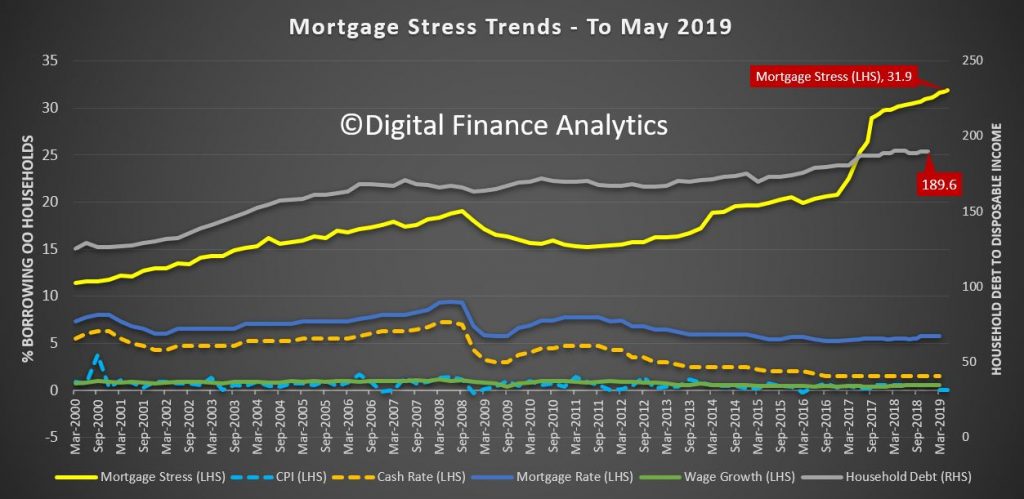
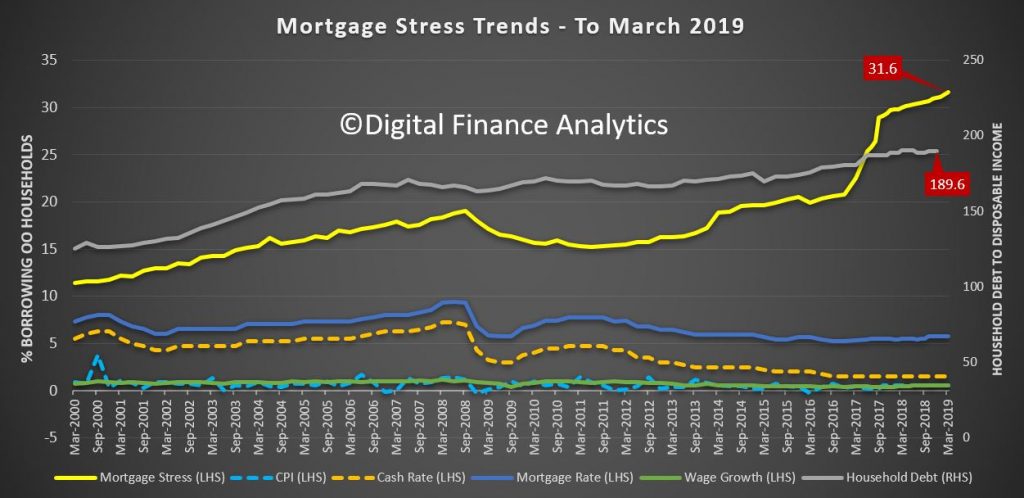
Across Australia, more than 1,071,829 households are estimated to be now in mortgage stress (last month 1,050,450), another new record. This equates to more than 31.9% of owner-occupied borrowing households. In addition, more than 33,427 (30,413 last month) of these are in severe stress. We estimate that more than 70,502 (last month 70,149) households’ risk 30-day default in the next 12 month. This is as the impact of flat wages growth, rising living costs and higher real mortgage rates hit home. Bank losses are likely to rise a little ahead.
Our analysis uses the DFA core market model which combines information from our 52,000 household surveys, public data from the RBA, ABS and APRA; and private data from lenders and aggregators. The data is current to the end of May 2019. We analyse household cash flow based on real incomes, outgoings and mortgage repayments, rather than using an arbitrary 30% of income.
Households are defined as “stressed” when net income (or cash flow) does not cover ongoing costs. They may or may not have access to other available assets, and some have paid ahead, but households in mild stress have little leeway in their cash flows, whereas those in severe stress are unable to meet repayments from current income. In both cases, households manage this deficit by cutting back on spending, putting more on credit cards and seeking to refinance, restructure or sell their home. Those in severe stress are more likely to be seeking hardship assistance and are often forced to sell.
Martin North, Principal of Digital Finance Analytics says that now the election results are known, and the dust has settled, we are still seeing the pressures on households are rising, thanks to an accumulation of larger mortgages compared to income whilst costs are rising, and incomes remain static. Housing credit growth is still running significantly faster than incomes and inflation and continued rises in living costs – notably child care, healthcare costs, school fees and electricity prices are causing significant pain. Many households are depleting their savings to support their finances or are trying to refinance.
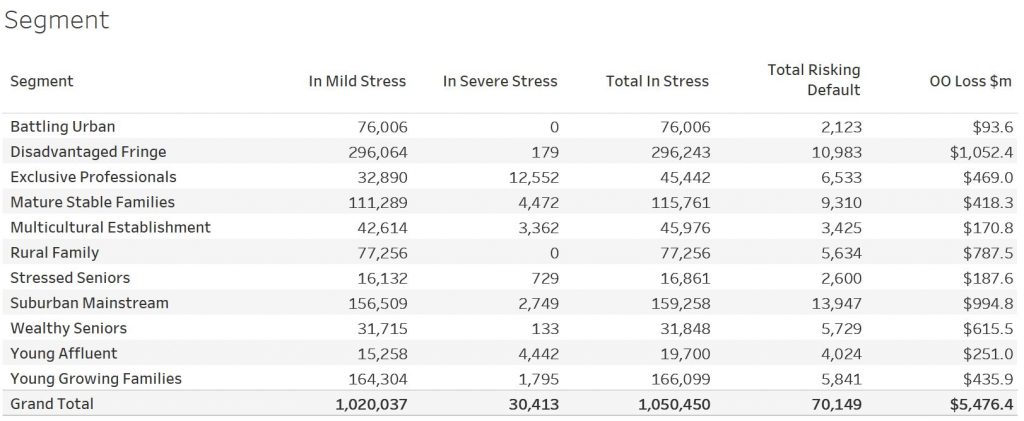
Probability of default extends our mortgage stress analysis by overlaying economic indicators such as employment, future wage growth and cpi changes. Our Core Market Model also examines the potential of portfolio risk of loss in basis point and value terms. Losses are likely to be higher among more affluent households, contrary to the popular belief that affluent households are well protected. This is shown in the segment analysis below:
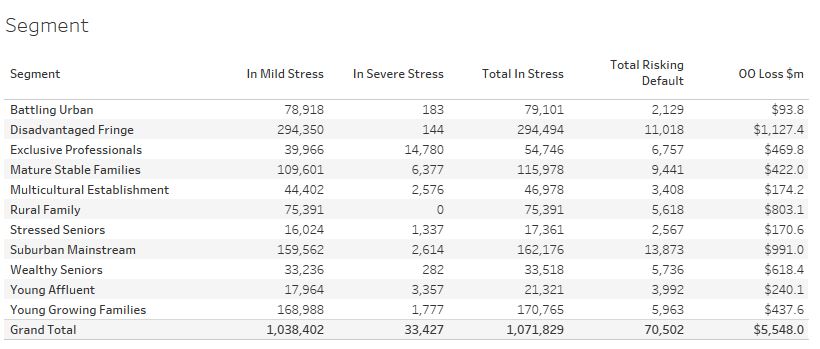
Stress by the numbers.
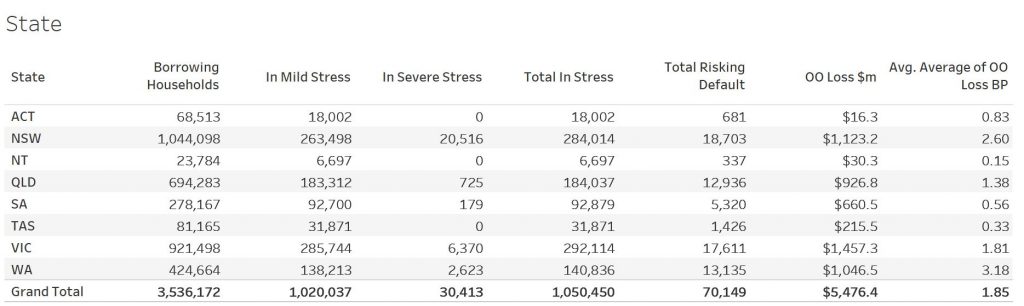
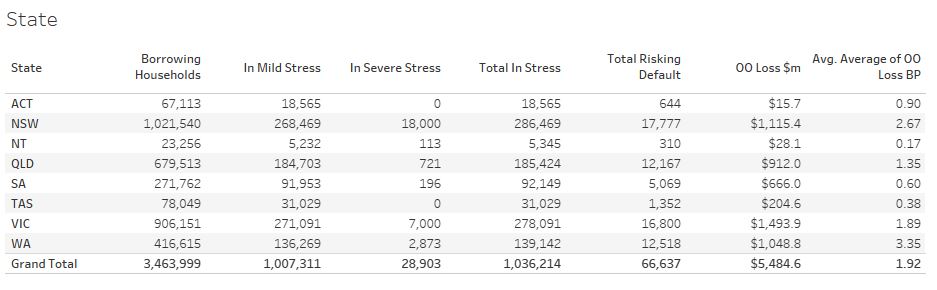
Regional analysis shows that NSW has 297,995 households in stress (284,014 last month), VIC 290,581 (292,114 last month), QLD 193,155 (184,037 last month) and WA has 140,950 (140,836) last month). The probability of default over the next 12 months rose, with around 13,222 (13,135 last month) in WA, around 12,948 (12,936 last month) in QLD, 17,773 (17,611 last week) in VIC and 18,822 (18,703 last month) in NSW.
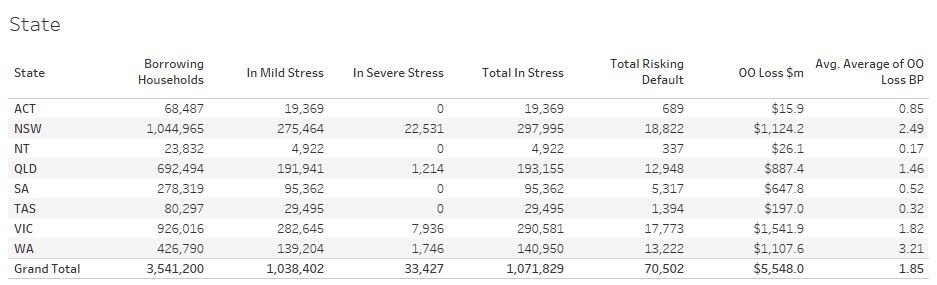
The largest financial losses relating to bank write-offs reside in NSW ($1.1 billion) from Owner Occupied borrowers) and VIC ($1.54 billion), though losses are likely to be highest in WA at 3.1 basis points, which equates to $1,107 million.
A fuller regional breakdown is set out below.
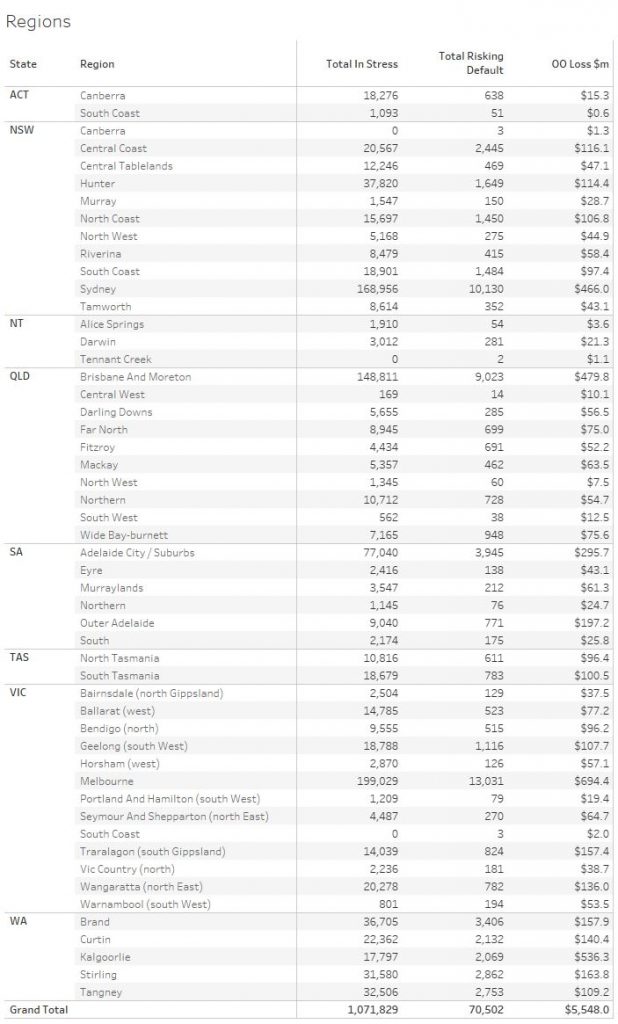
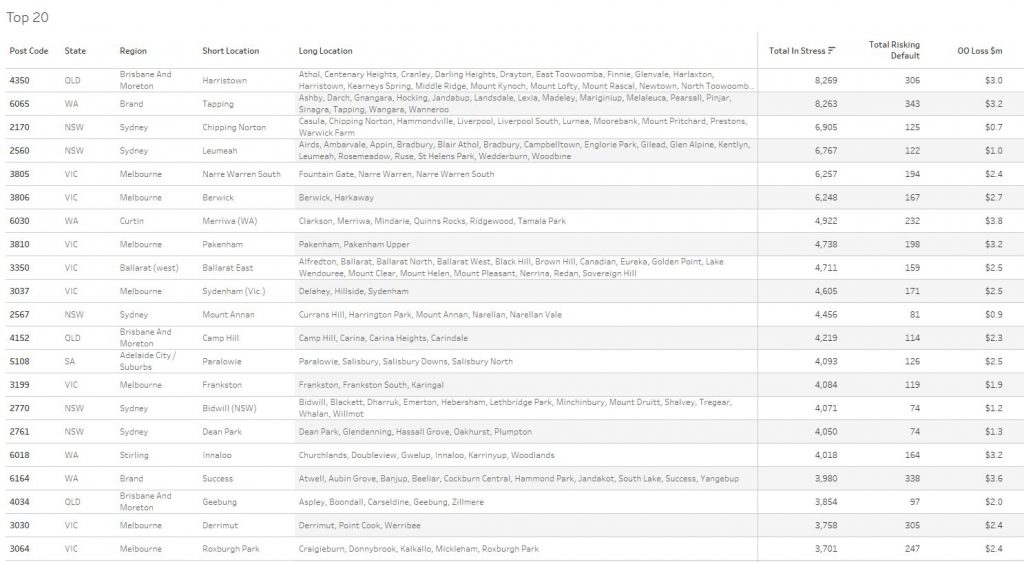
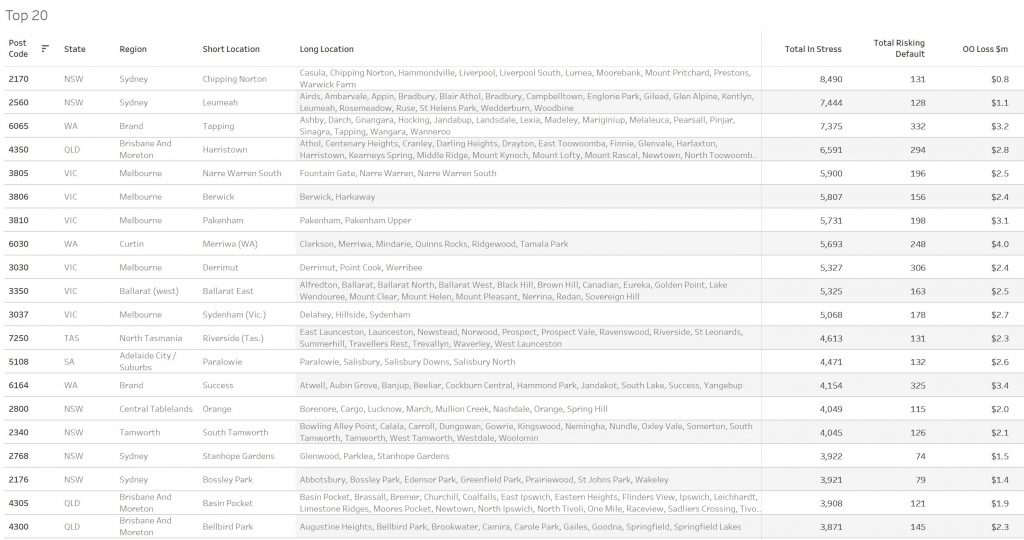
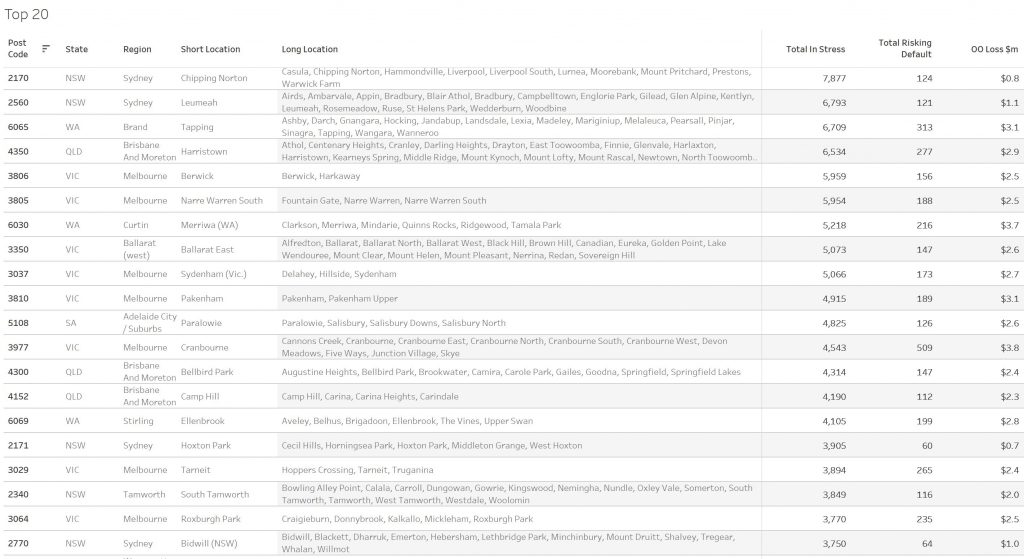
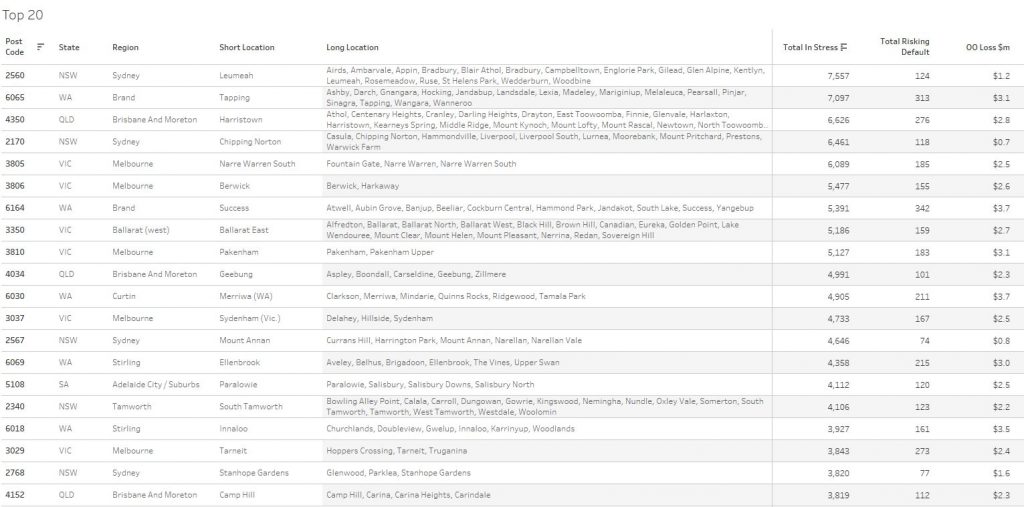
Here are
the top postcodes sorted by number of households in mortgage stress.
Handling Mortgage Stress
Households who are in financial difficulty should not ignore the signs. Though many do. And trying to refinance to solve the problem often ends up just postponing the inevitable.
We think there are some simple steps households can take:
Step one is to draw up a budget, so you can see where the money is coming and going. From our research, only half of households have any budget. This means you can then make decisions about what is most important, and what can be foregone. Select and prioritise.
Step two is to talk with your lender, as they have a legal obligation to assist is case of hardship. Yet many households avoid having that conversation, hoping the problem will cure itself. I have to say, in the current low-income growth, high cost environment, that is unlikely. And remember rates are likely to rise at some point.
Step three. Work out what would happen if mortgage rates rose by say half or one percent. Pass that across your budget and examine the impact. Then you will really know where you stand. Then plan accordingly.
You can request our media release. Note this will NOT automatically send you our research updates, for that register here.
[contact-form to=’mnorth@digitalfinanceanalytics.com’ subject=’Request The May 2019 Stress Release’][contact-field label=’Name’ type=’name’ required=’1’/][contact-field label=’Email’ type=’email’ required=’1’/][contact-field label=’Email Me The May 2019 Media Release’ type=’radio’ required=’1′ options=’Yes Please’/][contact-field label=”Comment If You Like” type=”textarea”/][/contact-form]
Note that the detailed results from our surveys and analysis are made available to our paying clients.
We review today’s economic news, the RBA decision, and the current state of household finances via our mortgage stress report.
Digital Finance Analytics (DFA) has released the April 2019 mortgage stress and default analysis update. Once again, it’s the continuing story of pressure on households as ongoing wages growth is not offsetting costs of living, and mortgage repayments and total debt continues to rise. Recent bank reporting highlights the elevated risks in the household sector as this all plays out.
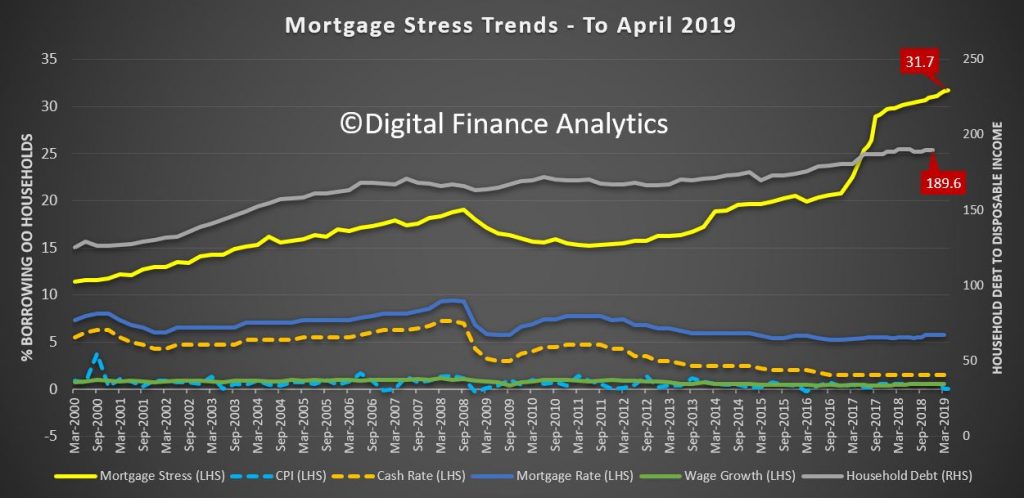
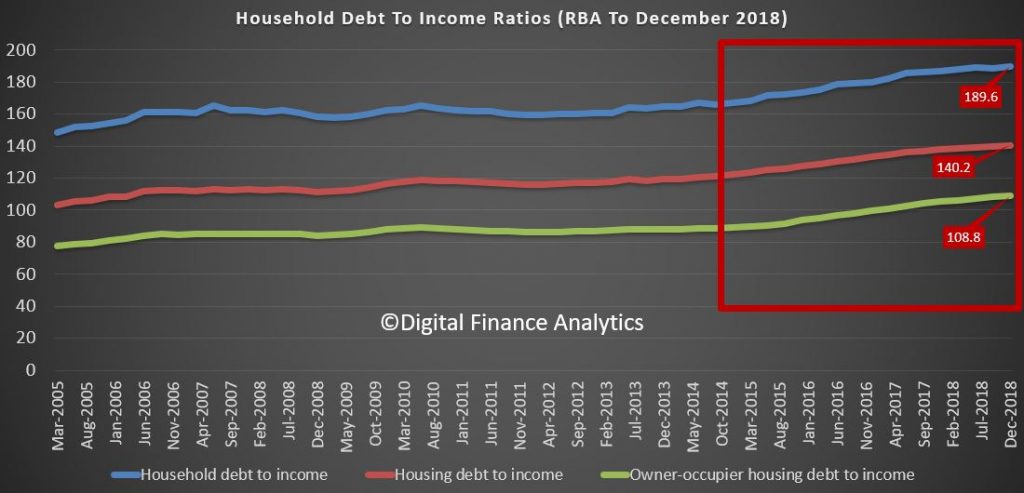
The latest RBA data on household debt to income to December rose to 189.6[1], and remains highly elevated. Plus, the housing debt ratio continues to climb to a new record of 140.2, according to the RBA. This shows that household debt to income is still increasing.
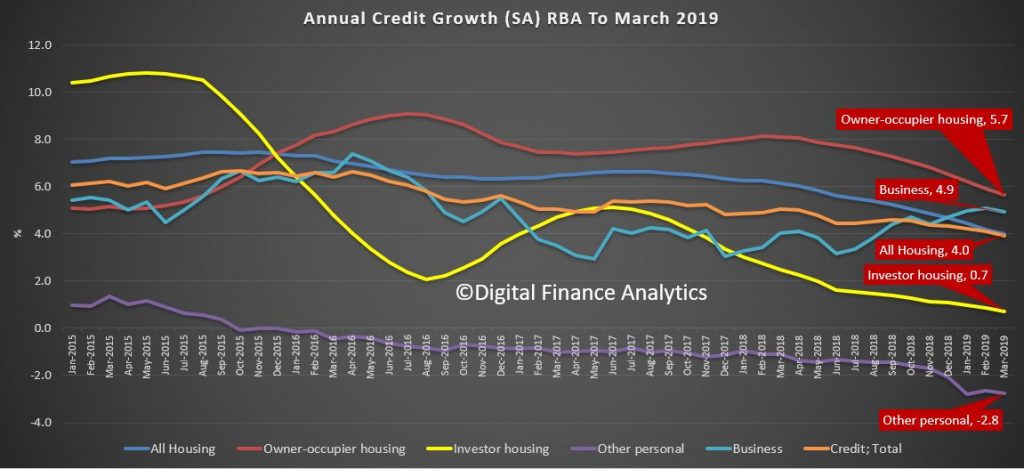
This is confirmed by the latest financial aggregates to end March recently released by the RBA, with owner occupied lending still growing significantly faster than inflation at 5.7%.
This high debt level, in the context of broader financial pressure, helps to explain the fact that mortgage stress continues to rise.
Across Australia, more than 1,050,450 households are estimated to be now in mortgage stress (last month 1,044,666), another new record. This equates to more than 31.7% of owner-occupied borrowing households. In addition, more than 30,413 (27,775 last month) of these are in severe stress. We estimate that more than 70,149 (last month 66,700) households’ risk 30-day default in the next 12 month. This is as the impact of flat wages growth, rising living costs and higher real mortgage rates hit home. Bank losses are likely to rise a little ahead.
Our analysis uses the DFA core market model which combines information from our 52,000 household surveys, public data from the RBA, ABS and APRA; and private data from lenders and aggregators. The data is current to the end of April 2019. We analyse household cash flow based on real incomes, outgoings and mortgage repayments, rather than using an arbitrary 30% of income.
Households are defined as “stressed” when net income (or cash flow) does not cover ongoing costs. They may or may not have access to other available assets, and some have paid ahead, but households in mild stress have little leeway in their cash flows, whereas those in severe stress are unable to meet repayments from current income. In both cases, households manage this deficit by cutting back on spending, putting more on credit cards and seeking to refinance, restructure or sell their home. Those in severe stress are more likely to be seeking hardship assistance and are often forced to sell.
Despite reassurances that household finances are fine, the pressures are rising, thanks to an accumulation of larger mortgages compared to income whilst costs are rising, and incomes remain static. Housing credit growth is still running significantly faster than incomes and inflation and continued rises in living costs – notably child care, healthcare costs, school fees and electricity prices are causing significant pain. Many households are depleting their savings to support their finances or are trying to refinance.
Probability of default extends our mortgage stress analysis by overlaying economic indicators such as employment, future wage growth and cpi changes. Our Core Market Model also examines the potential of portfolio risk of loss in basis point and value terms. Losses are likely to be higher among more affluent households, contrary to the popular belief that affluent households are well protected. This is shown in the segment analysis below:
Stress by the numbers.
Regional analysis shows that NSW has 284,014 households in stress (286,890 last month), VIC 292,114 (283,753 last month), QLD 184,037 (185,282 last month) and WA has 140,836 (141,199 last month). The probability of default over the next 12 months rose, with around 13,135 (12,600 last month) in WA, around 12,936 (12,400 last month) in QLD, 17,611 (16,700 last week) in VIC and 18,703 (17,700 last month) in NSW.
The largest financial losses relating to bank write-offs reside in NSW ($1.1 billion) from Owner Occupied borrowers) and VIC ($1.46 billion) from Owner Occupied Borrowers, though losses are likely to be highest in WA at 3.1 basis points, which equates to $1,046 million from Owner Occupied borrowers.
Here is a regional breakdown.

Here are the top postcodes sorted by number of households in mortgage stress.
Handling Mortgage Stress
Households who are in financial difficulty should not ignore the signs. Though many do. And trying to refinance to solve the problem often ends up just postponing the inevitable.
We think there are some simple steps households can take:
Step one is to draw up a budget, so you can see where the money is coming and going. From our research, only half of households have any budget. This means you can then make decisions about what is most important, and what can be foregone. Select and prioritise.
Step two is to talk with your lender, as they have a legal obligation to assist is case of hardship. Yet many households avoid having that conversation, hoping the problem will cure itself. I have to say, in the current low-income growth, high cost environment, that is unlikely. And remember rates are likely to rise at some point.
Step three. Work out what would happen if mortgage rates rose
by say half or one percent. Pass that across your budget and examine the
impact. Then you will really know where you stand. Then plan accordingly.
[1] RBA E2 Household Finances – Selected Ratios December 2018
You can request our media release. Note this will NOT automatically send you our research updates, for that register here.
[contact-form to=’mnorth@digitalfinanceanalytics.com’ subject=’Request The April 2019 Stress Release’][contact-field label=’Name’ type=’name’ required=’1’/][contact-field label=’Email’ type=’email’ required=’1’/][contact-field label=’Email Me The April 2019 Media Release’ type=’radio’ required=’1′ options=’Yes Please’/][contact-field label=”Comment If You Like” type=”textarea”/][/contact-form]
Note that the detailed results from our surveys and analysis are made available to our paying clients.
From the ABC.
On Radio Nation PM Programme this evening.
It was just weeks ago that mention of rising mortgage defaults was met with some sniggers and jeers, with many in the industry pointing to what are still actually very low rates of arrears overall.
So you can imagine the surprise when the boss of one of Australia’s big four banks conceded today that he too was worried about home owners keeping up with their repayments.
If that’s not scary enough, according to the ANZ, as many as 5 per cent of homes slumped into negative equity in March, where the value of what they owe the bank is more than what their home is worth, putting even more pressure on borrowers.
It begs the question: is the worst of the house price falls now over, or is there worse to come?
I discuss the latest data.
Digital Finance Analytics (DFA) has released the March 2019 mortgage stress and default analysis update. It’s the continuing story of pressure on households as ongoing wages growth is not offsetting costs of living, and mortgage repayments and total debt continues to rise.
Note: Later in the month we will release mapping showing the percentage of households in stress across postcodes (as opposed to the number estimated to be in stress). We generally avoid this data view because a raw percentage calculation can easily be distorted by postcodes with low counts of borrowing household, but then we have had several requests for this alternative view.
The latest RBA data on household debt to income to December rose to 189.6[1], and remains highly elevated. Plus, the housing debt ratio continues to climb to a new record of 140.2, according to the RBA. This shows that household debt to income is still increasing.
This is confirmed by the latest financial aggregates recently released by the RBA, with owner occupied lending still growing significantly faster than inflation at 5.9%.
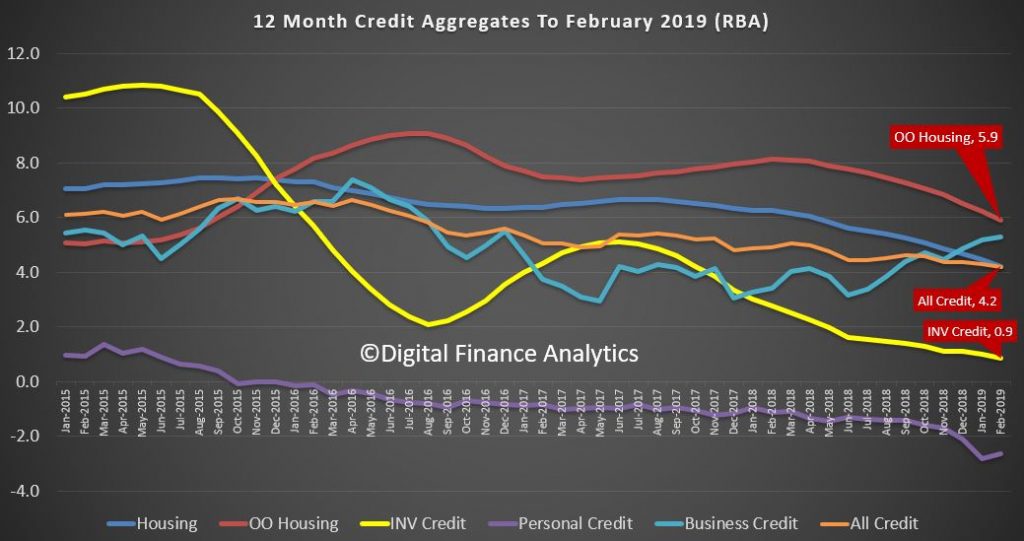
This high debt level, in the context of broader financial pressure, helps to explain the fact that mortgage stress continues to rise. Across Australia, more than 1,044,666 households are estimated to be now in mortgage stress (last month 1,036,214), another new record. This equates to more than 31.6% of owner-occupied borrowing households. In addition, more than 27,775 of these are in severe stress. We estimate that more than 66,700 households’ risk 30-day default in the next 12 months, up 800 from last month. This is as the impact of flat wages growth, rising living costs and higher real mortgage rates hit home. Bank losses are likely to rise a little ahead.
Our analysis uses the DFA core market model which combines information from our 52,000 household surveys, public data from the RBA, ABS and APRA; and private data from lenders and aggregators. The data is current to the end of March 2019. We analyse household cash flow based on real incomes, outgoings and mortgage repayments, rather than using an arbitrary 30% of income.
Households are defined as “stressed” when net income (or cash flow) does not cover ongoing costs. They may or may not have access to other available assets, and some have paid ahead, but households in mild stress have little leeway in their cash flows, whereas those in severe stress are unable to meet repayments from current income. In both cases, households manage this deficit by cutting back on spending, putting more on credit cards and seeking to refinance, restructure or sell their home. Those in severe stress are more likely to be seeking hardship assistance and are often forced to sell.
The forces continue to build, despite reassurances that household finances are fine. This is because we continue to see an accumulation of larger mortgages compared to income whilst costs are rising, and incomes remain static. Housing credit growth is running significantly faster than incomes and inflation and continued rises in living costs – notably child care, school fees and electricity prices are causing significant pain. Many households are depleting their savings to support their finances.
Probability of default extends our mortgage stress analysis by overlaying economic indicators such as employment, future wage growth and cpi changes. Our Core Market Model also examines the potential of portfolio risk of loss in basis point and value terms. Losses are likely to be higher among more affluent households, contrary to the popular belief that affluent households are well protected. This is shown in the segment analysis below:
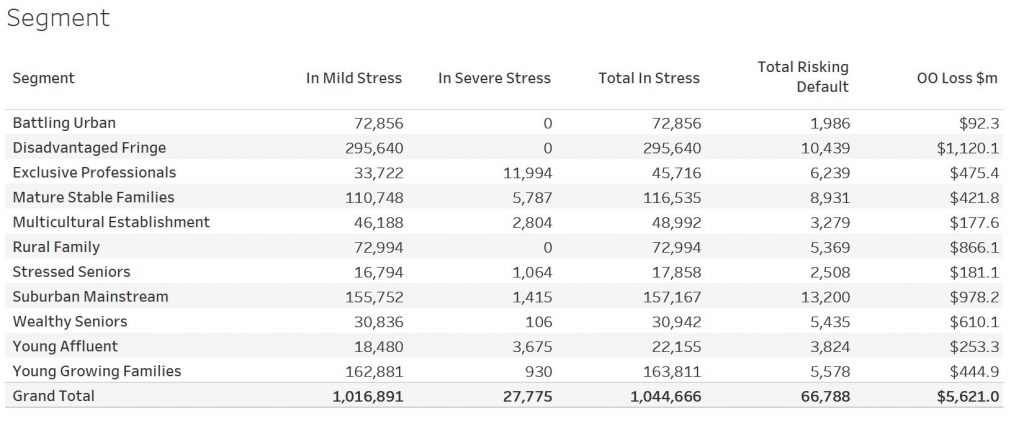
Stress by the numbers.
Regional analysis shows that NSW has 286,890 households in stress (286,469 last month), VIC 283,753 (278,091 last month), QLD 185,282 (185,424 last month) and WA has 141,199 (139,142 last month). The probability of default over the next 12 months rose, with around 12,600 in WA, around 12,400 in QLD, 16,700 in VIC and 17,700 in NSW.
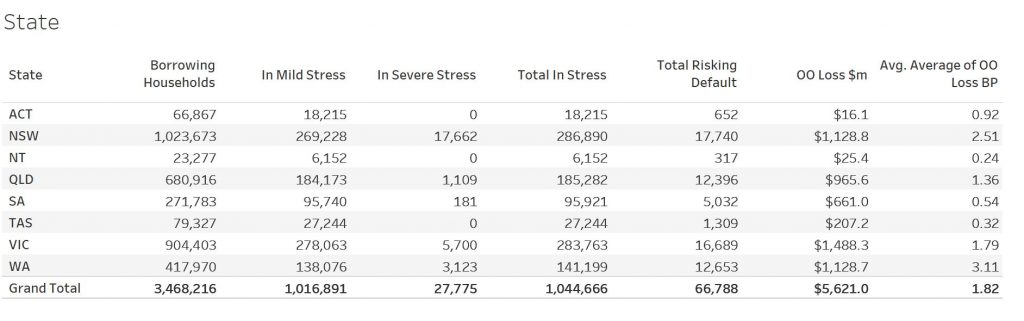
The largest financial losses relating to bank write-offs reside in NSW ($1.1 billion) from Owner Occupied borrowers) and VIC ($1.49 billion) from Owner Occupied Borrowers, though losses are likely to be highest in WA at 3.1 basis points, which equates to $1,045 million from Owner Occupied borrowers.
A fuller regional breakdown is set out below.
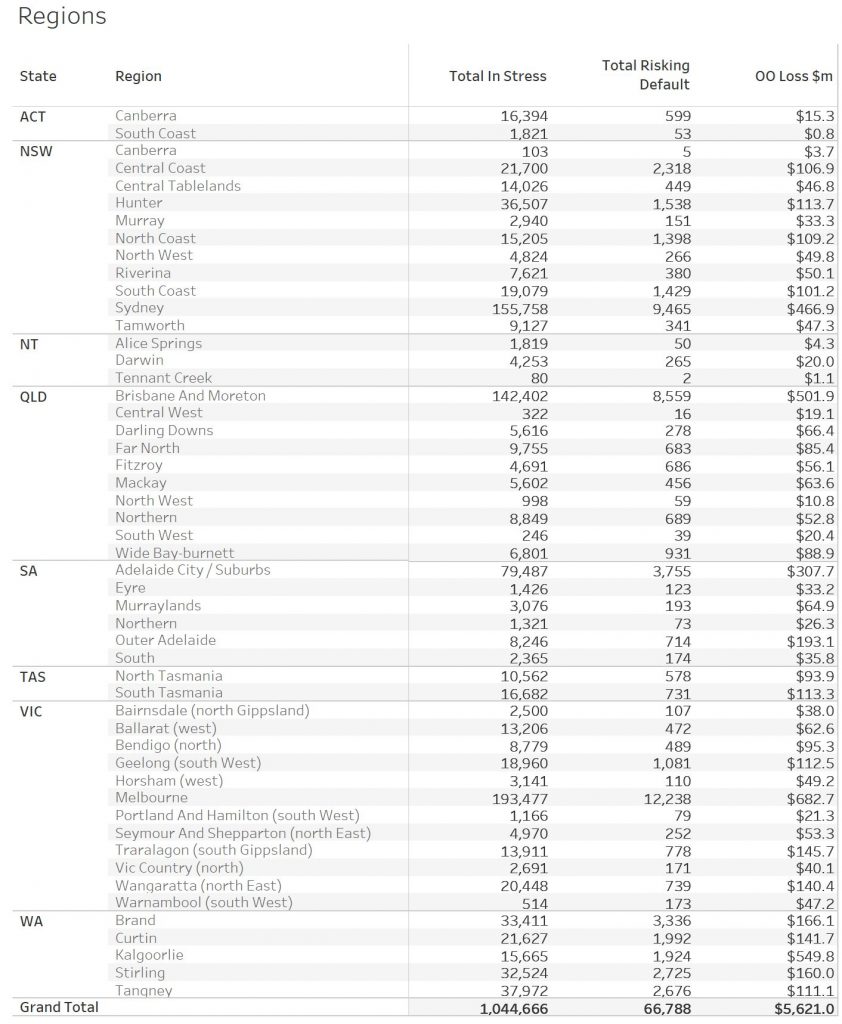
Here are
the top postcodes sorted by number of households in mortgage stress.
Handling Mortgage Stress
Households who are in financial difficulty should not ignore the signs. Though many do. And trying to refinance to solve the problem often ends up just postponing the inevitable.
We think there are some simple steps households can take:
Step one is to draw up a budget, so you can see where the money is coming and going. From our research, only half of households have any budget. This means you can then make decisions about what is most important, and what can be foregone. Select and prioritise.
Step two is to talk with your lender, as they have a legal obligation to assist is case of hardship. Yet many households avoid having that conversation, hoping the problem will cure itself. I have to say, in the current low-income growth, high cost environment, that is unlikely. And remember rates are likely to rise at some point.
Step three. Work out what would happen if mortgage rates rose
by say half or one percent. Pass that across your budget and examine the
impact. Then you will really know where you stand. Then plan accordingly.
[1] RBA E2 Household Finances – Selected Ratios December 2018
You can request our media release. Note this will NOT automatically send you our research updates, for that register here.
[contact-form to=’mnorth@digitalfinanceanalytics.com’ subject=’Request The March 2019 Stress Release’][contact-field label=’Name’ type=’name’ required=’1’/][contact-field label=’Email’ type=’email’ required=’1’/][contact-field label=’Email Me The March 2019 Media Release’ type=’radio’ required=’1′ options=’Yes Please’/][contact-field label=”Comment If You Like” type=”textarea”/][/contact-form]
Note that the detailed results from our surveys and analysis are made available to our paying clients.
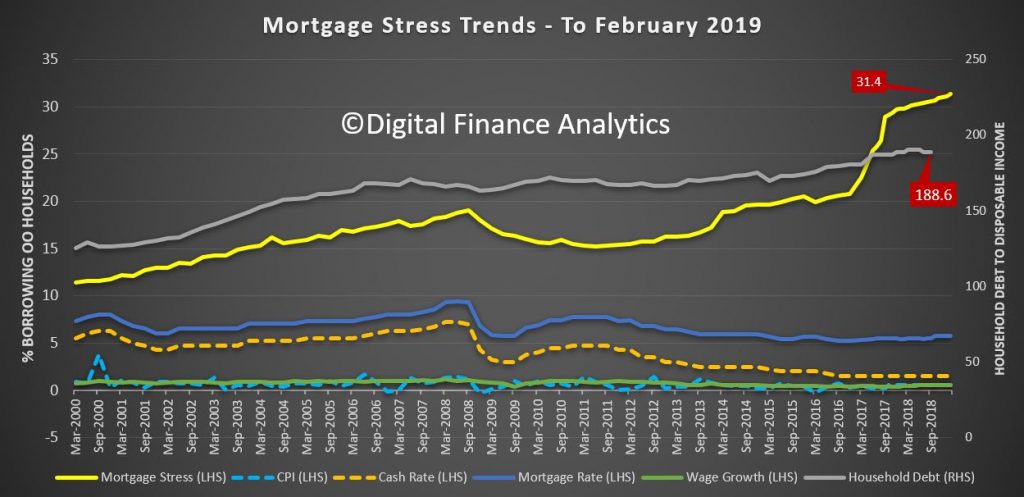
Digital Finance Analytics (DFA) has released the February 2019 mortgage stress and default analysis update. Unfortunately, the pressure on households continues to rise as weak ongoing wages growth is not offsetting costs of living, and mortgage repayments and total debt still grows. In addition, the number of households in severe stress continues to rise, suggesting a lift in potential defaults later.
The latest RBA data on household debt to income to September fell a little to 188.6[1], but still remains highly elevated. The housing debt ratio continues to climb to a new record of 139.6, according to the RBA. This shows that household debt to income is still increasing.
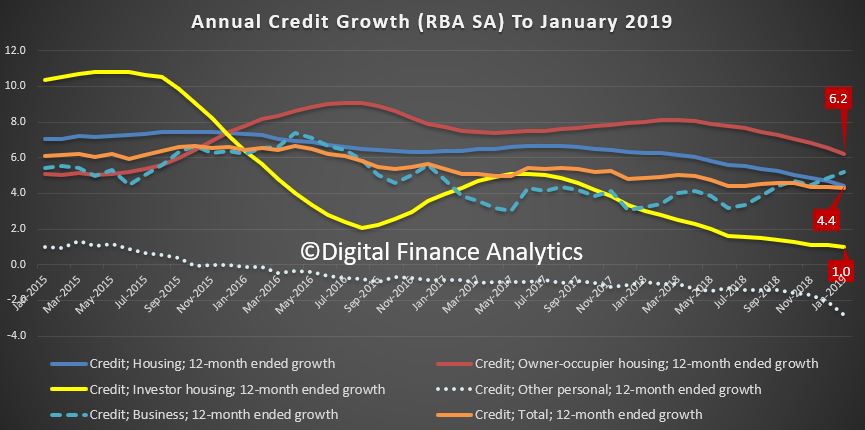
This is confirmed by the latest financial aggregates recently released by the RBA, to end January 2019, with owner occupied lending still growing significantly faster than inflation at 6.2%.
This high debt level helps to explain the fact that mortgage stress continues to rise.
Across Australia, more than 1,036,214 households are estimated to be now in mortgage stress (last month 1,026,106), another new record. This equates to more than 31% of owner occupied borrowing households. In addition, more than 28,903 of these are in severe stress (last month 25,750). We estimate that more than 66,000 households risk 30-day default in the next 12 months, up 3,000 from last month. We continue to see the impact of flat wages growth, rising living costs and higher real mortgage rates. Bank losses are likely to rise a little ahead.
Our analysis uses the DFA core market model which combines information from our 52,000 household surveys, public data from the RBA, ABS and APRA; and private data from lenders and aggregators. The data is current to the end of February 2019. We analyse household cash flow based on real incomes, outgoings and mortgage repayments, rather than using an arbitrary 30% of income.
Households are defined as “stressed” when net income (or cash flow) does not cover ongoing costs. They may or may not have access to other available assets, and some have paid ahead, but households in mild stress have little leeway in their cash flows, whereas those in severe stress are unable to meet repayments from current income. In both cases, households manage this deficit by cutting back on spending, putting more on credit cards and seeking to refinance, restructure or sell their home. Those in severe stress are more likely to be seeking hardship assistance and are often forced to sell.
Despite the oft repeated view that household finances are fine, the continued accumulation of larger mortgages compared to income whilst costs are rising and incomes static explains the issues we are now seeing.
Housing credit growth is running significantly faster than incomes and inflation, and continued rises in living costs – notably child care, school fees and electricity prices are causing significant pain, this despite some relief at the bowser. Many continue to dip into savings to support their finances. We are seeing a rise in households seeking help with their finances, including access to debt counsellors and other advice channels. WA is seeing very strong growth in cries for help, but pain in NSW is also on the rise.
Indeed, the fact that significant numbers of households have had their potential borrowing power crimped by lending standards belatedly being tightened, and are therefore mortgage prisoners, is significant. “More than 40% of those seeking to refinance are now having difficulty. This is strongly aligned to those who are registering as stressed. These are households urgently trying to reduce their monthly outgoings”.
The next question to consider is which households are being impacted. In fact, negative equity is touching “lots of different segments” of the market for different reasons, but collectively it is an “early warning sign” for what is to come.
Probability of default extends our mortgage stress analysis by overlaying economic indicators such as employment, future wage growth and cpi changes. Our Core Market Model also examines the potential of portfolio risk of loss in basis point and value terms. Losses are likely to be higher among more affluent households, contrary to the popular belief that affluent households are well protected. This is shown in the segment analysis below:
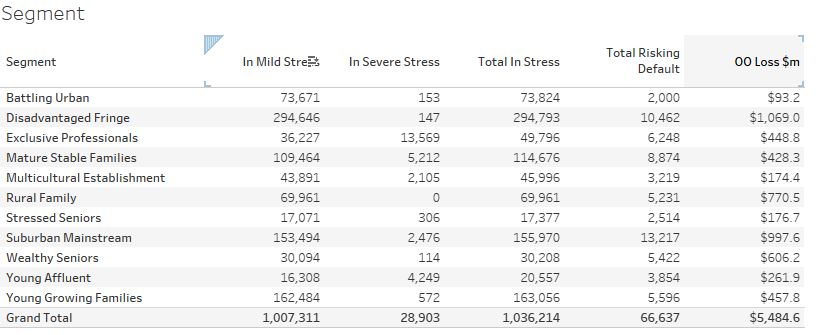
Stress by the numbers.
Regional analysis shows that NSW has 286,469 households in stress (282,165 last month), VIC 278,091 (278,860 last month), QLD 185,424 (185,493 last month) and WA has 139,142 (139,621 last month). The probability of default over the next 12 months rose, with around 12,500 in WA, around 12,100 in QLD, 16,800 in VIC and 17,700 in NSW.
The largest financial losses relating to bank write-offs reside in NSW ($1.1 billion) from Owner Occupied borrowers) and VIC ($1.49 billion) from Owner Occupied Borrowers, though losses are likely to be highest in WA at 3.3 basis points, which equates to $1,048 million from Owner Occupied borrowers.
A fuller regional breakdown is set out below.
And here is a list of the highest count of stressed households by post code across the country.
Handling Mortgage Stress
Households who are in financial difficulty should not ignore the signs. Though many do. And trying to refinance to solve the problem often ends up just postponing the inevitable.
We think there are some simple steps households can take:
Step one is to draw up a budget, so you can see where the money is coming and going. From our research, only half of households have any budget. This means you can then make decisions about what is most important, and what can be foregone. Select and prioritise.
Step two is to talk with your lender, as they have a legal obligation to assist is case of hardship. Yet many households avoid having that conversation, hoping the problem will cure itself. I have to say, in the current low-income growth, high cost environment, that is unlikely. And remember rates are likely to rise at some point.
Step three. Work out what would happen if mortgage rates rose by say half or one percent. Pass that across your budget and examine the impact. Then you will really know where you stand. Then plan accordingly.
[1] RBA E2 Household Finances – Selected Ratios September 2018
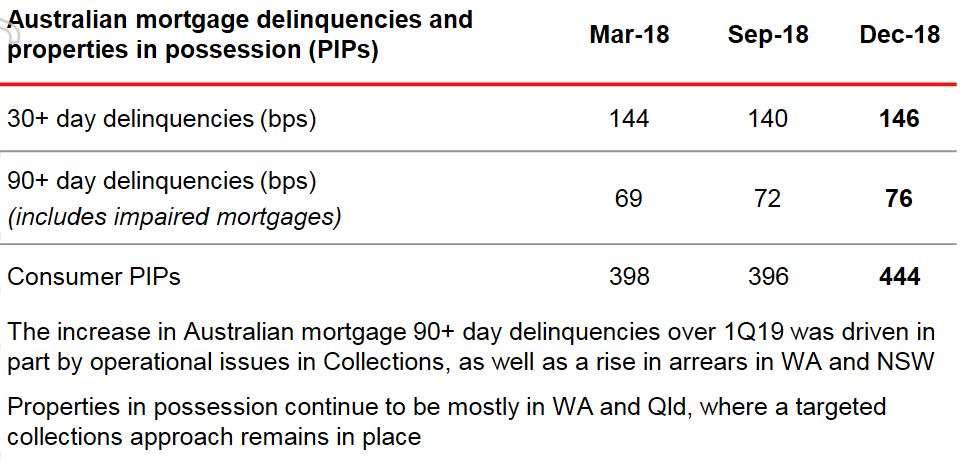
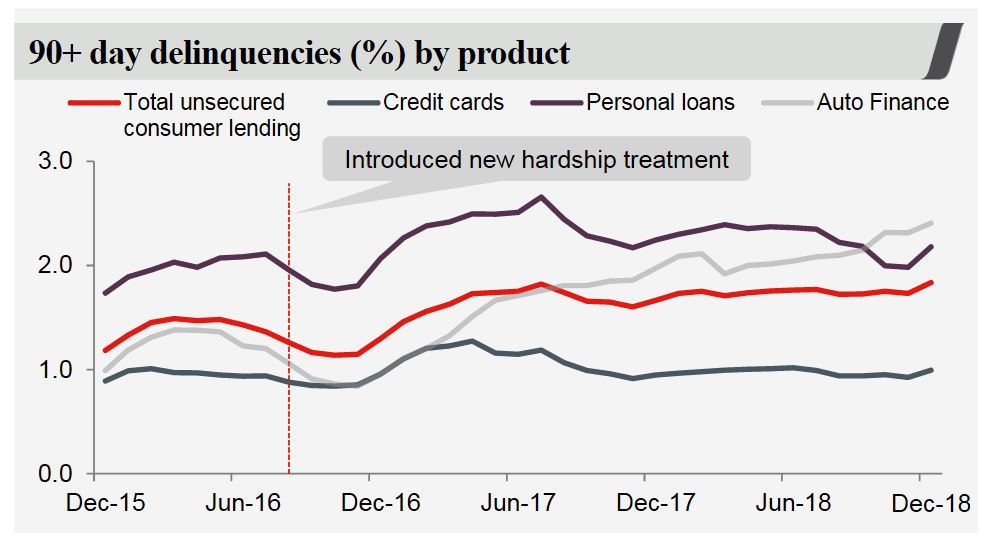
Westpac released their Pillar 3 report for December 2018, plus data on asset quality funding and capital. Of most interest to me was their mortgage data, which shows loan volume growth slowing, and rising delinquencies. The number of properties in possession rose from 396 to 444 in a quarter!
They said their audited statutory net profit for 1Q19 was $1.95 billion, comparable to 2H18.
They reported net interest margins excluding treasury was higher following repricing last year. There was a weaker contribution from treasury.
Provisions were $4,066 million compared with Sep 18’s $3,053.

On 1 October 2018 Westpac adopted AASB 9 and AASB 15. The models for implementation of these standards are still to be finalised and so current changes associated with implementation are preliminary and may change. These will be finalised with Westpac’s First Half 2019 results.
Some transitional impacts from the adoption of AASB 9 have included: i) an increase in collectively assessed provisions of $974 million; ii) a reduction in retained earnings and an increase in deferred tax assets; iii) a $3.9 billion reduction in risk weighted assets; iv) a rise in reported stressed assets; and• v) a 2 basis point increase in the CET1 capital ratio.
Impairment charge was $204 million. $30m pre-tax in insurance claims for Sydney hailstorms are expected.
Westpac showed the slowing in mortgage lending we are seeing across the majors.

Mortgage Interest only lending was 32% of portfolio at 31 Dec 2018 (down from 35% at 30 Sep 2018). Investor lending growth, using APRA extended definition, 0.8% pa

They have a portfolio of IO loans, some at 10 years plus. 16% expire this year.

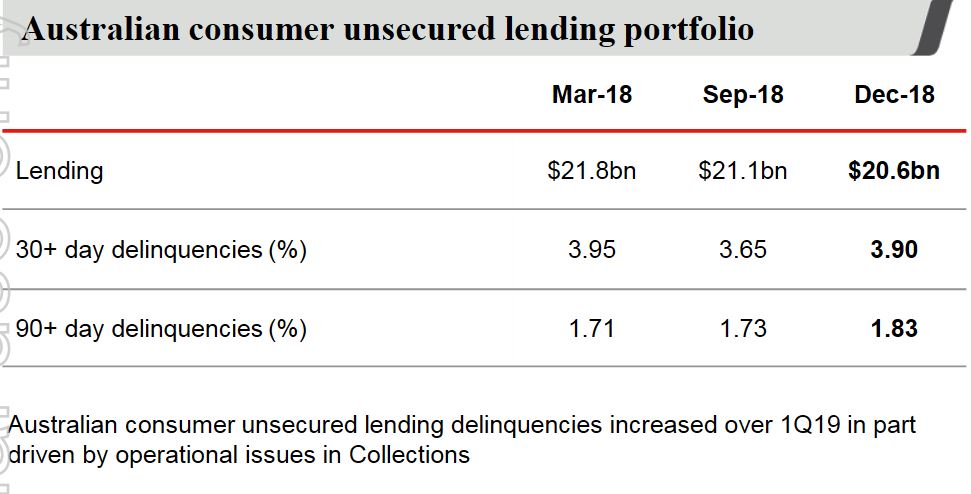
Australian mortgage delinquencies were 4 basis points higher over the quarter while Australian unsecured delinquencies were also higher, up 10 basis points. The number of properties in possession rose from 396 to 444 in a quarter!


Australian unsecured 90+ day delinquencies increased to 1.83% (up 10bps over the quarter)

The Group’s common equity Tier 1 (CET1) capital ratio was 10.4% at 31 December 2018. The ratio was lower than the 10.6% reported for September 2018 after payment of Westpac’s final dividend (net of DRP), which reduced the CET1 capital ratio by 69 bps. Excluding the dividend payment, the CET1 capital ratio increased 49 basis points.

Liquidity coverage ratio (LCR) 128%, net stable funding ratio (NSFR) 112%
$16bn of term funding was raised during 4 months to 31 January 2019
Finally, a warning about capital.
Australia’s big banks may struggle to raise the amount of extra capital they require under new rules proposed by the country’s banking regulator, a senior executive at Westpac Banking Corporation said in an interview published on Monday.
The mooted requirements, which the country’s four largest lenders said would mean they need to raise between A$67 billion and A$83 billion over four years ($48 billion to $60 billion) are sound in principle but tough to achieve, Westpac treasurer Curt Zuber told the Australian Financial Review newspaper.
“As we go through cycles, it is potentially problematic for the banks to get the volumes they need in an economic way for the system which allows for the balance we want to achieve,” he said.
John and Martin discuss the economic and social horrors that are currently playing out in postcode 2570 which is in the Camden Area (South West Sydney).
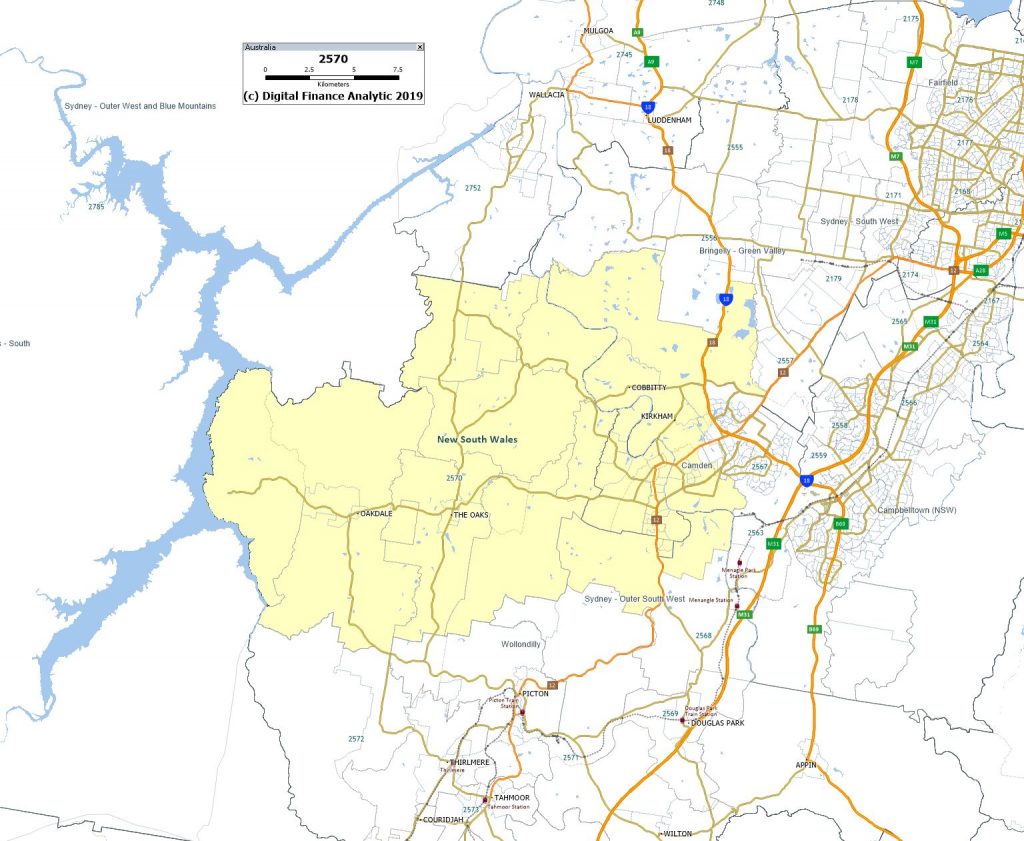
The postcode includes the Camden area as well as Oran Park. This postcode got John Adams’ attention after a Sydney Morning Herald article reported earlier this week that the Camden area has seen a significant spike in domestic violence (DV) which the police has said is due to mortgage stress!
This story is intriguing given that John Adams’ was warning in 2018 of massive social consequences from poor economic crisis prior to and after the coming economic crisis.
This is a summary of the full show which we have posted on our new channel “In The Interests Of The People“.
An online legal service designed to support borrowers tackling mortgage stress has been launched by the NSW government, via The Adviser.

NSW Attorney-General Mark Speakman has announced the launch of LawAccess NSW, a website designed to offer free legal services to help borrowers overcome mortgage stress and settle rates debts with local councils without being drawn into court proceedings.
According to the government, the LawAccess NSW website provides two interactive guided pathways to match people with the information they need to resolve issues “before they spiral out of control”, with another four pathways on other topics to be released later this year.
“This service is arriving at a crucial time for families facing mortgage stress. The online pathways are convenient and easy to use, with users only needing to answer a few simple questions to get reliable legal information and practical solutions tailored to address their situation,” Mr Speakman said.
“For example, the mortgage stress pathways provide information on budgeting, seeking a ‘hardship variation’ to a loan and tips on avoiding ‘quick fix’ pitfalls that could ultimately cause greater financial pain.”
The government stated that the launch of the LawAccess NSW website is part of the NSW government’s $24 million Civil Justice Action Plan, which it said is “harnessing technology and innovation to make it faster and easier for people to navigate courts and resolve legal problems”.
“The Civil Justice Action Plan has huge potential to reduce stressful and costly legal headaches – particularly for small businesses that are the engine room of the NSW economy,” Mr Speakman added.
“While criminal matters tend to dominate the media news cycle, 85 per cent of legal problems in NSW relate to civil law. So, it’s vital we address these civil issues faced by almost 2.4 million people in this state every year.”