I discuss the Shadow Treasurer’s comments relating to sitting out negative equity with Ross Greenwood on 2GB
Mr Bowen said they would “only lose money if you sell”. “I mean sometimes lots of people go into negative equity when the housing market does fall,” Mr Bowen told ABC’s Triple J this week. “I remember when I first was in the housing market I went into negative equity for a while. … The market does come back.
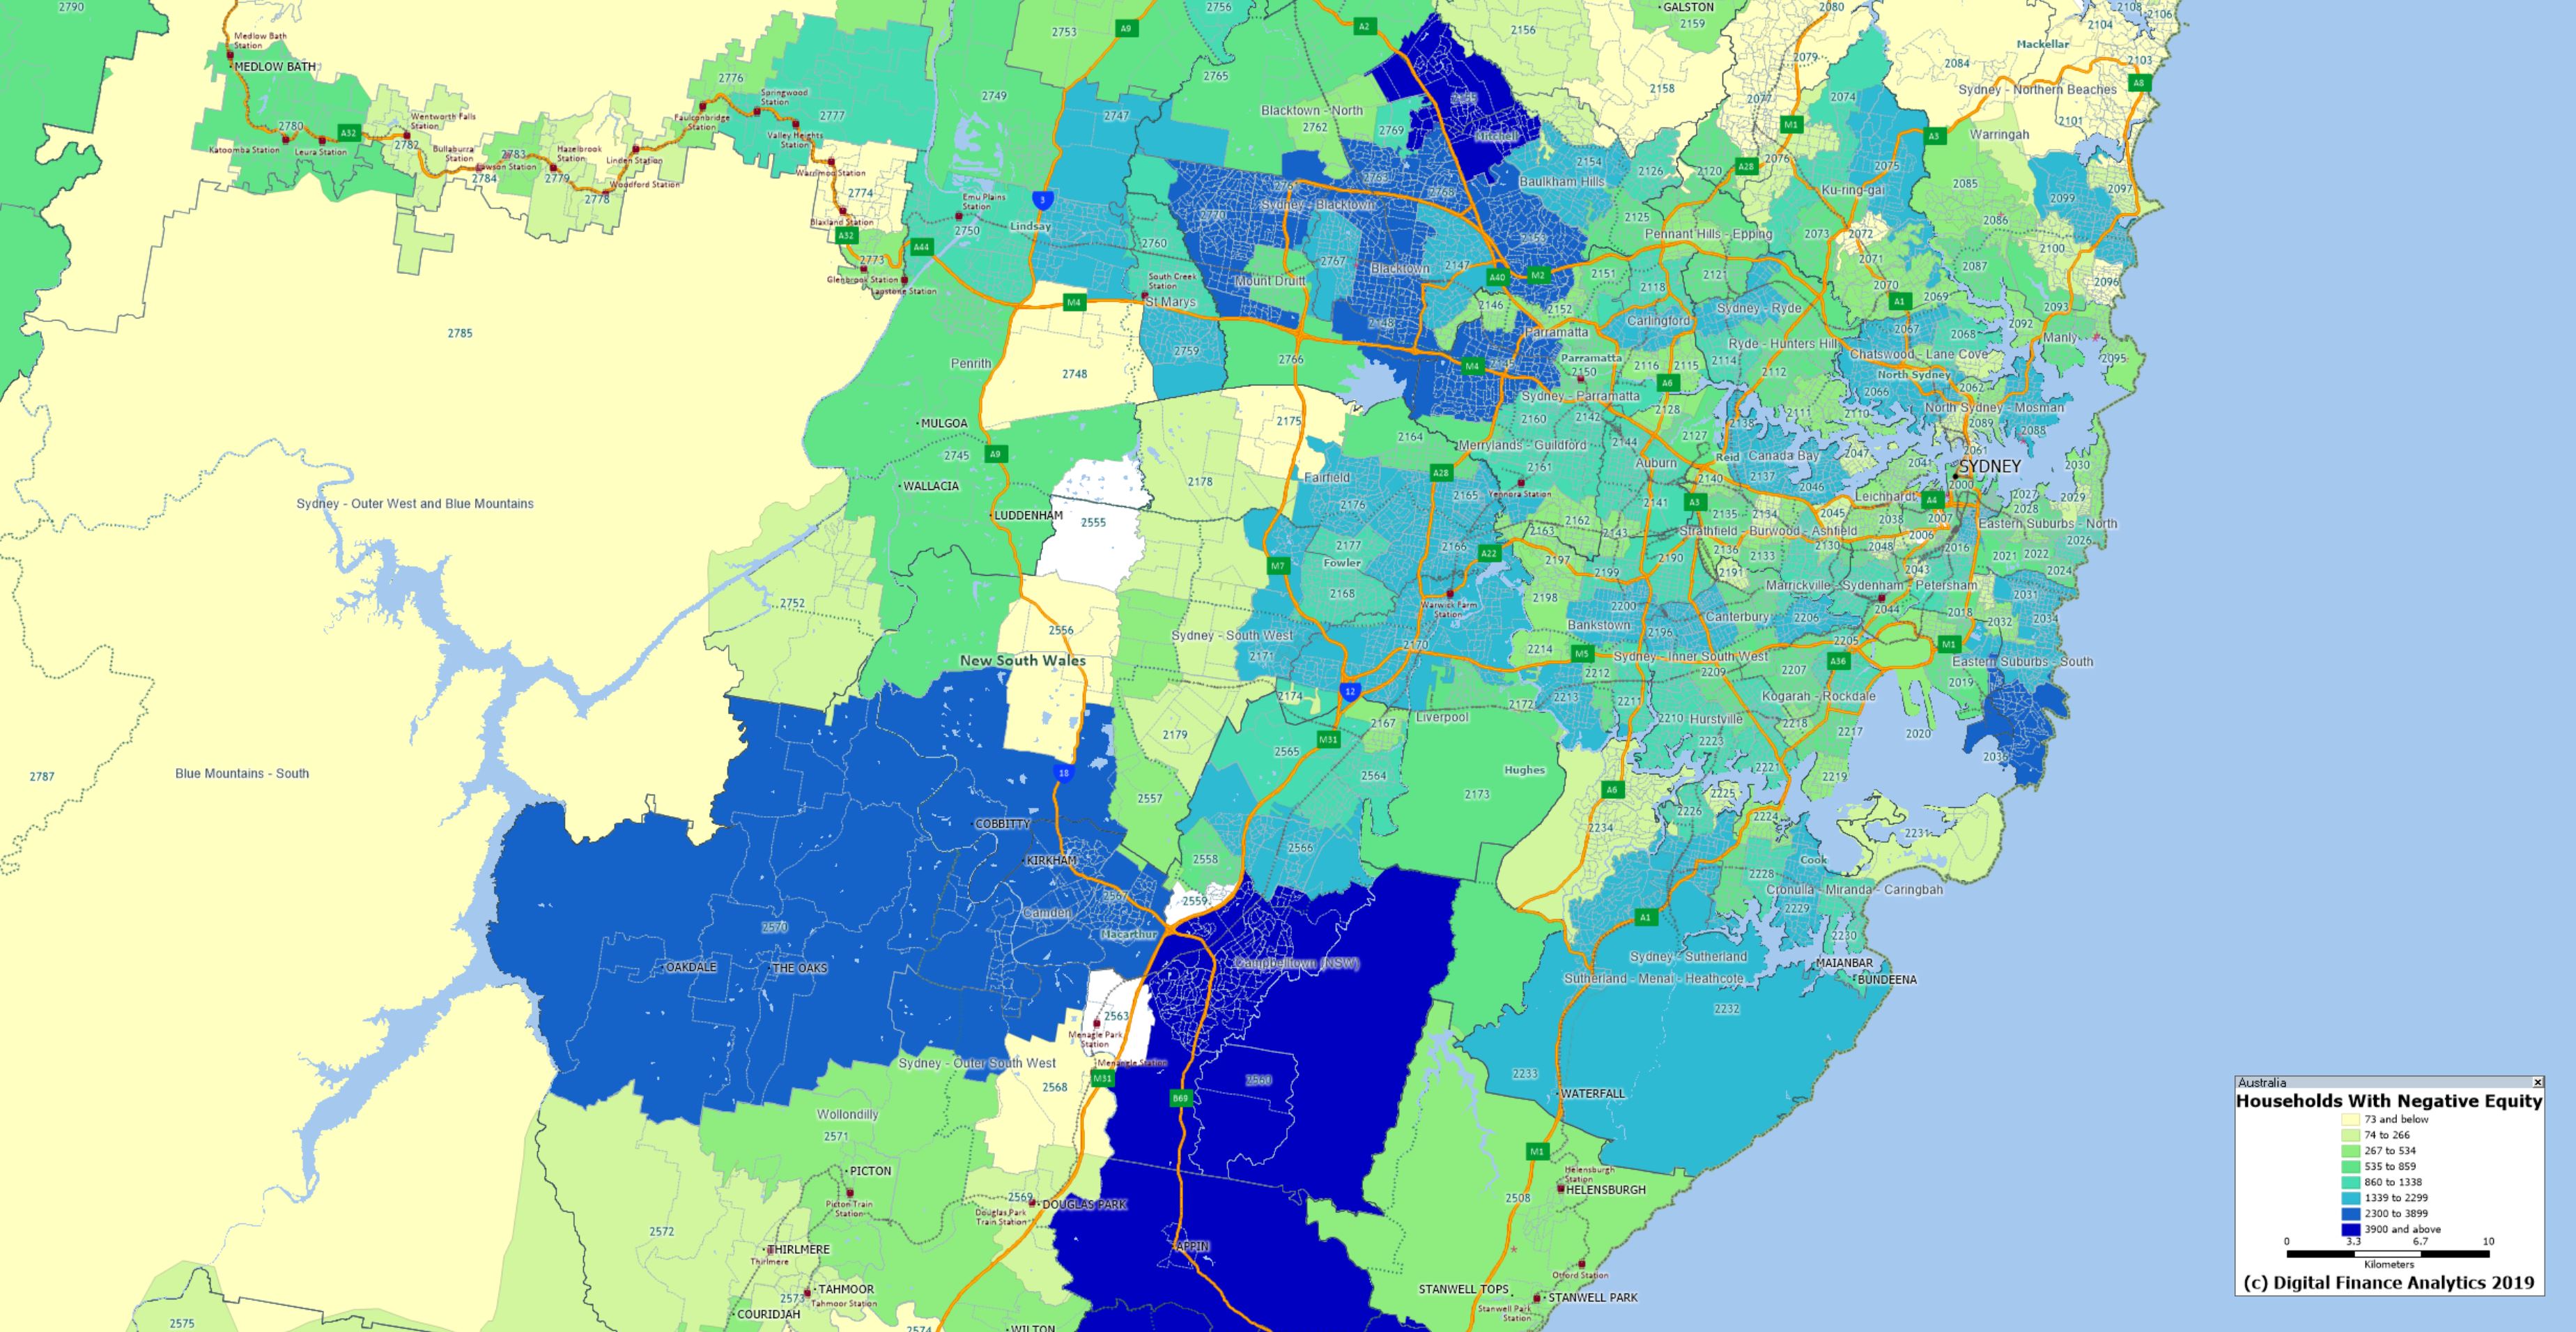
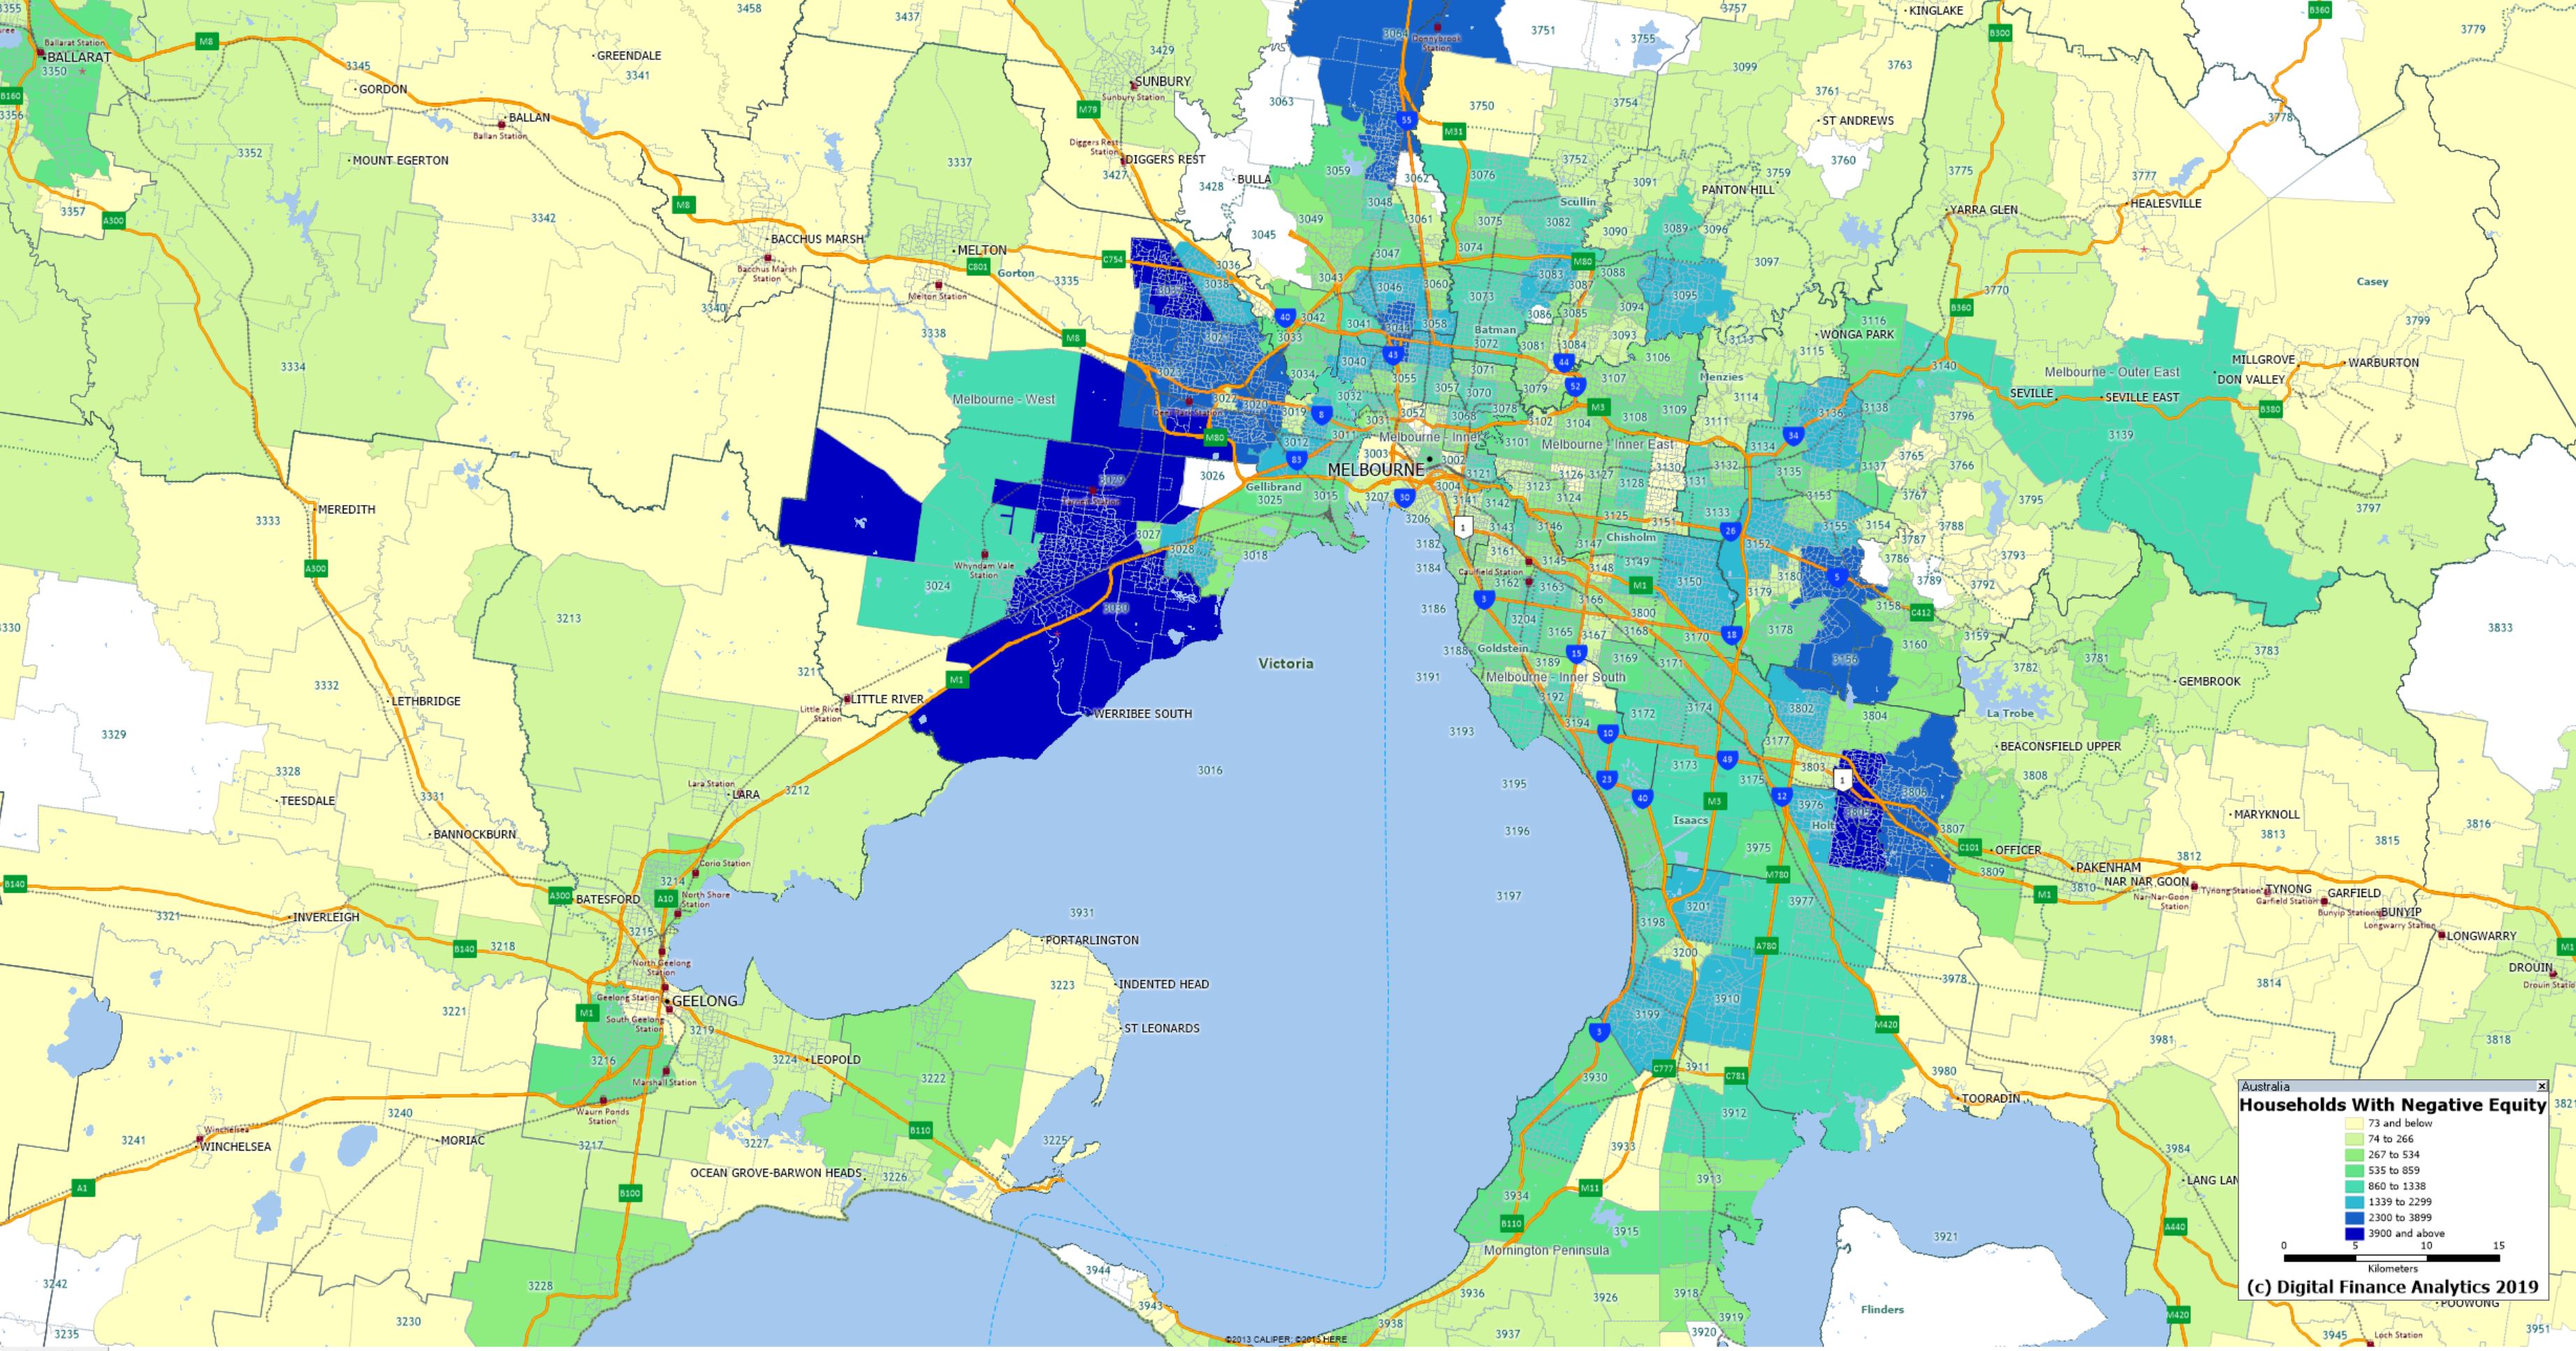
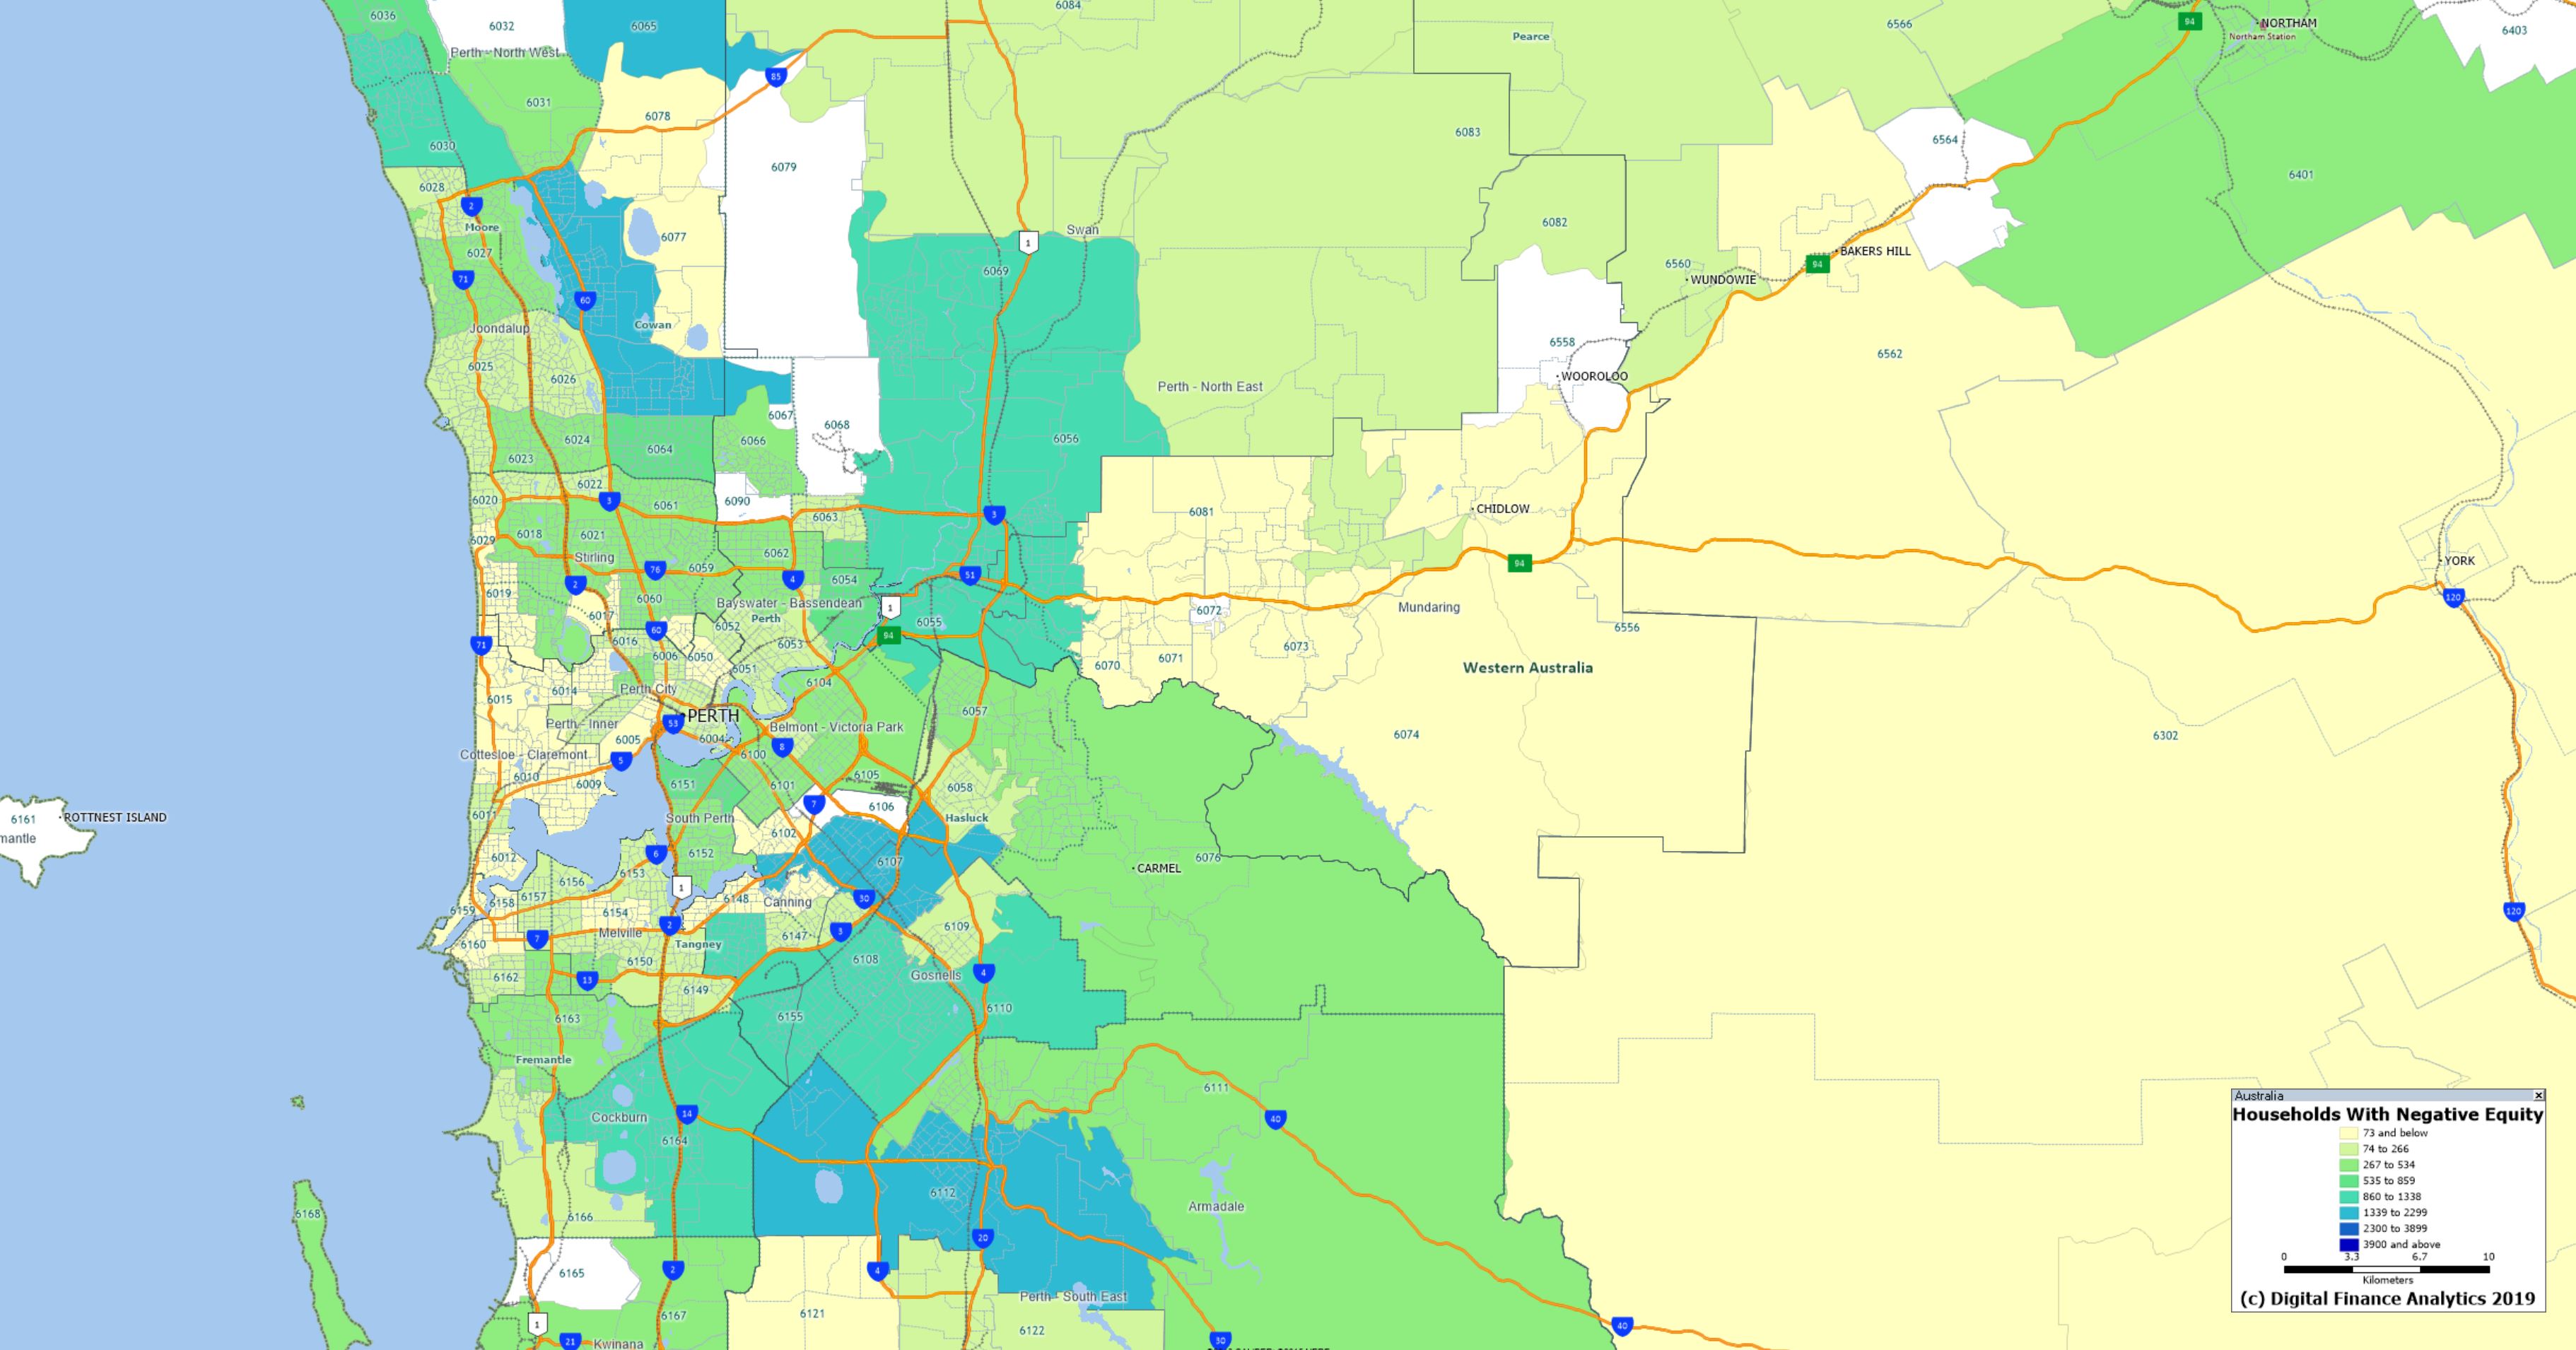
Following 7/30’s report last night I have received a number of requests for access to the maps. So here are the high resolution versions for Sydney, Melbourne and Perth. If they are reproduced elsewhere, please attribute DFA.
As discussed in my video, this is based on the number of households in each post code recording at least one property in negative equity – where the current mortgage (net of any offset accounts) in greater than the estimated current forced sale value plus sale costs. The analysis is based on results from our 52,000 household surveys nationwide.
The RBA released their Financial Stability report today, and even with the rose tinted RBA glasses there are a number of worrying issues touched on. Though none new. But their analysis of negative equity is over optimistic. So we will look at what they say, and highlight some additional considerations.
The RBA said:
Domestic economic conditions remain broadly supportive of financial stability. The unemployment rate has remained around 5 per cent since the previous Review and corporate profit growth has also been strong.
However, GDP growth in Australia also slowed in the second half of 2018. In particular, consumption growth eased and the outlook for consumption is uncertain.
Conditions in the housing market remain weak. Nationally, housing prices are 7 per cent below their late 2017 peak, although they are still almost 30 per cent higher since the start of 2013.
Growth in housing credit was slightly lower over the six months to February than the preceding half year, with investor credit hardly growing at all.
Nationally, falling housing prices have been driven by weaker demand and increased housing supply. The tightening in the supply of housing credit from improved lending standards has played a smaller part. Importantly, these more rigorous lending standards have seen the quality of new loans improve in recent years.
Measures of financial stress among households are generally low and households remain well placed to service their debt given low unemployment, low interest rates and improvements to lending standards. However, there has been an increase in housing loan arrears rates. The increase in arrears has been largest in Western Australia, where the decline in mining related activity has seen housing prices fall for nearly five years and unemployment increase.
They did in “deep dive” on negative equity using their securitised loan data.
Large housing price falls in parts of Australia mean some borrowers are facing negative equity – where the outstanding balance on the loan exceeds the value of the property it is secured against. Negative equity creates vulnerabilities both for borrowers and lenders. A borrower having difficulty making loan repayments who has negative equity cannot fully repay their debt by selling the property. Negative equity also implies that banks are likely to bear losses in the event that a borrower defaults. Evidence from Australia and abroad suggests that borrowers who experience an unexpected fall in income are more likely to default if their loan is in negative equity.
At present, the incidence of negative equity remains low. Given the large increases in housing prices that preceded recent falls and the decline in the share of mortgages issued with high loan to- valuation ratios (LVRs), housing prices would need to fall significantly further for negative equity to become widespread. However, even if this did occur, increased defaults would be unlikely if the unemployment rate remains low, particularly given the improvements in loan serviceability standards over recent years.
Estimating the share of borrowers with negative equity requires data on current loan balances and property values. The RBA’s Securitisation Dataset contains the most extensive and timely data on loan balances and purchase prices.
The Securitisation Dataset includes about one-quarter of the value of
all residential mortgages, or around 1.7 million mortgages.
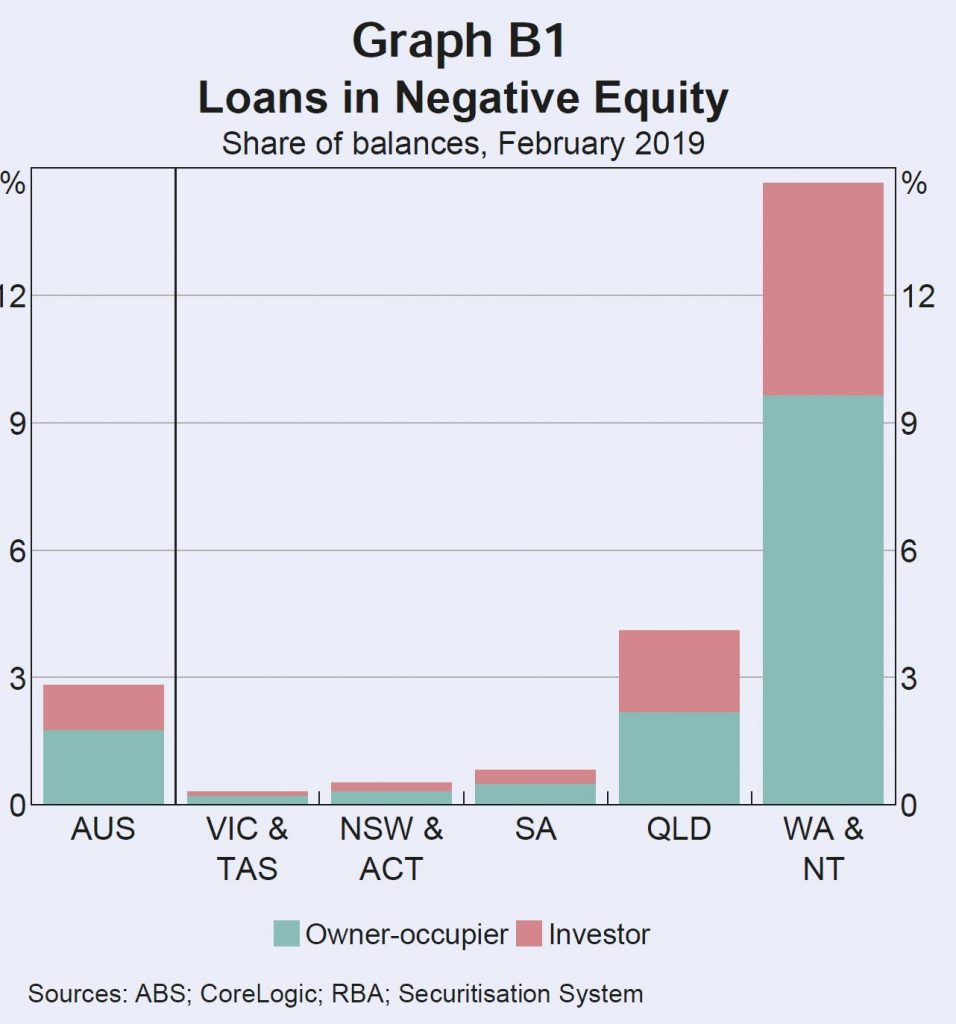
This data can be combined with regional data on housing price movements to estimate the share of loans that are currently in negative equity. This suggests that nationally, around 2¾ per cent of securitised loans by value are in negative equity (just over 2 per cent of borrowers). The highest rates of negative equity are in Western Australia, the Northern Territory and Queensland, where there have been large price falls in areas with high exposure to mining activity. Almost 60 per cent of loans in with negative equity are in Western Australia or the Northern Territory. Rates of negative equity in other states remain very low.
Estimates of negative equity from the Securitisation Dataset may, however, be under or overstated. They could be understated because securitised loans are skewed towards those with lower LVRs at origination. In contrast, the higher prevalence of newer loans in the dataset compared to the broader population of loans, and not being able to take into account capital improvements on values, will work in the other direction. Some private surveys estimate closer to 10 per cent of mortgage holders are in negative equity. However, these surveys are likely to be an overestimate for a number of reasons; for instance, by not accounting for offset account balances.
DFA Says: Of course DFA estimates 10% of households in negative equity, after taking offset balances into account, and also adding in the current forced sale value of the property and transaction costs.
Information from bank liaison and estimates based on 2017 data from the Household Incomes and Labour Dynamics of Australia (HILDA) survey suggest rates of negative equity are broadly in line with those from the Securitisation Dataset.
DFA Says: The HILDA data is at least 2 years old, so before the recent price falls – so this set will understate the current position.
The continuing low rates of negative equity outside the mining exposed regions reflect three main factors: the previous substantial increases in housing prices; the low share of housing loans written at high LVRs; and the fact that many households are ahead on their loans, having accumulated extra principal payments.
Housing prices in some areas of Sydney and Melbourne have fallen by upwards of 20 per cent from their peak in mid to late 2017. But only a small share of owners purchased at peak prices, and many others experienced price rises before property prices began to fall. Properties purchased in Sydney and Melbourne since prices peaked account for around 2 per cent of the national dwelling stock. Looking further back, properties purchased in these two cities since prices were last at current levels still only account for around 4½ per cent of the dwelling stock.
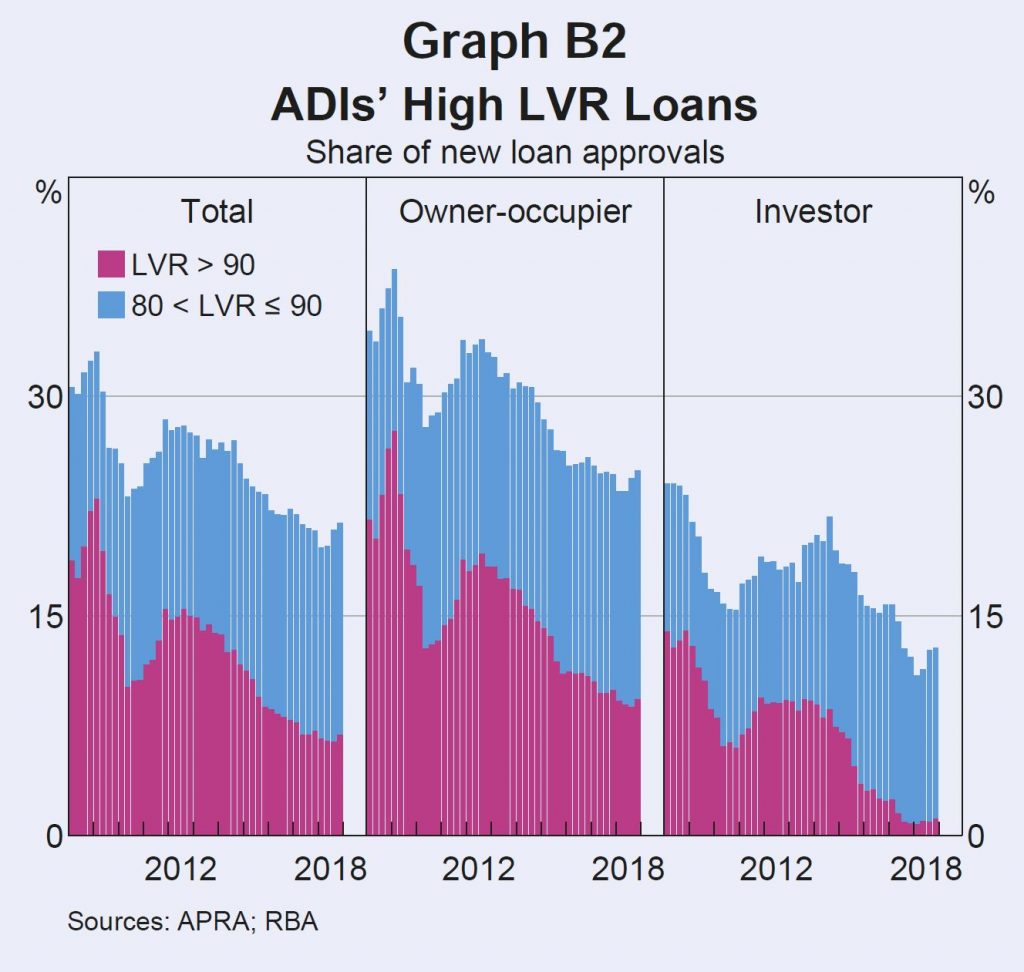
Few recent borrowers had high starting LVRs. Over the past five years, the share of loans issued by ADIs with LVRs above 90 has roughly halved. Since 2017, it has averaged less than 7 per cent (Graph B2). Around 80 per cent of ADI loans are issued with an LVR of 80 or less. Around 15 per cent of owner-occupier borrowers and 20 per cent of investors take out a loan with a starting LVR of exactly 80.
Given most borrowers do not have high starting LVRs, housing price falls need to be large for widespread negative equity. Only 15 per cent of regions have experienced price declines of 20 per cent or more from their peaks. Around 90 per cent of these regions are in Western Australia, Queensland and the Northern Territory.
If a borrower has paid off some of their debt, then price declines will need to be larger still for them to be in negative equity. Most borrowers have principal and interest loans that require them to pay down their debt and many borrowers are ahead of their repayment schedule. Around 70 per cent of loans are estimated to be at least one month ahead of their repayment schedule, with around 30 per cent ahead by two years or more.
When a borrower is behind on repayments and their loan is in negative equity, banks classify the loan as ‘impaired’. Banks are required to raise provisions against potential losses from impaired loans through ‘bad and doubtful debt’ charges. Currently the proportion of impaired housing loans is very low, at 0.2 per cent of all residential mortgages, despite having increased of late (Graph B3).
Queensland, Western Australia and the Northern Territory together account for around 90 per cent of all mortgage debt in negative equity. These states have regions that experienced large and persistent housing price falls over several years.
This has often been coupled with low income growth and increases in unemployment, which have reduced the ability of borrowers to pay down their loans. Loans currently in negative equity were, on average, taken out around five years ago and had higher average LVRs at origination, of around 85 per cent. This made them particularly susceptible to subsequent falls in property values. Investment loans are also disproportionately represented, despite typically having lower starting LVRs than owner-occupier loans. Investors are more likely to take out interest-only loans in order to keep their loan balance high for tax purposes. Around 10 per cent of loans in negative equity have interest only terms expiring in 2019, which is double the share for loans in positive equity. For these borrowers, the increase in repayments from moving to principal and interest may be difficult to manage, especially as loans in negative equity are already more likely to be in arrears. Having more borrowers in this scenario is distressing for the borrowers themselves and for the communities they live in. However, it is unlikely to represent a risk to broader financial stability given it remains largely restricted to mining-exposed regions, which represent a very small share of total mortgage debt.
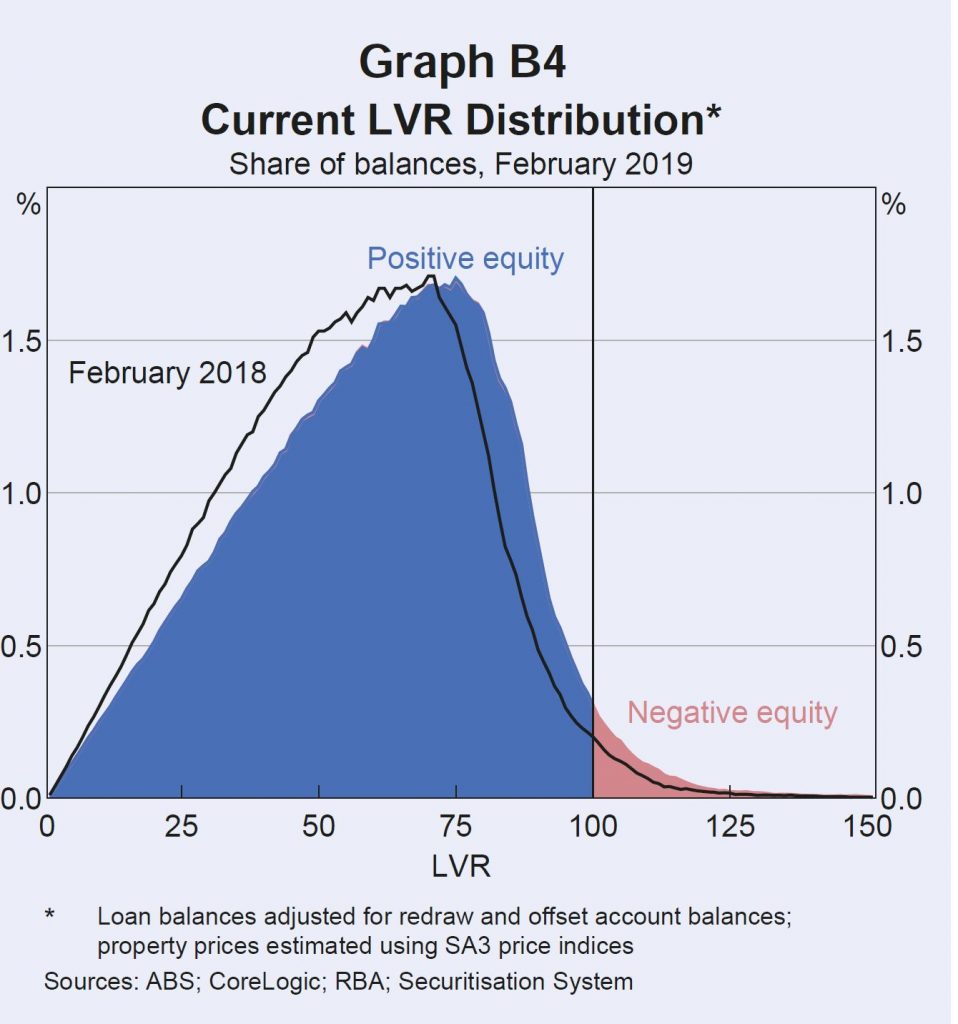
Continued housing price falls would be expected to increase the incidence of negative equity, particularly if they affect borrowers with already high LVRs. Around 11/4 per cent of loans by number (and 13/4 per cent of loans by value) have a current LVR between 95 and 100, making them likely to move into negative equity if there are further housing price falls (Graph B4).
However, compared to the international experience with negative equity during large property downturns, the incidence of negative equity in Australia is likely to remain low. Negative equity peaked in the United States at over 25 per cent of mortgaged properties in 2012 and in Ireland it exceeded 35 per cent, as peak to trough price falls exceeded 30 and 50 per cent respectively.
However, high origination LVRs were far more common in these countries than they have been in Australia.
DFA Says: Except we know there were high levels of mortgage fraud and incorrect data supporting loan applications. Higher than in Ireland.
Even if negative equity was to become more common in the larger housing markets of Sydney and Melbourne, impairment rates for banks are unlikely to increase significantly while unemployment and interest rates remain low.
DFA Says: you need to get post code granular to see what is going on. As our earlier heat map showed.
As home prices fall, the risk of households with mortgages falling into negative equity is rising. This has the potential to have significant economic consequences for households and the community more generally. I discussed this with Frank Chung from new.com.au yesterday who posted an article based on the DFA analysis. As house price falls accelerate, a growing number of mortgage holders across the country are being left in the negative equity “prison”. Today I want to take that forward.
Negative equity is a simple concept, the mortgage you owe on a property is worth more than the current market value of the property. This means that if a household needs to sell, they would be left with an outstanding debt to the bank. And meantime, because of the higher risk, borrowers might potentially facing higher interest rates.
If you are forced to sell, due to a change of circumstances such as the loss of a job, then you are in trouble. Australia has what’s known as “full recourse”, meaning your debt stays with you regardless of your financial situation.
Why is this so relevant now? Well, first forecasts grow darker for how much further the market has to fall, consensus is beginning to circle around the all-important 20 per cent, with 15 out of 21 economists and experts polled by Finder.com.au backing the figure.
As they put it, “The reason the 20 per cent figure is so crucial is most lenders require a 20 per cent deposit. If you borrow with a 20 per cent deposit and the price falls by 20 per cent, obviously you’re going to be in equity parity — any further and you’re going to be in negative equity. This is the first time we’ve seen decline forecasts starting to push into negative equity territory.”
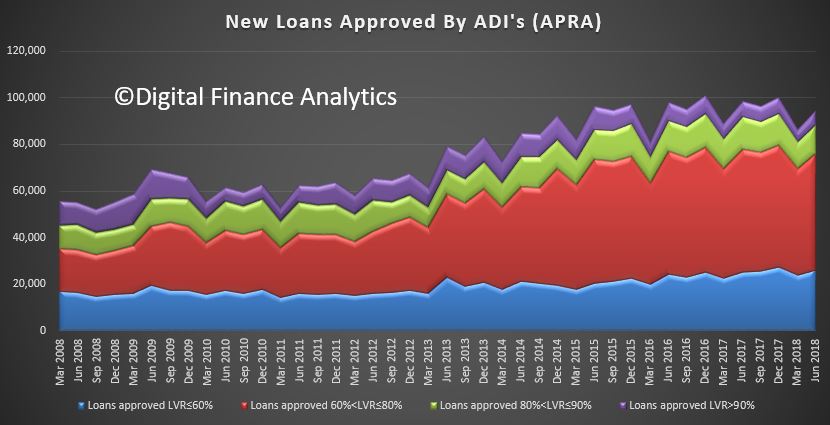
Data from APRA, the Property Exposures figures showed that banks wrote nearly 26,000 new mortgages with a loan to value ratio of more than 90%, and a further 51,000 with an LVR of between 80 and 90 percent. That is 20% of all loans written in the same period. I would expect these numbers to fall significantly, as lenders tighten their standards further.
But it’s also worth remembering that in some cases existing borrowers have pulled more equity out to allow them to pass funds to their kids – the so called bank of Mum and Dad, and in the case of a forced sale, the market value may well overstate the true recovery value of the property. Using a property as an ATM does not work in a falling market.
Last month, a Roy Morgan survey of 10,000 borrowers found 8.9 per cent were slipping into negative equity — up from 8 per cent 12 months prior — which would work out to around 386,000 Australians.
We have run our own analysis with data to the end of November and on my modelling currently there are around 400,000 households across the country in negative equity, both owner-occupiers and investors. There are about 3.25 million owner-occupier borrowers and at least 1.25 million investors, so around 10 per cent of properties are currently underwater.
As you know we run a range of potential scenarios, but if our central case works out, with an average fall of 20-25 per cent, our modelling suggests that around 650,000 households would fall into negative equity. My more severe case, if an international crisis hits is for a 40 per cent price fall.
Then you’re getting close to one million households. That would be catastrophic for the economy. That’s analogous to what happened in Ireland where prices dropped 40 per cent. A decade later, there are still people in negative equity who’ve never recovered.
The next question to consider is which households are being impacted. In fact, negative equity is touching “lots of different segments” of the market for different reasons, but collectively it is an “early warning sign” for what was to come.
For example, people in Western Australia who bought at the peak of the mining boom, have seen prices fall by about 15 per cent over the past five or six years. In some locations, much more. So there are pockets of negative equity there.
More recent first time buyers perhaps enticed by first homebuyer grants and those who purchased in the past six to 12 months are now underwater, particularly if they bought new properties. This is because newly built properties are losing value faster that more established ones. It’s like buying a new car, as soon as you drive it off the lot it drops about 15-20 per cent in value.
Then there are the highly leveraged property investors, often with overlapping mortgages. “Quite often we see investors with multiple properties all going underwater. That’s the real sharp end of this.
Meanwhile, investors in places like Brisbane who purchased off-the-plan apartments 18 months ago are now being required to “pony up” and complete the purchase, but the valuation is coming in at 15-20 per cent below the original price.
Realestate.com.au chief economist Nerida Conisbee was quoted as saying that will be a problem for people trying to settle because the banks might not lend them what they now owe, and could also be a problem for the developers.
And it’s not just first homebuyers and investors — people living in expensive suburbs are also feeling the pinch, as prices are falling faster at the more expensive end of the market. We are seeing pockets of negative equity in places you wouldn’t expect to see it, like Bondi and Mosman in NSW and Toorak in Victoria. So there are some more affluent households now suddenly find they’ve got issues too.
Now let’s consider the impact. Most obviously, it means you’ve lost any paper profit you had. In fact, negative equity is a real bother, it really does have a very negative impact on the economy, households and the wealth effect – as prices rise people feel more confident, as they fall, the reverse is true.
As you know we believe the problem has been set up for decades by loose lending. There is a massive overhang of very highly indebted households, this was a correction that was always going to come — the question now is how far and how fast.
Negative equity also causes banks to “get twitchy” because it means they now have a risk on their book, which could cause them to put up a borrowers interest rate. This is because as the risk profile on that loan goes up the banks will probably put some sort of risk premium on the loan, and we already know many households are struggling with repayments because of flat incomes and rising costs. We will update our mortgage stress results tomorrow.
People with negative equity had very few options except trying to pay it off and wait for the market to rise. If you do sell, chances are you still have a loan remaining. History teaches us people stay put. It basically means you’re stuck, you’re a prisoner in your own property. You just keep paying off their loan, though if you are an investor, you may choose to sell and get out before the losses get worse. As distressed sales mount, so prices will fall further.
Banks of course should also reappraise the risks in their mortgage books, and will need to lift provisions accordingly, which will depress profitability, and require them to hold more capital.
Realestate.com.au said that people have gotten used to rising prices, but when we look historically the people that do well are those that hold through down and up cycles. If we look at the worst price crash we’ve seen in the ‘80s, it took about four years for prices to recover. You need to be mindful property is a long-term game, it pays to hold, it doesn’t pay to panic sell. And If you do have an investment property and it’s gone underwater but you have a stable tenant and can afford to pay off the loan, “try and get through this cycle”.
“The biggest problem when prices fall is that we start to see distressed sales when people can’t service the loan,” they said.
I agree that the main thing is “don’t panic”. “If you are not forced to sell and can continue to make your payments, it’s a paper problem and most people will be in that situation. But if you are forced to sell, due to a change of circumstances such as the loss of a job, then you are in trouble. Australia has what’s known as “full recourse”, meaning your debt stays with you regardless of your financial situation.
And reflect in this, a decade after the GFC there are still households in Ireland and the UK who remain in the negative equity trap, with little prospect of property values recovering to pre-crash levels a decade later.
It seems to me the path ahead will be a rocky road, and just how big the potholes will be will be determined by the extent of the falls, and the length of the negative equity trap. As prices are still likely to fall further, anyone thinking of buying now needs to be very careful. We are in for a long haul.
We have taken AMP’s latest home price projections and run them across our Core Market Model. If his forecast were to eventuate, we think around 17% of borrowing households would fall into negative equity – meaning their outstanding mortgage would be greater than their property value.
AMP’s, Shane Oliver published a piece in which he revised up his expectations of the housing price correction from peak to trough to 20% in Sydney and Melbourne, and 10% nationally, a downgrade from their previous expectation for a 5% national average fall.
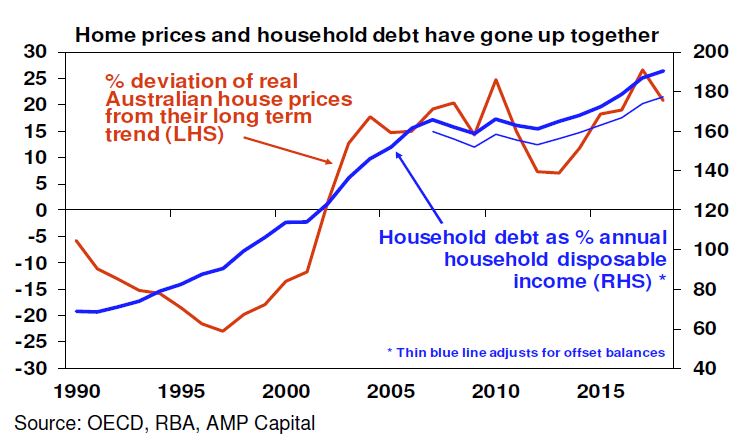
He has, along with a number of other economists progressively raised his expectations of the falls across the market as new data comes to hand. And specifically, he highlights the link between climbing home prices and credit availability. He says “this has taken the household debt to income ratio from the low end of OECD countries to the top end. The shift to overvaluation and high debt mostly occurred over the 1995-2005 period”.
We have taken his projections and run them across our Core Market Model. If his forecast were to eventuate, we think around 17% of borrowing households would fall into negative equity – meaning their outstanding mortgage would be greater than their property value.
Negative equity is tricky, because it limits households ability to refinance, trade up or down, as well have reducing overall economic activity and confidence. After the GFC, we saw many households in the UK locked into their properties for several years, the same could happen here.
In addition, of course there are implications for the banks (should they be adjusting their risk and capital models?) as well as for Lenders Mortgage Insurers, who cover the banks exposures above 80% of loan to value, unless they are covered by their captive insurers. In a falling market the insurers would likely be hit with higher levels of claims. Note of course there is not a one to one link between property price falls and defaults, the risks are much more complex.
But the results from our modelling are worth looking at in more detail, remembering we are using data from our household surveys and other sources. Around 560,000 households would be impacted, and we can slice and dice the data to begin to understand their profiles.
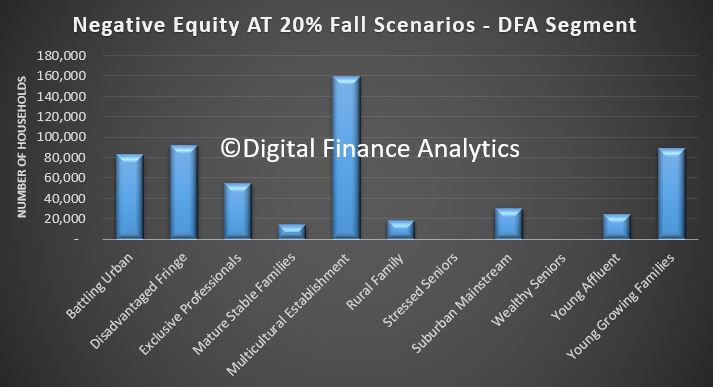
Our core segmentation highlights that Multicultural and Young Families would be hit most severely, in terms of the numbers of households in negative equity, with the Battling Urban and Disadvantaged Fringe following closely. But we also see a fair number of affluent households also caught in a negative equity trap. They are often highly leveraged.
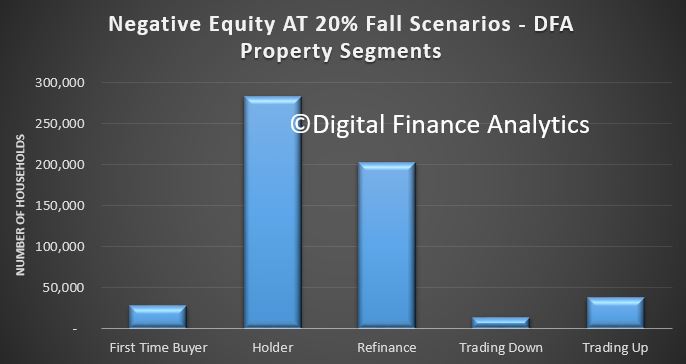
Across our property segments, those holding property without an intent to trade up or down figure as the largest sector, plus those who have refinanced recently. The first time buyer cohort also shows up, but this is a smaller count.
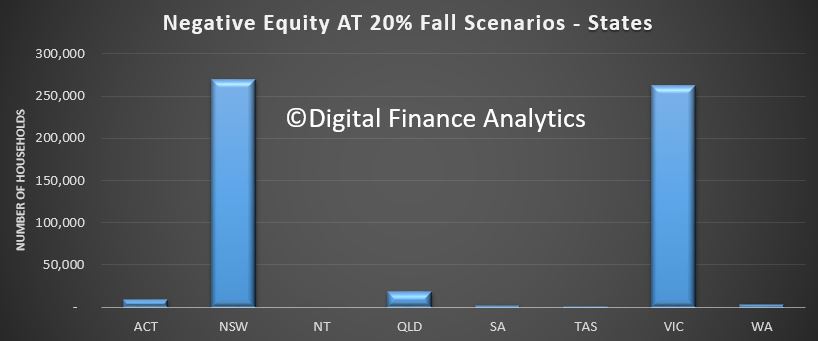
Two states NSW and VIC see the bulk of the negative equity, both states with a strong recent run in prices, and now significant reversals. AMP says 20% falls are likely here.
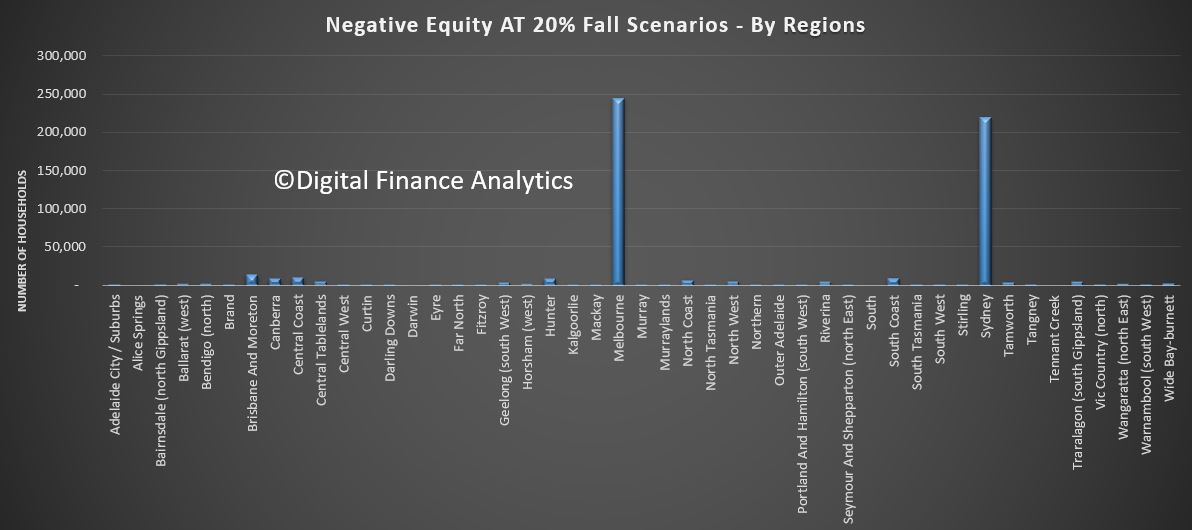
We can also see the more granular regional view showing the same.
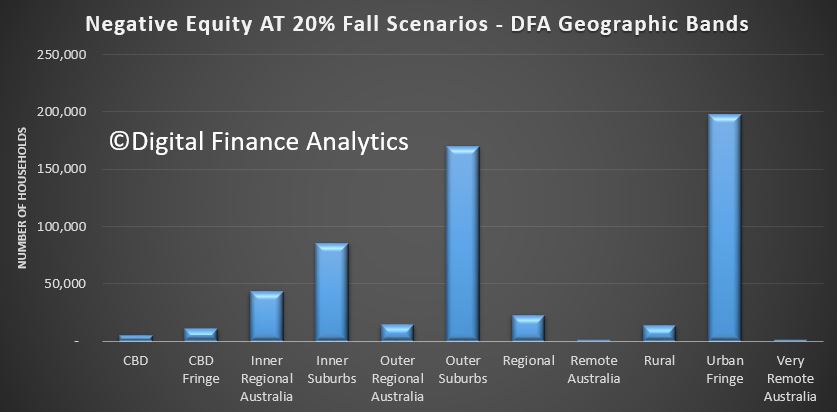
Looking across are geographic bands, we see the urban fringe and outer suburban rings most impacted.
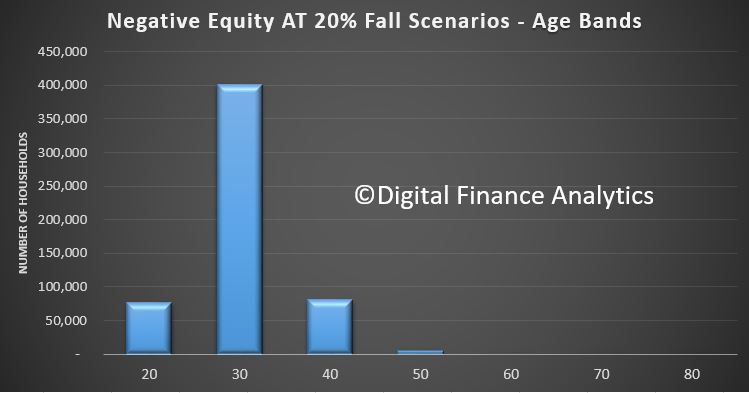
Across the age bands, it is younger households who are most exposed.
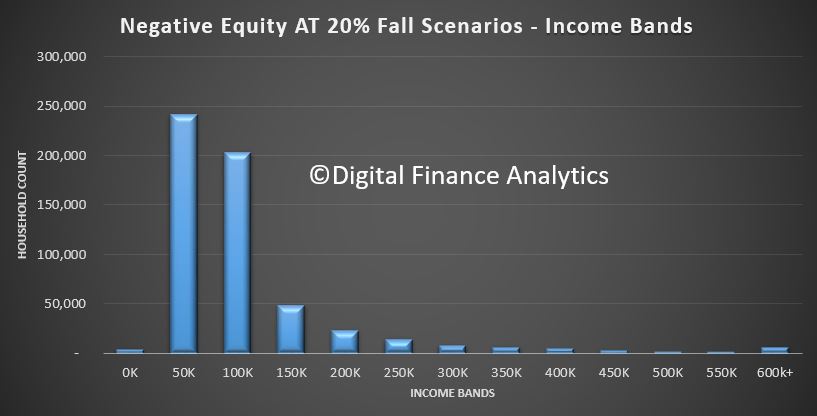
Finally, in terms of income bands, those in the $50-100k and $100-150k bands are most strongly represented.
So, in a nutshell, younger households with more limited incomes are more likely to be exposed to negative equity, especially if they live in the main urban centres of Sydney and Melbourne, and they are more likely to be located in the outer suburban rings.
And finally, if we ran a uniform 20% fall across the country, the number impacted would more than double. Personally I think the smaller centres are also likely to fall further. But we will see!