Following the rates cuts, the Bank Bill Swap Rate has continued to fall.
It is now more than 1.10% lower than its recent peak. This should help to support bank margins, so it will be interesting to see what is reported in the next few days as the bank reporting season fires up.
On Wednesday we will get CBA and Suncorp, and on Thursday AMP, among others.
On Friday we will get the latest Statement on Monetary Policy – watch out for their latest estimates of GDP and inflation, and Philip Lowe will also be testifying before Parliament, after the latest RBA meeting on Tuesday, where most expect no further rate change.
Finally, watch for the job ads data on Tuesday – to see if the rate cuts have lifted job opportunities as the RBA is hoping!
And by the way, it is a “bank holiday” in NSW today!
We review the latest data from the RBA, APRA and ABS, plus higher mortgage delinquencies and the new bill to clamp down on cash transactions. A lot to talk about!
Full show on the war on cash: https://youtu.be/770M2s6ZD8Y
RBA Governor Philip Lowe spoke today, and there were some important points.
First, expect rates to be lower for longer. ” It is highly unlikely that we will be contemplating higher interest rates until we are confident that inflation will return to around the midpoint of the target range”.
Second, the RBA has more capacity to cut if required (we think they will).
Third, moving the 2-3% inflation target band is not something they would want (the Treasurer is currently reviewing the RBA’s mandate and target!). They do not want to “shift the goalposts”!
Here is the speech:
I would like to start by winding the clock back, not by three years, but instead by 40 years. It was 40 years ago that I started studying economics in high school in Wagga Wagga. I sat the 3 unit economics exam for the Higher School Certificate (HSC) in 1979. At that time, the standard exam question was in two parts: why did Australia have both high inflation and high unemployment and what should policy do about it? I recall writing numerous essays on this troubling topic.
I also recall learning about the Misery Index. For those of you whose memories don’t go back
that far, this index is the sum of the unemployment rate and the inflation rate. Few people talk about
this index these days, but I thought it would be useful to show it to you as background (Graph 1).
As you can see, things were pretty miserable in the 1970s and 1980s. Today, though, at least according
to this metric, they are not too bad. The Misery Index is now as low as it has been since the late
1960s. Today, we are living in a world of low and stable inflation and low unemployment. It is useful to
remind ourselves of this sometimes.
Graph 1
So this means that today’s HSC students are likely to be writing about why inflation is so low
at the same time that unemployment is also low. I hope that they are also being asked to write about how
public policy should respond to low inflation and its close cousins of slow growth in nominal wages and
household incomes.
These are important issues to be thinking about. Given this, I would like to use this opportunity to
address two related questions that I am asked frequently.
The first of these is why is inflation so low globally and in Australia?
And the second is, is inflation targeting still appropriate in this low inflation world?
I will then draw on my answers to make some remarks about monetary policy here in Australia.
1. Why is Inflation so Low?
It is useful to start off with a couple of graphs.
The first is the average rate of inflation globally (Graph 2). The picture is pretty clear. Global
inflation declined over the three decades to the early 2000s and has been low and stable for some
time.
Graph 2
Low inflation has become the norm in most economies. This is evident in this next graph, which shows
the share of advanced economies with a core inflation rate below 2 per cent and below
1 per cent (Graph 3). Currently, three-quarters of advanced economies have an inflation
rate below 2 per cent, and one-third have an inflation rate below 1 per cent.
Graph 3
The obvious question is why this has happened?
There is no single answer. But there are three factors that, together, help explain what has happened.
These are: the credibility of the current monetary frameworks; the continuing existence of spare
capacity in parts of the global economy; and structural factors related to technology and
globalisation.
I will say a few words about each of these.
First, the credibility of the monetary frameworks. One of the responses to the high inflation rates of
the 1970s and 1980s was to put in place monetary frameworks with a strong focus on inflation control. In
some countries, this took the form of rewriting the law to require the central bank to focus on just one
thing: inflation. Many countries also adopted an inflation target, with monetary policy decisions being
explained primarily in terms of inflation.
This increased focus on inflation has helped cement low inflation norms in our economies. Many people
understand that if inflation were to pick up too much, the central bank would respond to make sure the
pick-up was only temporary. This means that workers and firms can make their decisions on the basis that
the rate of overall inflation will not be too different from the target rate. This has made the system
less inflation prone than it once was.
The second explanation for low inflation is the continuing existence of spare capacity in parts of the
global economy.
The existence of spare capacity was an important factor explaining low inflation in the aftermath of
the global financial crisis. And today, it remains a factor in some countries, including here in
Australia. But, on the surface, it is a less convincing explanation for low inflation in countries where
unemployment rates are now at multi-decade lows. Based on conventional measures of capacity utilisation,
these economies are operating close to their sustainable limits. One explanation for continuing low
inflation in this environment is that the current rate of aggregate demand growth is simply not fast
enough to put meaningful pressure on capacity. If so, stronger demand growth would be expected to see
inflation pick up. Another possibility is that the unemployment rate, by itself, no longer provides a
good guide to spare capacity, partly due to the flexibility of labour supply. I will come back to this
idea in the discussion of inflation outcomes in Australia.
The third explanation is that globalisation and advances in technology have changed pricing dynamics.
There are two main channels through which this appears to be happening. The first is by lowering the
cost of production of many goods. And the second is by making markets more contestable and increasing
competition. The main effect of these changes should be on the level of prices, rather than
on the ongoing rate of inflation. But this level effect is playing out over many years, so it appears as
persistently low inflation.
It is widely accepted that the entry into the global trading system of hundreds of millions of people
with access to modern technology put downward pressure on the prices of manufactured goods. Reflecting
this, goods prices in the advanced economies have barely increased over the past couple of decades
(Graph 4). But the effects of globalisation and technology extend beyond this and into almost every
corner of the economy, including the services sector.
Graph 4
In today’s globalised world, there are fewer and fewer services that can be thought of as truly
non-traded. Many services can now be delivered by somebody in another country. Examples include: the
preparation of architectural drawings, document design and publishing, customer service roles and these
days many people in professional services work with team members located in other countries. In
addition, many tasks, such as accounting and payroll, are being automated. All this has been made
possible by technology and by globalisation.
The new global technology platforms have also revolutionised services such as retail, media and
entertainment, and transformed how we communicate and search for information and compare prices.
These changes are having a material effect on pricing, with services price inflation lower than it once
was. Many firms know that if they don’t keep their prices down, another firm somewhere in the
world might undercut them. And many workers are concerned that if the cost of employing them is too
high, relative to their productivity, their employer might look overseas or consider automation. And,
more broadly, better price discovery keeps the competitive pressure on firms. The end result is a
pervasive feeling of more competition. And more competition normally means lower prices.[1]
So these are the three important factors that are contributing to low inflation. None of them by
themselves is sufficient to explain what is happening, but together they are having a powerful effect.
The current high inflation rates in Argentina and Turkey remind us that globalisation and technology, by
themselves, do not drive low inflation. The monetary framework clearly matters too. Weaknesses in that
framework still result in high inflation.
2. Is Inflation Targeting Still Appropriate?
This brings me to my second question: is inflation targeting still the appropriate monetary framework
for most countries?
It is understandable that people are asking this question. Given the factors that I have just discussed, some commentators have argued that central banks will find it increasingly difficult to achieve their inflation targets. Some then go on to argue that central banks should just accept this, not fight it; perhaps they should shift the goal posts, or even adopt another monetary framework. A related argument is that the very low interest rates that have accompanied the pursuit of inflation targets are pushing up asset prices in an unsustainable way and sowing the seeds for damaging problems in the future.
You might, or might not, agree with these perspectives. Either way, it is reasonable to ask if we are
on the right track: is inflation targeting still appropriate?
Before I address this question, I would like to push back against the idea that central banks simply
can’t achieve their inflation targets. As we all know, some central banks have struggled to
achieve their targets over a long period of time; Japan and the euro area are the obvious examples. But
this is not a universal experience. Over recent times, inflation has been around target in Canada,
Norway, Sweden and the United Kingdom. So the experience is mixed (Graph 5).
Graph 5
There is no single factor that explains this mixed experience. But countries that are operating nearer
to full capacity are more likely to have inflation close to target. It also appears that if you have an
extended period of very low inflation – as did Japan and the euro area – it is harder to
get back to target as a deflationary mindset takes hold. It is also possible that demographics may be
playing a role, although the evidence here is mixed.
Overall, these varying experiences do not support the idea that it has become impossible for central
banks to achieve their targets.
Here in Australia, some have argued that a lower inflation target would be a good idea given the
ongoing low rates of inflation; that we should adjust our formulation of 2–3 per cent,
on average, over time. Lowering the target might have the short-run advantage of allowing us to say we
have achieved our goal, but shifting the goalposts hardly seems a good way to build long-term
credibility. Shifting the goal posts could also entrench a low inflation mindset.
More broadly, over recent years the international debate has gone in the other direction: that is, to
argue for a higher, not lower, inflation target. The argument is that a higher rate of inflation
– and thus a higher average level of interest rates – would promote economic welfare by
providing more room to lower interest rates, without running up against the lower bound. This greater
flexibility for monetary policy could stabilise the economy when it was hit with a negative shock. To be
clear, I am not arguing for a higher inflation target, but rather acknowledging there are arguments in
both directions.
This brings me back to the question: is inflation targeting still appropriate?
The short answer is yes, but it is important to be clear what this means in practice.
Inflation targeting can mean different things to different people. It comes in different shapes and
sizes. Some versions require a central bank to focus on inflation alone and set monetary policy so that
the forecast rate of inflation is equal to the target. But inflation targeting does not need to be rigid
like this.
In my view, an inflation targeting regime should consist of the following four elements.
The inflation target should establish a clear and credible medium-term nominal anchor for the
economy.
A high degree of uncertainty about future inflation hurts both investment and jobs. The economy works
best if there is a degree of predictability. Most people can cope with some variation in the inflation
rate from year to year. But dealing with uncertainty about what inflation is likely to average over the
medium term is more difficult. Inflation targeting plays an important role in reducing that uncertainty
by providing a strong nominal anchor.
The inflation target should be nested within the broader objective of welfare maximisation.
It is worth remembering that inflation control is not the ultimate objective. Rather, it is a means to
an end. And that end is the welfare of the society that we serve. I sometimes feel that as some central
banks sought to establish their credentials as inflation fighters they over-emphasised the importance of
short-run inflation outcomes. And this has been difficult to walk back from. Some central banks have
been concerned that if they gave weight to other considerations, the community might doubt their
commitment to inflation control. So, it became all about inflation.
But central banks have a broader task than just controlling inflation in a narrow range. They play an
important role in preserving macroeconomic stability and thus the steady creation of jobs. Also, their
decisions affect borrowing and asset prices and thus financial stability too. Central banks have to
determine how to balance these considerations when making monetary policy decisions. This means it makes
sense for inflation targeting to be embedded within the broader objective of maximising the welfare of
society.
The inflation target should have a degree of flexibility.
This is not to say that the target itself should be flexible; this would diminish its usefulness in
providing a medium-term anchor. Rather, some variation in inflation from year to year is acceptable and
indeed unavoidable. How much variation is too much is difficult to know, but the variation should not be
so large that it generates doubt about the commitment of the central bank to achieving the target over
time.
The inflation target needs to be accompanied by a high level of accountability and transparency.
If the inflation target is operated flexibly and is nested within the broader objective of welfare
maximisation, the central bank has a degree of discretion. It is important that when exercising this
discretion, the central bank is transparent. Problems can arise if the community doesn’t
understand the central bank’s actions, or if they see it as acting unpredictably or
inconsistently with its mandate. This means you should expect us to explain what we are doing, why we
are doing it and how we are balancing the various trade-offs.
So these are the four elements that I see as important to an effective inflation-targeting regime.
We have all four elements in Australia. Our commitment to deliver an average inflation rate over time
of 2 point something provides a strong nominal anchor. We have always viewed the inflation target
in the wider context, reflecting the broad mandate for the RBA set out in the Reserve Bank Act
1959. That Act was passed 60 years ago and has stood the test of time. The RBA was also one
of the earliest advocates of flexible inflation targeting – this is evident in our use of the
words, ‘on average, over time’ when describing our target. We also place a heavy emphasis
on explaining our decisions and their rationale to the community.
Our overall assessment is that Australia’s monetary policy framework has served the country well
over the past three decades. The flexibility that has always been part of our regime has helped underpin
a strong and stable economy and has helped Australia deal with some very large economic shocks. We are
not inflation nutters. Rather, we are seeking to deliver low and stable inflation in a way that
maximises the welfare of our society.
Over the nearly 30 years we have had the inflation target, inflation has averaged
2.4 per cent, very close to the midpoint. It has, however, been below this average over recent
years and I will talk about this in a few moments.
Before I do so, it is important to note that we periodically review
the formulation of the current target and examine alternative monetary
frameworks, including at our annual conference last
year.[2] We are also monitoring closely the discussions that are
taking place in the academic community and in other central banks. In my view, the evidence does not
support the idea that a change to our inflation target would deliver better economic outcomes than
achieved by our current flexible inflation target. Some alternative frameworks would also be more
difficult to implement and/or be harder to explain to the community. But it is important that we
regularly examine the arguments.
Australian Monetary Policy
I would now like to discuss recent inflation outcomes and monetary policy in Australia.
Like other countries, Australia has had low inflation over recent years. Over the past four years,
headline inflation has mostly been below 2 per cent, although it has been slightly above that
mark on a couple of occasions (Graph 6). In underlying terms, inflation has been below the band for
three years.
Graph 6
Given this history, it is reasonable to ask why this happened and how the Reserve Bank Board has
thought about it.
I will first focus on the period from late 2016 to late 2018. Through most of this period, gradual
progress was being made in returning inflation to target and the unemployment rate was moving lower.
Inflation was on a gentle upswing and the unemployment rate was coming down more quickly that we had
expected. Reflecting this, in August 2017 the two-year ahead inflation forecast was
2½ per cent. Since then it has been lower than this, at
2–2¼ per cent.
Throughout this period, the Board discussed the case for seeking a faster and more assured return of
inflation to around the midpoint of the target range. It was natural to be discussing this because
having inflation around the midpoint of the target range allows more scope for surprises in either
direction.
As you know, in the end the Board did not adjust interest rates through this period. It judged that
seeking to achieve a faster return of inflation to the midpoint of the target range would have been
accompanied by more rapid growth in debt, at a time when household balance sheets were already very
extended. Our judgement was that, given the progress that was being made towards our goals, it was
appropriate to use the flexibility in our inflation target to pursue a course that was more likely to be
in the country’s long-term interest. We could have generated a bit more inflation, but we would
have had faster growth in household debt as well.
I acknowledge that others might see this trade-off differently. But given the unemployment rate was
coming down and inflation had lifted from its trough, we did not see a strong case for monetary
easing.
Towards the end of last year, that assessment began to shift. Inflation was turning out to be lower
than we had earlier expected and our forecasts for inflation were being marked down. There are a few
reasons for this, but the one I want to highlight today is the flexibility of labour supply, as this
links back to my earlier discussion of the reasons for low inflation globally.
When we prepared our forecasts in mid 2017, we did so on the basis that the share of the adult
population participating in the labour market (the participation rate) would remain steady over the next
couple of years (Graph 7). At the time, this was considered a reasonable forecast: while we
expected some increase in participation from an encouraged worker effect because of solid employment
growth, we thought this would be offset by the ageing of the population.
Graph 7
Since then, things have turned out quite differently. Employment growth has been much stronger than
expected and the participation rate has risen by 1½ percentage points, which is a large change
over a fairly short period. Put simply, the strong demand for labour has been met by more labour
supply.
It is useful to consider the following thought experiment. Suppose the participation rate had still
risen materially, but by ¾ per cent, rather than 1½ per cent. All else
constant, this would have meant the unemployment rate today would have been well below
5 per cent.
This flexibility of labour supply is a positive development and has meant that strong employment growth
has not tested the economy’s supply capacity. More demand for workers has been met with more
labour supply. This has contributed to the subdued wage outcomes over recent times, which in turn has
contributed to the low inflation outcomes.
The more flexible supply side means that employment growth can be stronger without fears of
overheating. At the same time, the unemployment rate that would put upward pressure on inflation is also
lower than it once was.
As the evidence accumulated in support of these propositions, the outlook for monetary policy changed
and the Board lowered the cash rate in June and July. In making these decisions the Board also
recognised that the earlier concerns about the trajectory of household debt had lessened. The Board has
also paid attention to the shift in the outlook for monetary policy globally.
These two recent reductions in the cash rate will support demand in the Australian economy. So too will
recent tax cuts, higher commodity prices, some stabilisation in the housing market, ongoing investment
in infrastructure and a lift in resource sector investment. We also need to remember that the underlying
foundations of the Australian economy remain strong.
It remains to be seen if future growth in demand will be sufficient to put pressure on the
economy’s supply capacity and lift inflation in a reasonable timeframe. It is certainly possible
that this is the outcome. But if demand growth is not sufficient, the Board is prepared to provide
additional support by easing monetary policy further. However, as I have discussed on other occasions,
other arms of public policy could also play a role in this scenario.
Whether or not further monetary easing is needed, it is reasonable to expect an extended period of low
interest rates. On current projections, it will be some time before inflation is comfortably back within
the target range. The Board is strongly committed to making sure we get there and continuing to deliver
an average rate of inflation of between 2 and 3 per cent. It is highly unlikely that we will
be contemplating higher interest rates until we are confident that inflation will return to around the
midpoint of the target range.
The RBA’s Christopher Kent, Assistant Governor (Financial Markets) spoke about the CLF today. Look carefully, as banks effectively can cross collateralise via each others mortgage backed securities – what could possibly go wrong?
I’d like to thank Bloomberg for the opportunity to speak to you about the committed liquidity
facility (CLF). The CLF has been in place now for almost five years.
As we announced in June, after a careful review, the RBA will be adjusting the settings of the CLF
starting from next year.[1] Today, I thought it would be helpful to discuss the developments that have led us to
make these adjustments. We have also published a detailed article on this on the RBA’s
website.[2] But first, let’s review why we needed the CLF in the first place.
Why Do We Need a CLF?
The global financial crisis highlighted how important it is for banks to manage their liquidity risk.
During the crisis, many banks overseas faced significant liquidity problems having not paid enough
attention to their liquidity management in the lead up to the crisis.
Following this experience, the Basel Committee on Banking Supervision proposed tougher liquidity
requirements as part of its broader package of reforms, known as the Basel III regulations. These
changes have made the banking system more resilient to periods of financial market stress.
One of the key planks of the requirement to increase liquidity of the banks was the introduction of the
liquidity coverage ratio (LCR). The LCR requires banks to have enough high-quality liquid assets (HQLA)
to cover their estimated net cash outflows during a scenario that entails a 30-day period of stress. The
idea is that a bank experiencing stress will have enough liquid assets that they can use to meet their
short-term liquidity needs. In this way, each bank holds a sufficient amount of HQLA as self-insurance
against liquidity risk. Like all insurance, this comes at a cost. In this case, the cost to each bank is
incurred because the HQLA earn a lower yield than alternative, less liquid assets that the bank could
otherwise hold, such as mortgages or business loans.
For HQLA securities to be of sufficient quality and liquidity, they should be both low risk and
actively traded in markets. In Australia’s case, Australian Government Securities (AGS) and
securities issued by the state and territory borrowing authorities (semis) meet this test. In contrast,
there is relatively little trading in other Australian dollar securities, such as those issued by
foreign agencies (supras), banks and securitisation trusts (Graph 1).
Graph 1
However, there is less government debt in Australia relative to the size of the banking system, and the
economy more generally, than is the case in many other countries (Graph 2). This means that there
are fewer HQLA in Australia. Indeed, back in 2015, if there had been no other way for Australian banks
to meet their LCR, collectively they would have had to have held around two-thirds of the total stock of
AGS and semis. And if the banks had held such a high share of those government securities, the liquidity
of those markets would have been substantially impaired, thereby defeating the purpose of them being
counted on as HQLA.
Graph 2
In recognition of this issue, the Basel liquidity standards allow jurisdictions with limited HQLA to
use alternative approaches. One of those approaches is for the central bank to offer a facility to
provide banks with a guaranteed source of liquidity.[3] And so the CLF was born. This entails the central
bank committing to stand ready to provide a bank with liquidity against high-quality collateral that
would otherwise be illiquid in the market. This commitment can be counted by banks towards meeting their
LCR. In return for the CLF, banks are charged a fee on the entire committed amount, whether or not it is
actually drawn upon. This fee is akin to the insurance premium that banks would implicitly pay if
instead of the CLF, they had to hold additional HQLA.
Starting from 2015, the RBA has provided the CLF as part of Australia’s implementation of the
Basel III liquidity reforms.[4]
The First Five Years of the CLF
Under the CLF, the RBA commits to provide liquidity under repo against securities eligible in its
operations. To access the CLF, a bank must meet several conditions: it must have paid its CLF fee; the
bank’s CEO has to have attested that the bank has positive net worth; and the RBA has to have
judged that this is indeed the case.[5]
In the five years since the CLF was introduced, 15 banks have applied to APRA for access to the
CLF. None of these banks have needed to draw on the facility in response to a period of financial
stress.
Each year, APRA determines the total size of the CLF. It’s the difference between the banking
system’s liquidity needs and the amount of AGS and semis that the RBA assesses that the banks can
hold without impairing the functioning of the market. The size of the CLF was set at $274 billion in
2015. As an input to this, the RBA assessed that the banks could reasonably hold 25 per cent
of the stock of AGS and semis. This was a sizeable step up from their holdings earlier in the decade
(Graph 3).
Graph 3
However, since then, the stock of AGS and semis has increased by almost a third. In comparison, the LCR
requirements of the banks have been little changed. So the banks can hold more HQLA securities compared
to their liquidity needs. As a result, the size of the CLF has declined to just below $250 billion. The
increase in AGS and semis also means that the shortage of HQLA securities is not as large as it once
was, although there is still a shortage.
Reassessing the Banks’ Reasonable Holdings of HQLA Securities
To assess the amount of HQLA securities that the banks can reasonably hold, the RBA takes into account
the behaviour of other holders of these securities, along with conditions in bond and repo markets.
In 2015, a large share of Australian government debt was held by what can be described as ‘buy
and hold’ investors. That is, these investors were not particularly sensitive to the prices of
these securities, and typically they did not contribute to liquidity in the market. Many of these
investors were non-residents, which were holding nearly 60 per cent of the total stock of HQLA
securities earlier in the decade (Graph 4).
Graph 4
However, over recent years more HQLA securities have become available for use as collateral. In
particular, the Australian repo market has grown substantially, driven by more HQLA securities being
sold under repo. Of note, non-residents have been lending more of their holdings of AGS and semis back
into the domestic market (Graph 5).
Graph 5
Also, our analysis of transactions in bond and repo markets demonstrates that most HQLA securities were
being actively traded. Turnover ratios for individual AGS bond lines were well above zero and much
higher than for other Australian dollar securities. Although semis were traded less frequently than AGS,
only a small share of the bond lines of semis had low turnover ratios (Graph 6). Given this, it
appears unlikely that a moderate increase in banks’ holdings of AGS and semis would present a
problem for liquidity in these markets.
Graph 6
Another issue we considered in 2015 was the ‘scarcity premium’ that was present for AGS.
Australia’s relatively strong economic performance and AAA credit rating have been very appealing
for investors globally. The scarcity premium was prominent in the years leading up to 2015, when the
yield on AGS was well below the expected cash rate over the period to maturity (Graph 7). Since
then, however, the scarcity premium has gradually dissipated. This has occurred alongside an increase in
the stock of AGS. It is also consistent with these securities being less tightly held. The combination
of these changes suggests that the banks can now hold a higher share of the AGS on issue without
impairing the functioning of the market.
Graph 7
This brings us to the first of two changes that we have made to the settings of the CLF. We have
assessed that banks can increase their holdings of HQLA securities from 25 to 30 per cent of
the outstanding stock. This will result in the CLF being smaller than it otherwise would have been. To
minimise the effect of this change on the market, the increase will occur at the gradual pace of
1 percentage point each year, beginning with an increase to 26 per cent in 2020.
Setting the CLF Fee
The second change we are implementing relates to the CLF fee.
The CLF fee should be set at a level at which banks will face similar financial incentives to meet
their LCR through the CLF or by holding HQLA (if there were enough available). However, determining this
level of the fee is easier to do in theory than in practice.
The starting point for determining the fee is to make use of the spread between the yields on HQLA
securities and the collateral that the banks hold for the CLF. This collateral is all eligible for the
RBA’s market operations, and is mainly the banks’ self-securitised residential mortgage
backed securities. We have estimated that this spread was around 90 basis points earlier this year.
But the higher yield on CLF collateral reflects compensation for a variety of risks. In particular, a
sizeable share of the spread owes to the higher credit risk on these securities. However, the CLF fee
should only reflect the liquidity risk component of the spread, and that is very difficult to identify
separately.[6]
When the Reserve Bank set the CLF fee earlier this decade, it looked at repo rates on some CLF-eligible
securities to gauge how much a one-month liquidity premium might be worth. The answer was not very much
in normal circumstances. Based on data from the RBA’s open market operations, it was estimated to
be around 10 basis points. However, given that part of the point of the liquidity reforms was to
recognise that the market had underpriced liquidity in the past, it was judged to have been appropriate
to set the fee at 15 basis points.
Now that we have several years of experience with the CLF, we can look back and see how the banks have
responded to the existing framework. Since the CLF was introduced, the banks, in total, have
consistently overestimated their ‘net cash outflow’ projections in their CLF applications
for the following year.[7] These projections were used by APRA to determine the size of the CLF. As a result, the
banks have been granted a larger CLF than would have been the case had the net cash outflow projections
been more accurate ex ante (Graph 8). In recent years, the banks have also been
holding fewer HQLA securities than the RBA judged that they could reasonably hold. Taken together, these
observations suggest that the CLF fee should be set at a higher rate in the future.
Graph 8
A higher CLF fee will help to make the banks indifferent between holding more HQLA securities and asking
for a larger CLF. However, if the fee is too high, this could trigger a disruptive shift away from using
the CLF facility and create distortions in the markets that use HQLA. Accordingly, we have concluded
that the fee should be increased moderately and occur in two steps. The fee will rise from 15 to
17 basis points in January 2020 and to 20 basis points in January 2021.
When taken together, these two changes to the settings for the CLF will result in a small increase in
the cost of the CLF for the banks. To show this, we can fully apply the new settings to the current CLF
amounts, assuming everything else is held constant. If the banks were holding the higher level of AGS
and semis that the RBA has assessed would be reasonable, this would reduce the size of the CLF from just
below $250 billion to around $200 billion. If we then apply the 5 basis points total increase
in the CLF fee, collectively the banks would pay around $30 million more than they do currently for the
liquidity commitment they receive from the RBA.[8]
Conclusion
In conclusion, the CLF is important for Australia’s implementation of the Basel III liquidity
reforms. The facility has been working well, but after five years it is time to make some modest and
gradual adjustments to the settings, in a way that reduces the need of the banks to make use of the CLF
while also increasing their cost of doing so a little. In combination, these changes will help to ensure
that the banks continue to have strong incentives to manage their liquidity risk appropriately.
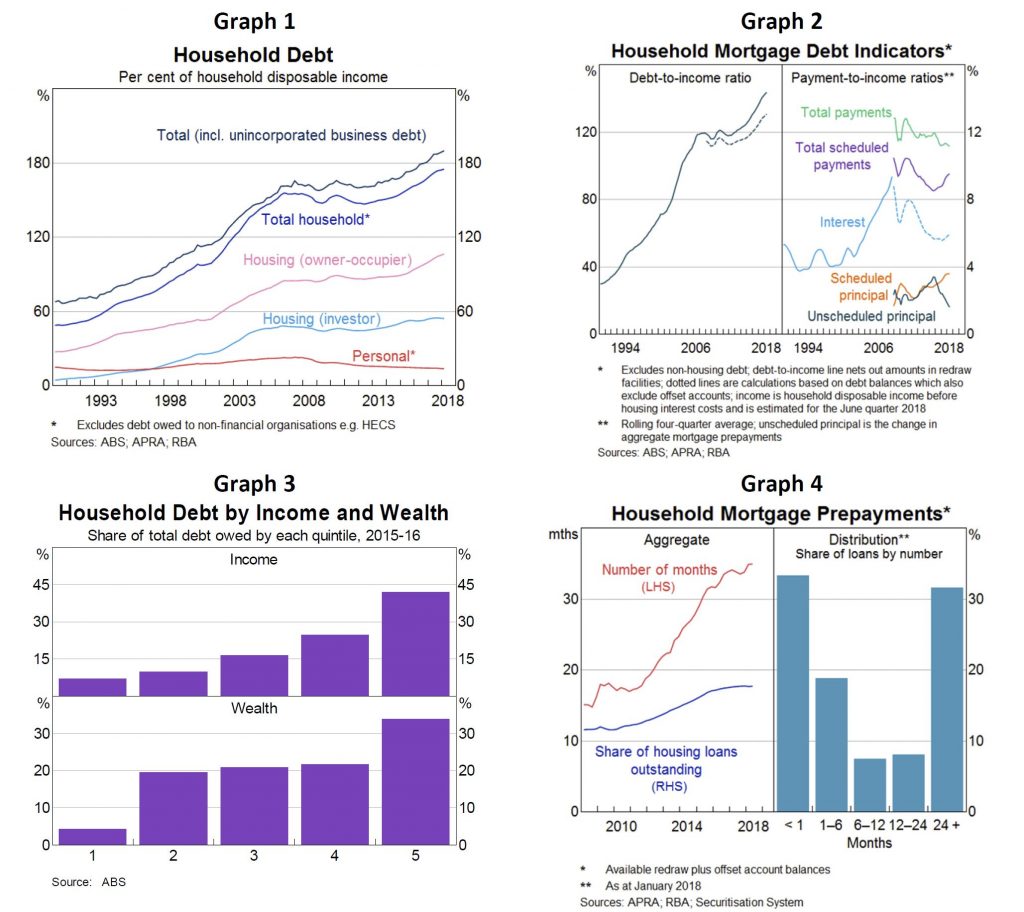
Household debt-to-income has drifted up, to 190 per cent (Graph 1 – broad measure, includes debt of unincorporated enterprises, new migrants’ offshore debt, HECS and to non-financials).
More frequently we cite housing debt-to-income which has increased to over 140 per cent (up 23 percentage points over five years) (Graph 2); net of offset accounts this is around 130 per cent (up 16 percentage points over five years).
High income and wealthy households hold a large proportion of household debt (Graph 3). In 2015-16 the top income quintile accounted for about 40 per cent of total debt and the top wealth quintile owed one-third of total debt; this share has been stable over time.
Debt servicing ratios have been broadly steady: falling rates offset rising debt.
Aggregate mortgage prepayments (offsets and redraws) are equivalent to 18 per cent of outstanding mortgages and nearly 3 years of scheduled repayments at current interest rates (Graph 4). One-third have no buffer: many are investors, on fixed-rate or new borrowers. Largest buffers typically: wealthier, higher income and more seasoned mortgages.
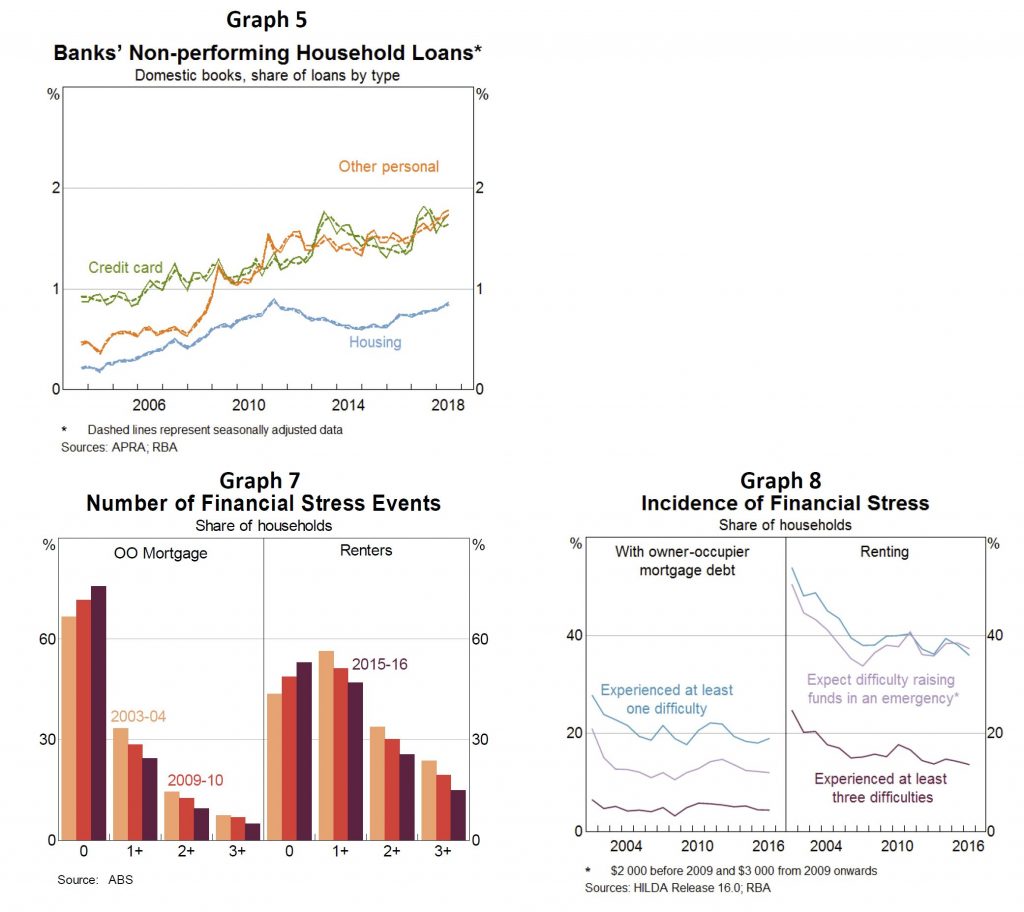
The housing non-performing loan (NPL) ratio has increased since the end of 2015 (mostly WA), but remains below the most recent peak in 2011 (Graphs 5 and 6).
NPL ratios for personal loans and credit cards remain high relative to recent history (personal credit is only about 4 per cent of banks’ household lending).
Broad data sources suggest the number of households experiencing financial stress has fallen over the past decade, but there are regional variations. Household Expenditure Survey (2015/16): the number of households experiencing financial stress has fallen steadily since the mid-2000s (Graph 7). HILDA (2016): measures of financial stress are little changed over the decade and are lower than the early 2000s (Graph 8).
ASIC’s recent report on credit cards links problematic debt with multiple credit card usage, corroborating messages from liaison (but overall more households are paying off each month).
Some private surveys point to rising mortgage stress. These surveys are timely but their methodologies often seem to overstate financial stress (e.g. using actual, rather than required mortgage payments, which include prepayments).
Concerns about stress when IO loan converts to a principal-and-interest (P&I) loan. Required repayments are estimated to increase by 30-40 per cent (about $7,000 per year) for a ‘representative interest-only borrower with a $400,000 mortgage converting to P&I.
Based on loans in the Securitisation Dataset, a large share of borrowers should qualify for an IO extension or could refinance with a different lender.
Borrowers that can’t meet new lending standards and are unable to service P&I repayments might sell their properties or default. We estimate this is a small group (eg borrowers with multiple highly leveraged investment properties).
Tighter lending standards are unlikely to bind for borrowers that: undertook a serviceability assessment at loan origination that already took into account the step up in repayments at the end of the interest-only periods (as APRA has required for all such assessments since end 2014); Did not borrow (close to) the maximum loan size available to them; Have experienced income growth since the loan was originated; Have made prepayments on their loans; and/or Were assessed for their original loans at significantly higher interest rates than current assessment rates.
Most borrowers will have positive equity given the rate of housing price growth over the last five years.
The minutes out today spelled out the slowing momentum in the economy, and the cuts in rates would help with spare capacity, but would not lift risks emanating from higher debt in the medium term. Cannot see how both can be true, when the focus appears to be on rekindling the housing market! And given the calls from the RBA for the Government to spend more to assist in stronger growth. The sums just do not add up!
International Economic Conditions
Members commenced their discussion by noting that growth in the global economy had remained moderate
over preceding months. Global trade and manufacturing activity had slowed over the preceding year. Trade
tensions had remained elevated, although no new measures had been introduced since the previous
meeting.
In China, recent indicators of economic activity suggested that growth had slowed since the March
quarter. Growth in industrial production had fallen following a strong reading in March and the level of
fixed asset investment had declined. Conditions in the Chinese property market had also softened and
underlying demand conditions were expected to moderate over time, given the ageing of the population and
a slowing in the rate of urbanisation. Over the preceding month, the Chinese authorities had introduced
additional measures to support growth, including more favourable financing conditions for local
governments investing in infrastructure projects.
In east Asia, the combination of weaker Chinese growth, the downturn in global semiconductor demand and
the trade and technology disputes had weighed on trade, although new export orders suggested that
conditions might be stabilising. The effect of the US–China trade dispute had not been even
across the region. Some economies, such as Thailand and Vietnam, had seen strong growth in their exports
to the United States, which reflected some diversion of trade that had previously been between the
United States and China.
Growth in output in the United States had continued to be supported by strong growth in consumption,
while growth in investment appeared to have slowed further. Members noted that capital goods orders had
slowed and that the stimulus to investment from tax cuts had largely run its course. Growth in domestic
demand in the euro area had been relatively resilient in the March quarter, but more recent data had
been mixed. Growth in Japanese domestic demand had slowed in early 2019, partly as a result of
spillovers from weak external demand conditions, but growth was likely to be supported in the near term
by a pick-up in consumption growth in the lead-up to an increase in the consumption tax in October
2019.
Labour markets remained tight in the major advanced economies. Members noted that participation rates
for people aged between 15 and 64 years had increased significantly in recent years and unemployment
rates were at historically low levels. This suggested that there was relatively little spare capacity in
these labour markets. Members noted that participation rates of people aged 65 years and over had also
been increasing. Wages growth had picked up, but this had not yet been translated into stronger
inflationary pressures and inflation remained below target in most advanced economies. Although
inflation had been around target in the United States, some measures suggested US inflation had shifted
lower more recently. The decline in oil prices, by around 15 per cent since their peak in mid
May, would weigh on headline inflation globally in the near term.
Iron ore prices had increased by more than 25 per cent since the previous meeting and had
more than doubled over the previous year. Chinese steel production had continued to grow strongly in
recent months, despite slowing industrial activity in China. At the same time, there was limited spare
capacity in the seaborne market to increase supply and inventories of iron ore at Chinese ports had been
declining. Rising iron ore prices had underpinned a 3 per cent increase in the Australian
terms of trade in the March quarter.
Domestic Economic Conditions
Members noted that the main domestic economic news over the previous month had been the release of the
national accounts for the March quarter and updates on the labour and housing markets.
The national accounts reported that the domestic economy had grown by 0.4 per cent in the March quarter. Public demand had continued to support growth in the quarter, with public consumption boosted by the rollout of the National Disability Insurance Scheme and increased spending on the Pharmaceutical Benefits Scheme. Growth in public sector investment had been positive despite a decline in defence spending. Members noted that there was a strong pipeline of public infrastructure projects that could support activity for some time.
Private demand had contracted for the third consecutive quarter because there had been further falls in mining investment and housing construction. Consumption growth had remained subdued.
Growth in business investment had been weaker than expected in the March quarter. This was partly because it had taken longer than expected for liquefied natural gas (LNG) projects to reach final completion. However, investment in automation and other productive efficiencies had supported machinery & equipment investment in the mining sector. Non-mining business investment had continued to expand in the March quarter, supported by a further increase in non-residential construction, while non-mining machinery & equipment investment had fallen. Members observed that there had been some differences in the findings of surveys of business conditions. In the main, surveyed measures of business conditions had declined to around or a little above average levels. However, both the retail and transportation sectors had experienced well below-average conditions.
Exports had increased in the March quarter, primarily driven by growth in rural and service exports. The boost to meat exports in the quarter as a result of ongoing drought conditions leading to destocking had been larger than the subtraction from lower crop exports. Resource exports (excluding non-monetary gold) had fallen in the March quarter because of temporary supply disruptions. More recent data on trade and shipments suggested that iron ore and LNG exports had increased since the March quarter, while coal exports appeared to have fallen. Higher iron ore prices had supported overall export values and the trade surplus had increased to almost 3 per cent of GDP in the March quarter. The trade surplus was at its highest level, and the current account deficit at its lowest level, measured as a share of GDP, since the 1970s.
Consumption had grown by 1.8 per cent over the year to the March quarter, which was well below average. Members noted that, in per capita terms, consumption had been broadly flat. Growth in household spending on essential items had been relatively steady, while the level of spending on discretionary items had fallen in the March quarter. This weakness had been broadly based across the states and recent retail trade data suggested that discretionary spending had remained soft in the June quarter.
Members had a detailed discussion of the effects on price inflation in the retail trade sector of
increased competition from foreign entrants and online retailers over the preceding decade or so.
Members noted that the increase in the supply of retail items and lower retail prices in response to
increased competition were positive developments for consumers, other things equal. Many retailers and
wholesalers had also become more efficient in response to more intense competition, often using new
technology (including in logistics), which had resulted in relatively rapid multifactor productivity
growth in these sectors. Members noted that the adjustment in the retail sector had been protracted and
had put downward pressure on inflation for some years. In the more recent period, the effects on prices
of greater competition had been difficult to separate from the effects of the prevailing weak demand
conditions.
Growth in household disposable income had increased in recent quarters, supported by growth in labour income, but had remained low in year-ended terms. Members noted that growth in labour income had been driven by strong employment growth and that growth in hourly earnings had remained subdued. New private sector enterprise bargaining agreements had incorporated slightly faster wages growth than agreements reached a year earlier. However, wages growth for workers on existing enterprise bargaining agreements had remained subdued, and there was little prospect of a near-term pick-up in public sector outcomes given the ongoing wage caps.
A small decline in growth in tax payments had also contributed to growth in household disposable income in the March quarter. By contrast, the income of unincorporated enterprises had remained weak, partly because of drought-related falls in farm incomes and the downturn in housing construction. Members noted that this weakness was likely to continue in the near term.
Dwelling investment had declined in the March quarter. Further falls were expected given the sharp decline in building approvals over the preceding year and a half. While the pipeline of construction work yet to be done in New South Wales and Victoria remained high, liaison contacts expected housing construction could drop off more sharply because pre-sales activity had been so weak.
Conditions in the established housing markets of Sydney and Melbourne had improved a little since the previous meeting. Housing prices had stabilised in June in these cities and auction clearance rates had picked up further, albeit still on low volumes. More generally, turnover in the housing market had remained low. Housing prices had continued to fall in Perth and Darwin.
Employment growth had remained strong, at 2.9 per cent over the year to May. Despite this, there was still spare capacity in the labour market. Some of the additional labour demand had been met by an increase in the participation rate, which had reached its highest level on record. Even so, forward-looking indicators, such as job advertisements and employment intentions, suggested that growth in employment would moderate over coming months. The unemployment rate had remained at 5.2 per cent in May and the underemployment rate had remained elevated.
In view of the fact the meeting was held in Darwin, members had a thorough discussion of economic
conditions and future economic opportunities in the Northern Territory. They noted that the Northern
Territory economy had experienced a significant cycle related to the construction and then completion of
the INPEX LNG plant. The downturn in the mining cycle had had significant spillovers to other parts of
the Northern Territory economy because, aside from the public sector, mining and construction are the
largest industries in terms of gross value added. Employment had fallen in the Northern Territory over
2019 and this had been accompanied by large flows of people moving to other parts of the country. As a
result, the unemployment rate for the Northern Territory had increased, but it remained lower than the
national average. More generally, the Northern Territory had a relatively young population and high
labour market participation rates. The decline in the Northern Territory population had also led to a
significant decline in dwelling investment in the Northern Territory over recent years.
Members observed that the broad statistics on the labour market for the Northern Territory masked the
relative disadvantage of the Indigenous population. The unemployment rate for Indigenous Australians on
average was relatively high, and Indigenous Australians were less likely to complete school and more
likely to experience poor health. These measures of Indigenous disadvantage were particularly acute in
remote locations, where it is more difficult to deliver services.
Members noted that there were a number of opportunities for economic growth in the Northern Territory
in the future, including tourism, agricultural exports (including live beef exports), the defence
industry and mining. Higher mining investment in the Northern Territory in the future could come from
some small-scale mining projects that had not yet reached final investment decision and the possibility
of some onshore unconventional gas projects.
Financial Markets
Members commenced their discussion of financial markets by noting the significant change in the
expected path of monetary policy around the world, particularly in the United States. This change had
reflected a combination of weaker-than-expected economic activity and inflation over recent months, as
well as the downside risks from the trade and technology disputes between the United States and
China.
Monetary policy in the United States had been unchanged in June, but the Federal Reserve had indicated that it was prepared to act to sustain the economic expansion. Members of the Federal Open Market Committee (FOMC) saw a stronger case to reduce the federal funds rate during 2019, in contrast with the earlier ‘patient’ stance as the FOMC had awaited further data. Market pricing had moved to imply an expectation that the federal funds rate would decline by 100 basis points over the following year, compared with 50 basis points a month earlier.
In other major economies, the European Central Bank had indicated that it was prepared to add more
monetary stimulus if the outlook for growth and inflation did not improve, including by expanding its
bond-buying program. The Bank of Japan had intimated that it would allow bond yields to move below the
lower end of its ‘yield curve control’ target and reiterated that there was scope to ease
monetary policy further if needed. And in China, market participants expected the People’s Bank
of China to ease monetary policy further in the period ahead.
As expectations for monetary policy easing had firmed over the course of this year, government bond yields had declined further in major markets, to a record low in Germany and further into negative territory in Japan. In the United States, lower bond yields reflected lower expected real policy rates for an extended period, as well as persistently low inflation and term premia. Yields on 10-year Australian government bonds had reached a historical low of 1.3 per cent, with yields remaining around 70 basis points below US treasury bond yields of similar maturity. Compensation for risk on corporate bonds globally remained compressed, as market participants judged that policy easing would support growth in economic activity and profits. Members noted that, as a result, the cost of funds for corporations remained low, including in Australia.
Equity prices had increased in
major markets over the preceding month, to a record high level in the United States, despite prominent
downside risks. Higher equity prices owed primarily to a lowering of discount rates, reflecting the
expected easing of monetary policies, whereas the outlook for corporate earnings had been little
changed. Recent movements in equity prices in Australia had broadly followed international trends, with
increases in equity prices in all main sectors over the preceding month. Members noted that
analysts’ forecasts of earnings of Australian non-resource companies had declined over the course
of the past year, consistent with broader surveys of business conditions.
Members noted that
bank liquidity conditions in China had remained accommodative overall. However, the solvency and
liquidity of small banks (which account for one-quarter of banking assets) had been attracting more
scrutiny from both investors and the authorities after a period of rapid asset growth, amid wider
financial stability concerns.
In foreign exchange markets, the US dollar had remained
around multi-year highs on a trade-weighted basis, although it had depreciated somewhat in the weeks
leading up to the meeting as US bond yields had declined relative to those in other major economies. The
euro had remained within the relatively narrow range of the preceding few years on a trade-weighted
basis, while the yen had broadly appreciated over recent months. The Australian dollar had been largely
unchanged following the decision to lower the cash rate in June. Nevertheless, having depreciated by
about 3 per cent in TWI terms since late 2018, the Australian dollar was around its lows of
recent years, with the effect of the decline in Australian bond yields relative to other major markets
over that period partly offset by the unexpected strength in commodity prices.
In Australia, monthly housing credit growth had remained broadly stable in recent months, particularly for lending for owner-occupation. Aggregate housing credit had been growing at an annualised rate of around 3 per cent, with much of the decline in the rate of growth over the preceding year driven by weaker demand for finance associated with the correction in the housing market. Loan approvals by both owner-occupiers and investors had continued to decline in May. However, an easing in the loan serviceability interest-rate floor was likely to see a boost in borrowing capacity for many new borrowers, which would be in addition to the positive effect on the cash flow of the household sector overall following the reduction in the cash rate at the previous meeting.
The three-month bank bill swap rate (BBSW) had declined further over the preceding month. Accordingly, the increase in the spreads of BBSW and other short-term money market rates to the overnight indexed swap rate in 2018 had been fully unwound. Wholesale funding costs (which affect two-thirds of banks’ debt funding) had also declined in line with the cash rate. As a result, the major banks’ debt funding costs had reached a historic low.
Members noted that the favourable financing conditions for non-financial
corporations had supported corporate bond issuance. Although business credit growth had declined over
recent months, growth in total business debt had remained little changed. Meanwhile, yields on
residential mortgage-backed securities had also been at low levels and issuance by non-banks in this
market had increased significantly in the June quarter, to levels not seen since prior to the global
financial crisis.
Members noted that most lenders had passed on the 25 basis points
reduction in the cash rate in June to mortgage rates. Business borrowing rates had declined in line with
the decline in BBSW. Members also noted that the reduction in the cash rate had been passed through to
many retail deposit rates, although some of these rates were already very low.
Market pricing
implied that further monetary policy easing was expected following recent data and the Bank’s
communication since the previous meeting. A 25 basis points reduction in the cash rate had been
fully priced in by August 2019, with a further easing expected by the end of the year.
Considerations for Monetary Policy
Members observed that the outlook for the global economy remained reasonable, although the risks from
the international trade and technology disputes remained high. Growth in trade had remained weak and
there had been further signs that heightened uncertainty was affecting investment decisions. Despite
tight labour markets and rising wages growth, inflation had generally remained low in the advanced
economies. Both the trade-related downside risks to global growth and ongoing subdued inflation had
spurred an increased expectation that major central banks would ease monetary policy. This had
reinforced already very accommodative conditions in global financial markets.
In considering the policy decision, members discussed the recent data on output and the labour market.
On the former, GDP growth had been well below trend over the year to the March quarter. Despite strong
growth in employment, growth in household disposable income had remained low and this had contributed to
low growth in consumption. Members noted the near-term prospects for a lift in income growth and the
contribution of the low and middle income tax offset. Higher growth in disposable income was expected to
support consumption, although the outlook for consumption remained uncertain. Accommodative monetary
policy, strong public demand, a renewed expansion in the resources sector and growth in exports were
also expected to support a return of GDP growth to trend over coming years.
Members observed that employment growth continued to outpace growth in the working-age population.
However, most of the strength in labour demand over preceding months had been met by an increase in
participation, which had risen to a record high level, rather than a decline in the unemployment rate.
Although there had been a modest pick-up in wages growth in the private sector, wages growth had
remained low overall. In combination, these factors suggested that spare capacity was likely to remain
in the labour market for some time.
Declining housing prices had also contributed to low growth in consumption, although there were signs
that conditions in some housing markets, notably in Sydney and Melbourne, had stabilised. Members noted
that mortgage rates were at record lows and that there was strong competition for borrowers of high
credit quality. However, demand for credit by investors continued to be subdued and credit conditions
for small and medium-sized businesses remained tight.
In assessing the outlook for inflation, members agreed that further improvements in the labour market
would be required for wages growth to increase materially. As assessed at the previous meeting, members
agreed that the Australian economy could sustain a lower rate of unemployment, while achieving inflation
consistent with the target. In light of this, the recent run of data and the lower level of interest
rates resulting from the decision taken at the previous meeting, the case for a further reduction in the
cash rate was considered.
Members recognised that, in the current environment, the main channels through which lower interest
rates would support the economy were a lower value of the exchange rate than otherwise would be the case
and lower required interest payments on borrowing, which would free up cash for other expenditure by
households and businesses.
Members judged that a further reduction in the level of interest rates would support the necessary growth in employment and incomes, and promote stronger overall economic conditions, which would in turn support a gradual increase in underlying inflation. Members also judged that the extent of spare capacity in the economy, and the likely pace at which it would be absorbed, meant that a decline in interest rates was unlikely to encourage an unwelcome material pick-up in borrowing by households that would add to medium-term risks in the economy. Members recognised the uneven effect of lower interest rates on different households.
Taking into account all the available information, the Board decided that it was appropriate to lower
the cash rate by 25 basis points. This decision, together with the reduction in the cash rate
decided at the previous meeting, would assist in reducing spare capacity in the economy and making
faster progress in reducing the unemployment rate. Lower interest rates would provide more Australians
with jobs and assist with achieving more assured progress towards the inflation target. The Board would
continue to monitor developments in the labour market closely and adjust monetary policy if needed to
support sustainable growth in the economy and the achievement of the inflation target over time.
“the point of the estimates is that the various caps on the scheme (10,000 loan cap, income and house prices) are likely to be the binding constraint on the amount of loans provided rather than the scheme’s equity funding”.
To provide some context:
Based on ABS numbers, in the year to February there were 110,000 loans to first home buyers. The average loan size in February to FHB was $337,412. Usual caveats apply to these data.
Using the average loan size to FHB and assuming the scheme covers 15 per cent, the government will guarantee around $50,000 per loan. If the scheme has $500 million in funding, this implies
– 9,879 loans if the scheme holds reserves covering 100 per cent of its commitments. – 49,395 loans with 20 per cent reserves. – 98,790 loans with 10 per cent reserves. – 197,583 loans with 5 per cent reserves.
Average loan size data are biased downwards, so can use average house prices instead as arguably an upper bound. In the December quarter ABS average house prices were $650,000. 15 per cent of this is $97,500.
– 5,128 loans if the scheme holds reserves covering 100 per cent of its commitments. – 25,641 loans with 20 per cent reserves. – 51,282 loans with 10 per cent reserves. – 102,564 loans with 5 per cent reserves.
Well, surprise, surprise, the RBA has realised that high mortgage debt reduces household consumption, according to new research they published. Yet they also note the positive economic impact of higher debt, and say the the overall impact is “unclear”! Well, the DFA surveys make it quite clear, many households are “full” of debt” and cannot spend.
New research from the Reserve Bank has highlighted the link between mortgage debt and household spending amid debate over home loan serviceability assessment guidelines.
The Reserve Bank of Australia (RBA) has published new research from its economic research department, which
has identified evidence of a link between “high levels of
owner-occupier mortgage debt” and a fall in household spending, referred
to as the “overhang effect”.
According to The Effect of Mortgage Debt on Consumer Spending report, if
mortgage levels remained at “2006 levels”, annual aggregate consumption
would have been approximately 0.2 to 0.4 per cent higher.
The RBA added that the negative effect of debt on spending is “pervasive” across households with owner occupied home loans.
“Our
results also suggest that an increase in aggregate owner-occupier
mortgage debt can have important implications for aggregate spending,
all else constant, and go at least part of the way to resolving the
post-crisis ‘puzzle’ of unusually weak household spending in Australia,”
the RBA report stated.
The central bank’s research comes amid
continue debate over home loan serviceability assessment standards, with
the Australian Prudential Regulation Authority (APRA) and the
Australian Securities and Investments Commission (ASIC) moving to reform
current practices.
ASIC’s proposed update of its responsible
lending guidance (RG209) has been met with a renewed call from
stakeholders for a revision to the way a borrower’s spending habits are
assessed.
The RBA’s research has supported claims from some stakeholders, including Westpac,
who have noted that changes in a borrower’s spending behaviour after
they assume mortgage debt should be reflected in regulatory guidance.
In
its submission to ASIC during the regulator’s first round of
consultation, Westpac called for greater flexibility in the assessment
of a borrower’s living expenses.
“Adopting a modest lifestyle for a
period of time in order to acquire real property has been the means by
which many Australians have secured long-term financial security,”
Westpac stated.
“Experience shows that many customers are prepared
to, and do actually, make lifestyle adjustments after acquiring a home
and can then service their home loan obligations without substantial
hardship.
“As such, Westpac submits that placing too much emphasis
on the customer’s pre-application living expenses when determining
suitability, without allowing scope for reasonable lifestyles
adjustments (‘belt-tightening’), would have the effect of denying credit
to many customers.”
Impact on economy still ‘unclear’
Despite
confirming the direct impact of higher mortgage debt on household
spending, the RBA has maintained that the impact of the “debt overhang’
on the overall economy remains “unclear’, noting the positive
stimulatory contribution of the credit boom. stating that
“[These] estimates abstract from other stimulatory effects of debt,” the report noted.
“The increase in mortgage debt has likely lifted house prices and by this also supported consumption over this period.
“Our
estimates are thus best interpreted as the loss in consumption had all
other trends, such as the growth in house prices, occurred even though
debt remained constant.”
The RBA concluded: “As a result, the net effect of the increase in debt since the mid-2000s is unclear.”
The Council just updated their charter, and published their latest minutes. At least there is some minimal disclosure now, though high-level. Note the fact that Treasury is one of the members, alongside the RBA, ASIC and APRA.
The Council of Financial Regulators (the Council) is the coordinating body for Australia’s main financial regulatory agencies. There are four members: the Australian Prudential Regulation Authority (APRA), the Australian Securities and Investments Commission (ASIC), the Australian Treasury and the Reserve Bank of Australia (RBA). The Reserve Bank Governor chairs the Council and the RBA provides secretariat support. It is a non-statutory body, without regulatory or policy decision-making powers. Those powers reside with its members. The Council’s objectives are to promote stability of the Australian financial system and support effective and efficient regulation by Australia’s financial regulatory agencies. In doing so, the Council recognises the benefits of a competitive, efficient and fair financial system. The Council operates as a forum for cooperation and coordination among member agencies. It meets each quarter, or more often if required.
The updates charter says:
The Council of Financial Regulators (CFR) comprises APRA, ASIC, the RBA and Treasury. It aims to facilitate cooperation and collaboration between member agencies, with the ultimate objectives of promoting stability of the Australian financial system and supporting effective and efficient regulation by Australia’s financial regulatory agencies. In doing so, the CFR recognises the benefits of a competitive, efficient and fair financial system.
The CFR provides a forum for:
identifying important issues and trends in the financial system, with a focus on those that may impinge upon overall financial stability;
exchanging information and views on financial regulation and assisting with coordination where members’ responsibilities overlap;
harmonising regulatory and reporting requirements, paying close attention to regulatory costs;
ensuring appropriate coordination among the agencies in planning for and responding to instances of financial instability; and
coordinating engagement with the work of international institutions, forums and regulators as it relates to financial system stability.
The CFR will draw on the expertise of other non-member government agencies where appropriate for its agenda, and will meet jointly with the ACCC, AUSTRAC and the ATO at least annually to discuss broader financial sector policy.
Their latest minutes:
At its meeting on 5 July 2019, the Council of Financial Regulators (the Council) discussed systemic risks facing the Australian financial system, regulatory issues and developments relevant to its members. The main topics discussed included the following:
Financing conditions and the housing market. The Council discussed credit conditions and ongoing adjustment in the housing market. Housing credit growth has stabilised at a relatively low level, with lending to investors remaining weak, particularly from the major banks. Demand for housing credit has been subdued, though there has also been some tightening in credit supply. Business credit growth has weakened recently, with lending to small businesses declining over the past year. Lenders are themselves applying stricter verification of expenses and income to small businesses, and lending may be affected by declining collateral values as housing prices decline.
Council members discussed the signs of stabilisation in the Sydney and Melbourne housing markets, evident in both housing prices and auction clearance rates. They observed that the adjustment over the past two years has been sizeable and conditions in most other capital cities continue to be soft. Risks to lenders from housing price falls have to date been limited by the strength of the labour market, low interest rates and the improvement in lending standards in recent years. Housing loan arrears have continued to edge higher, but with significant variation between regions.
Members were updated on ASIC’s public consultation on its responsible lending guidance. The responsible provision of credit is a cornerstone of consumer protection and is important to the Australian economy. It was noted that the consultation is not about increasing requirements; but rather, clarifying and updating guidance on existing requirements. For example, ASIC may further clarify areas where the law does not require responsible lending requirements to be applied (e.g. in small business lending). The Council agencies will continue to closely monitor developments in financing and the housing market.
ASIC’s product intervention powers. ASIC updated the Council on its proposed approach to the new product intervention power, legislation for which passed in April 2019. This gives ASIC the power to proactively intervene where a financial product has resulted or is likely to result in significant detriment to consumers. ASIC has launched a public consultation on its approach. Council members discussed possible applications of the new power given it is now available for use.
Product design and distribution obligations. The Council also discussed the implications of new product design and distribution obligations for retail holdings of bank-issued Additional Tier 1 (AT1) instruments. Members encouraged issuers to review their practices for issuing AT1 instruments ahead of the commencement of the new obligations in April 2021. They noted that APRA would continue to treat all AT1 instruments as regulatory capital, capable of absorbing losses in the unlikely event of a bank failure. Members discussed the importance that all holders of AT1 instruments, particularly retail investors, recognise that AT1 instruments could be written down or converted to equity.
Policy developments. Members discussed a number of policy developments, including the implementation of the recommendations of the Royal Commission into Misconduct in the Banking, Superannuation and Financial Services Industry. APRA provided an update on its policy work, including changes to its guidance on the minimum interest rate used in serviceability assessments for residential mortgage lending (announced on the morning of the meeting). APRA also updated the Council on its planned increases in the loss-absorbing capacity of ADIs to support orderly resolution. Members discussed proposals by New Zealand authorities to significantly increase Tier 1 capital ratios for banks in New Zealand.
Financial market infrastructure (FMI). The Council’s FMI Steering Committee provided an update on the design of a crisis management legislative framework for clearing and settlement facilities. This will ensure the necessary powers to resolve a distressed domestic clearing and settlement facility. A second consultation is now planned for late 2019. The Committee has also considered proposals for enhancements to the agencies’ supervisory powers and other changes to improve the regulatory framework in relation to market infrastructures. The results of the Council’s consultation findings will be provided to Government, to assist with policy design and the drafting of associated legislation (the draft of which would also be consulted on before being introduced to Parliament).
Stored-value payment facilities. The Council discussed elements of a potential regulatory framework for payment providers that hold stored value, following a public consultation in 2018. Discussion focused on suitable criteria to determine the regulatory regime that should apply to providers of stored-value facilities, along with the adequacy of consumer protection arrangements. Once completed, the conclusions of this work will be provided to the Government for consideration.
Competition in the financial system. Council agencies and the Australian Competition and Consumer Commission (ACCC) are developing an online tool to improve the transparency of the mortgage interest rates paid on new loans. This follows a recommendation of the Productivity Commission’s inquiry into Competition in the Australian Financial System. The tool relies on a new data collection and is expected to be available in 2020.
Climate change. Council members noted the work undertaken by regulators to address the implications of the changing climate, and society’s response to those changes, for the Australian financial system.
Updated Charter. The Council agreed to adopt an updated Charter, which is being published today. The Charter emphasises the Council’s financial stability objective, while also recognising the benefits of a competitive, efficient and fair financial system. It also highlights the Council’s focus on cooperation and collaboration to support the activities of its member agencies.
In conjunction with the Council meeting, the Council agencies held their annual meeting with other Commonwealth regulators of the financial sector. This included representatives from the ACCC, the Australian Taxation Office and the Australian Transaction Reports and Analysis Centre (AUSTRAC). Topics discussed included enforcement and data initiatives affecting the financial sector.

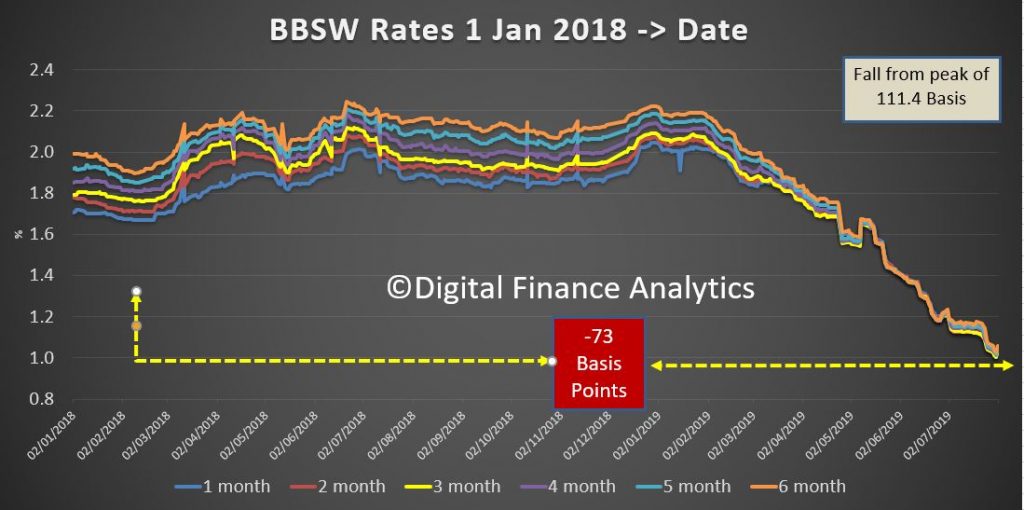
 Blog")