Another Nice Mess – The Property Imperative Weekly – 11 Nov 2017

In our latest weekly update, we explore how that RBA is caught between stronger global economic indicators, and weaker local conditions, and what this means for local households, the property market and banks.

Welcome to the Property Imperative weekly to 11th November 2017. Read the transcript or watch the video.

We start this weeks’ digest with the latest results from the banking sector.

CBA’s 1Q18 Trading Update reported a rise in profit, and volumes, as well as a lift in capital. Expenses were higher, reflecting some provisions relating to AUSTRAC, but loan impairments were lower. WA appears to be the most problematic state. Their unaudited statutory net profit was around $2.80bn in the quarter and their cash earnings was $2.65bn in the quarter, up 6%. Both operating income and expense was up 4%.

Westpac’s FY17 results were a bit lower than expected, impacted by lower fees and commissions, pressure on margins, the bank levy and a one-off drop to compensate certain customers.  Despite a strong migration to digital, driving 59 fewer branches and a net reduction of ~500 staff, expenses were higher than expected. There has been a 23% reduction in branch transactions over the past two years in the consumer bank, once again highlighting the “Quiet Revolution” underway and the resulting problem of stranded costs. Treasury had a weak second half. But the key point, to me, is that around 70% of the bank’s loan book was in one way or another linked to the property sector, so future performance will be determined by how the property market performs. Provisions were lower this cycle, and at lower levels than recent ANZ and NAB results. WA mortgage loans have the highest mortgage arrears but were down a bit.

Looking at mortgage defaults across the reporting season, there were some significant differences. Some, like Westpac, indicated that WA defaults in particular are easing off now, while others, like ANZ and Genworth, are still showing ongoing rises. This may reflect different reporting periods, or it may highlight differences in underwriting standards. Our modelling suggests that the rate of growth in stress in WA is indeed slowing, but it is rising in NSW (see the Nine TV News Segment on this which featured our research) and VIC; and there is an 18 to 24-month lag between mortgage stress and mortgage default. So, in the light of expected flat income growth, continued growth in mortgage lending currently at 3x income, rising costs of living and the risk of international funding rates rising too, we think it is too soon to declare defaults have peaked. One final point, many households have sufficient capital buffers to repay the bank, thanks to ongoing home price rises. Should prices start to fall, this would change the picture significantly.

Banks have enjoyed strong balance sheet growth in recent years as they lend ever more for mortgages, at the expense of productive business lending. A number of factors have driven the housing boom including population and income growth for the past 25 years, a huge fall in interest rates and increases in the tax advantages to property investment through negative gearing and the halving of the capital gains tax level.

Fitch Ratings says the banks’ had solid results for the 2017 financial year, supported by robust net interest margins and strong asset quality. However, Australia’s four major banks will face earnings pressure from higher impairment charges and lower revenue growth in their 2018 financial year, and cost control to remain an important focus. They benefitted from the APRA inspired repricing of mortgages, and from lower impairment charges. Fitch said that mortgage arrears have increased modestly from low bases in most markets – Western Australia has had more noticeable deterioration – and they expect this trend to continue in FY18 due in part to continued low wage growth and an increase in interest rates for some types of mortgages.

The latest household finance data from the ABS confirms what we already knew, lending momentum is on the slide, and first time buyers, after last month’s peak appear to have cooled. With investors already twitchy, and foreign investors on the slide, the level of buyer support looks anaemic. Expect lots of “special” refinance rates from lenders as they attempt to sustain the last gasp of life in the market.

The number of new loans to first time buyers was down 6.3%, or 630 on last month. We also see a fall in fixed loans, down 14%.  The DFA sourced investor first time buyers also fell again, down 4%. More broadly, the flow of new loans was down $19 million or 0.06% to $33.1 billion. Within that, investment lending flows, in trend terms, fell 0.52% or $62.8 million to $12.1 billion, while owner occupied loans rose 0.32% or $47.7 million to $15.0 billion.  So investment flows were still at 44.6% of all flows, excluding refinances. Refinances comprise 17.9% of all flows, down 0.07% or $3.9 million, to $5.9 billion.

Auction volumes were also lower this past week, partly because of the Melbourne Cup festivities, and CoreLogic’s latest data suggests a slowing trend, more homes listed, and further home price falls in Greater Sydney. As a result, we expect home lending to trend lower ahead.

The MFAA says there has been a boom in mortgage brokers, but this may be unsustainable, given lower mortgage growth.  The snapshot, up to March 2017, shows that the number of brokers was estimated to be 16,009, representing 1 broker for every 1,500 in the population and they originated around 53% of new loans.  Overall the number of brokers rose 3.3% but net lending grew only 0.1%. As a result, the average broker saw a fall in their gross annual income. Also, on these numbers, brokers cost the industry more than $2 billion each year!

We published data on the dynamic loan-to-income data (LTI) from our household surveys. Currently we estimate that more than 20% of owner occupied mortgage loans on book have a dynamic LTI of more than 4 times income. Some LTI’s are above 10 times income, and though it’s a relatively small number, they are at significantly higher risk. Looking at the data by state, we see that by far the highest count of high LTI loans resides in NSW (mainly in Greater Sydney), then VIC and WA. Younger households have a relatively larger distribution of higher LTI loans. Reading across our core segmentation, we see that Young Affluent, Exclusive Professional and Multi-Cultural Establishment are the three groups more likely to have a high dynamic LTI. We also see a number of Young Growing Families in the upper bands too. As many lenders also hold the transaction account for their mortgage borrowers, it is perfectly feasible to build an algorithm which calculates estimated income dynamically from their transaction history, and use this to estimate a dynamic LTI. This would give greater insight into the real portfolio risks, compared with the blunt instrument of LVR. It is less misleading that LTI or LVR at origination.

The latest edition of our Household Financial Security Confidence Index to end October shows households are feeling less secure about their finances than in September. The overall index fell from 97.5 to 96.9, and remains below the 100 neutral setting. We use data from our household surveys to calculate the index.  While households holding property for owner occupation remain, on average, above the neutral setting, property investors continue to slip further into negative territory, as higher mortgage rates bite, rental returns slide and capital growth in some of the major markets stalls.  Property inactive households remain the most insecure however, so owning property in still a net positive in terms of financial security. There are significant variations across the states. VIC households continue to lead the way in terms of financial confidence, and WA households are moving up from a low base score. However, households in NSW see their confidence eroded as prices slide in some post codes (the average small fall as reported does not represent the true variation on the ground – some western Sydney suburbs have fallen 5-10% in the past few months). Households in QLD and SA on average have held their position this month. Confidence continues to vary by age bands, although the average scores have drifted lower again. Younger households are consistently less confident, compared with older households, who tend to have smaller mortgages relative to income, and more equity in property and greater access to savings.

As expected the RBA held the cash rate again this week, for the 15th month in a row.  The RBA’s statement on Monetary Policy highlighted the tension between stronger global growth, reflected in expected rising interest rate benchmarks in several countries, including the USA; and weaker inflation and growth in Australia. As a result, pressure to lift the cash rate here appears lower than before. Underlying inflation is expected to remain steady at around 1¾ per cent until early 2019, before increasing to 2 per cent. The revised CPI weightings now announced by the ABS, will tend to reduce the inflation numbers in the next release. The RBA suggests growth will be lower for longer though is still holding to a 3% growth rate over their forecast period, They also highlighted the impact of stagnant wage growth and high household debt once again.

If rates do stay lower for longer here, it may benefit households already suffering under mountains of mainly housing related debt, but put pressure on the dollar and terms of trade, as rates overseas climb, sucking investment dollars away from Australia and lifting funding costs. Some are suggesting that the gap between income and credit growth, 2% compared with 6% over the past year, will require the RBA to lift the cash rate sooner, and ANZ for example is still forecasting rate hikes in 2018.

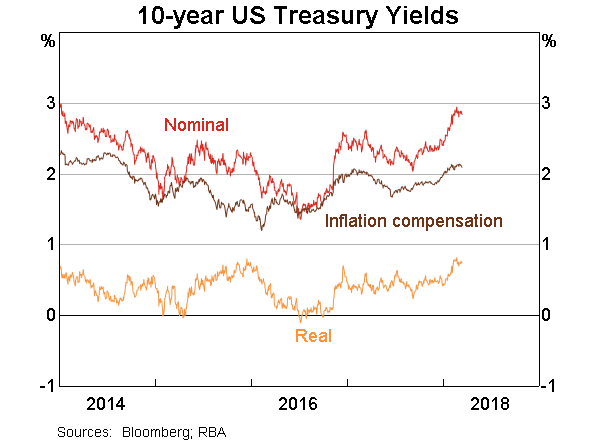
International conditions are on the improve, and many assume the rises in benchmark cash rates will be slow and steady. However, A GUEST post on the unofficial Bank of England’s “Bank Underground” blog makes the point, by looking at data over the past 700 years, that most reversals after periods of interest rate declines are rapid. When rate cycles turn, real rates can relatively swiftly accelerate. The current cycle of rate decline is one of the longest in history, but if the analysis is right, the rate of correction to more normal levels may be quicker than people are expecting – and a slow rate of increases designed to allow the economy to acclimatize may not be possible.  Not pretty if you are a sovereign or household sitting on a pile of currently cheap debt!

So, we see on one side global conditions improving, with interest rates set to rise, while locally economic indicators are weakening suggesting the RBA may hold the cash rate lower for longer. This is creating significant tension, and highlights the dilemma the regulators face. But as we said before, this is a problem of their own making, as they dropped rates too far, and did not recognise the growing risks in the housing sector soon enough. So, already on the back foot, we expect to see some further targeted regulatory intervention, and we expect the cash rate to stay lower for longer, until the international upward pressure swamps the local situation. We think this may be much sooner than many, who are now talking of no rate change for a couple of years.  Meantime households with large loans, little income growth and facing rising costs will continue to spend less, tap into savings, and muddle though. Not a good recipe for future growth, and economic success. As Laurel and Hardy used to say ” Well, here’s another nice mess you’ve gotten me into!”

And that’s the Property Imperative Weekly to 11th November 2017. If you found that useful, do leave a comment, subscribe to receive future updates, and check back next week.

RBA Statement On Monetary Policy Released

The RBA’s latest Statement on Monetary Policy, released today, highlights the tension between stronger global growth, reflected in expected rising interest rate benchmarks in several countries, including the USA; and weaker inflation and growth in Australia. As a result, pressure to lift the cash rate here appears lower than before. Underlying inflation is expected to remain steady at around 1¾ per cent until early 2019, before increasing to 2 per cent.

GDP growth should strengthen over the rest of the forecast period as the drag from mining investment comes to an end and public demand and non-mining business investment continue to support growth.

So, they are holding to the above 2% inflation rate, and 3% growth rate over their forecast period.

However, if rates do stay lower for longer here, it may benefit households already suffering under mountains of mainly housing related debt, but put pressure on the dollar and terms of trade, as rates overseas climb sucking investment dollars away from Australia and lifting funding costs.

Here is their summary:

The Australian economy is expected to expand at a solid pace over the next couple of years, and labour market developments have been quite positive of late. The drag on growth from the end of the mining investment boom has eased and is likely to end sometime in the next year or so. Investment in the non-mining sector has been increasing but growth in consumption has been below average. Inflation and wage growth remain low. Both are expected to increase only gradually over time.

A number of factors are serving to hold inflation down. Wage growth has remained low and strong competition in the retail sector is dampening retail inflation across a broad range of goods. Although the unemployment rate has declined and is expected to fall further, some spare capacity is likely to remain in the labour market in the period ahead. It is also likely that structural factors and the adjustment following the terms of trade boom have been working to contain wage growth. Stronger labour market conditions are nonetheless expected to lead to a pick-up in wage growth over time. Important uncertainties influencing the outlook for inflation include the questions of how much wage growth might pick up as the labour market tightens, and how quickly the resulting increase in labour costs might feed into inflation.

Both headline and trimmed mean inflation were a little below 2 per cent over the year. Short-run fluctuations in the prices of volatile items such as fruit and vegetables added to the ongoing dampening effects of strong retail competition on the prices of tradeable goods and services.

Slow growth in labour costs and rents also contributed to inflation remaining low. Working in the opposite direction, cost pressures are feeding through into the prices of newly built homes. Tobacco and electricity prices have also boosted headline inflation and are expected to continue to do so. Headline inflation could also be a bit higher in the December quarter because petrol prices have risen noticeably in recent weeks.

Further out, the various measures of inflation are expected to reach 2–2¼ per cent by the end of the forecast period. The forecasts reflect an expectation that wage growth will gradually pick up. They also incorporate the effect of the slight appreciation of the Australian dollar since midyear. If the exchange rate were to appreciate further, economic activity and inflation would be likely to pick up more slowly than currently forecast. The Bank’s assessment of how inflationary pressures are likely to evolve is not affected by the forthcoming update to the weights used to calculate the consumer price index, although the forecasts have been lowered a little to account for this methodological change.

The outlook for the Australian economy is little changed from three months ago. Quarterly GDP growth is expected to have eased slightly in the September quarter. Beyond that, growth is forecast to average about 3 per cent over the next couple of years. Growth in resource exports will more than offset the diminishing drag from lower mining investment. The mining sector is therefore likely to contribute to economic growth over the forecast period, as will other categories of exports. Chinese demand for resources for steel production has supported bulk commodity prices. However, the terms of trade are generally expected to fall over the forecast period, reaching a level somewhat above the trough recorded in early 2016, because Chinese steel demand is expected to be lower, while global supply of iron ore will have increased further.

The outlook for business investment looks to be more positive than it has for some time. Reported business conditions are at a high level and, following recent data revisions, non‑mining business investment now appears to be increasing by more than previously thought. Forward-looking indicators, especially those for non-residential building, are consistent with this continuing. A considerable amount of public infrastructure work is planned or underway, particularly in the south-eastern states. This is contributing to activity of the private-sector firms undertaking this work on behalf of the public sector, as well as encouraging some of those firms to invest more themselves.

Growth in household consumption looks to have slowed in the September quarter given recent weakness in retail spending. Consumption growth is expected to pick up gradually, but slow growth in incomes and high levels of debt are constraining factors. The slow growth in household income has been driven primarily by unusually soft outcomes for average earnings of
employees as measured in the national accounts, which has more than offset the effects of strong employment growth. Wage growth has been slow, averaging an annual rate of around 2 per cent in recent quarters, but average earnings growth has been slower still. Shifts in the composition of employment within industries to lower-paid work might partly explain this, along with the usual volatility in this measure of average earnings.

Labour market conditions have strengthened considerably in recent months. Growth in employment has continued to outpace that of the working-age population. Employment has increased in all states and has been concentrated in full-time jobs. Forward-looking indicators of labour demand suggest that above-average employment growth will continue in coming quarters. Labour supply has also expanded in all states, driven by increasing participation of women and older workers retiring later than in the past. Measures of unemployment and underutilisation have declined.

Dwelling investment looks to have peaked earlier than previously expected, and the pipeline of projects to be completed is now being worked down in some states. Dwelling investment is nonetheless expected to remain at a high level over the next couple of years, but not to contribute to overall economic growth. This implies that housing supply will continue to expand at an above-average rate, which would tend to weigh on housing prices and rents in some markets.

Housing credit growth has eased a little, and the profile of new lending has shifted away from interest-only and other riskier types of lending. This suggests that recent prudential measures are helping to address risks in household balance sheets. Household debt remains high, however, and continues to increase faster than household income. Conditions in the established housing market have eased noticeably in Sydney, but have remained relatively strong in Melbourne. Housing prices are little changed recently in Brisbane and Perth. Growth in rents is below average in most cities, while in Perth rents continue to fall and vacancy rates are rising.

The global economy has strengthened further over the course of 2017. GDP growth was stronger than expected in the September quarter in most major economies for which data are available, and this strength appears to have been maintained. Conditions in manufacturing sectors are particularly buoyant, supported by the ongoing expansion in global trade, which is particularly benefiting economies in east Asia.

Growth in China continues to be stronger than earlier expected. Growth in infrastructure and construction activity remains robust and upstream price pressures have emerged. Announcements during the recent Party Congress pointed to the authorities’ continued resolve to tackle financial sector risks and the high level of debt. Also consistent with the authorities’ stated policy priorities, cuts to steel production have been mandated to improve environmental outcomes. This might reduce Chinese demand for iron ore and coking coal, at least temporarily. Iron ore prices have fallen in recent months partly in anticipation of this. More broadly, growth in China is expected to slow a little in coming years, because the working-age population is declining and the authorities seem less likely to use policy stimulus to maintain growth around current rates.

Conditions in the major advanced economies continue to improve. Labour markets have tightened further and unemployment rates have reached low levels in the United States, Japan, Germany and some smaller euro area member countries. Ongoing policy stimulus, a recovery in investment and the recent tendency for labour supply to increase all suggest that this above trend growth could persist for a while yet. Wage growth has so far picked up only a little in these economies, however, and inflation generally remains low. The experience of economies with tighter labour markets than Australia’s shows how long it can take for pricing pressures to emerge in an environment of strong local and global competition.

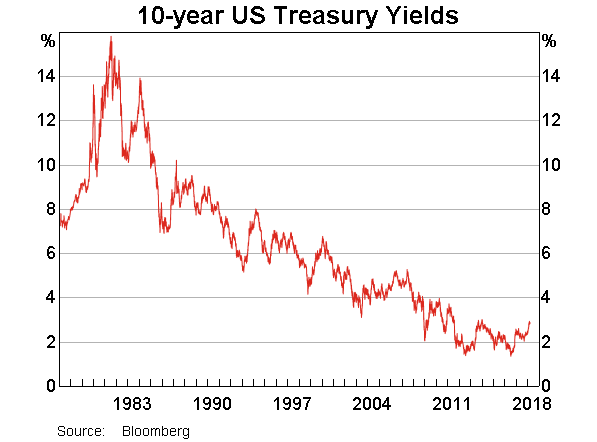
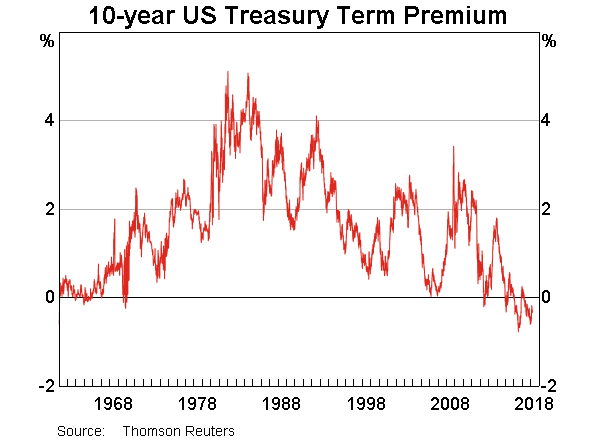
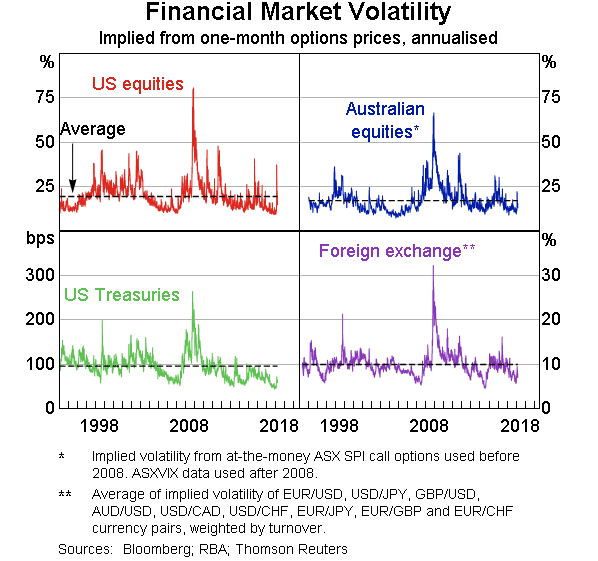
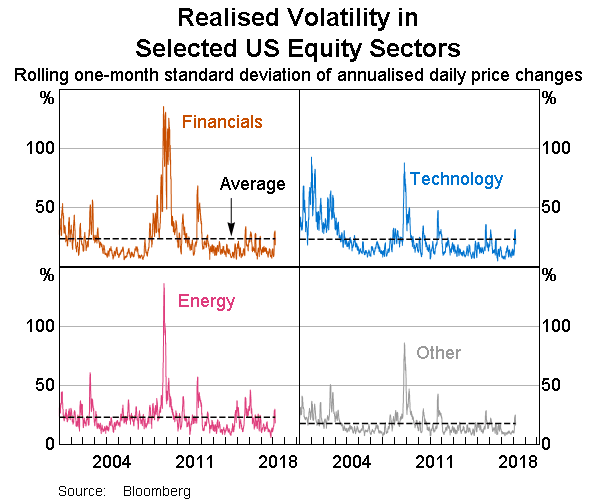
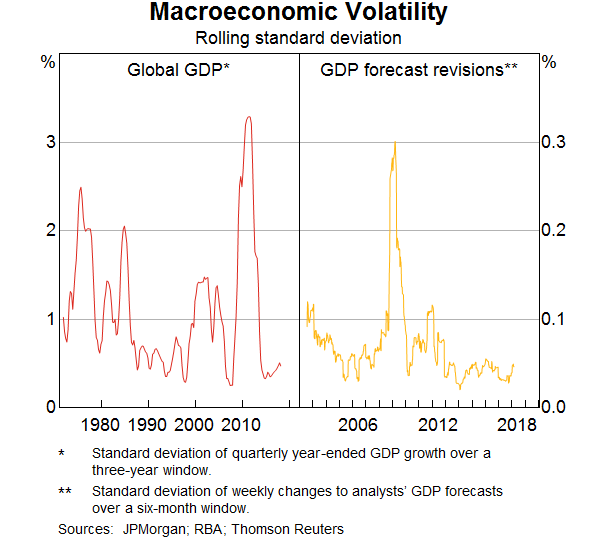
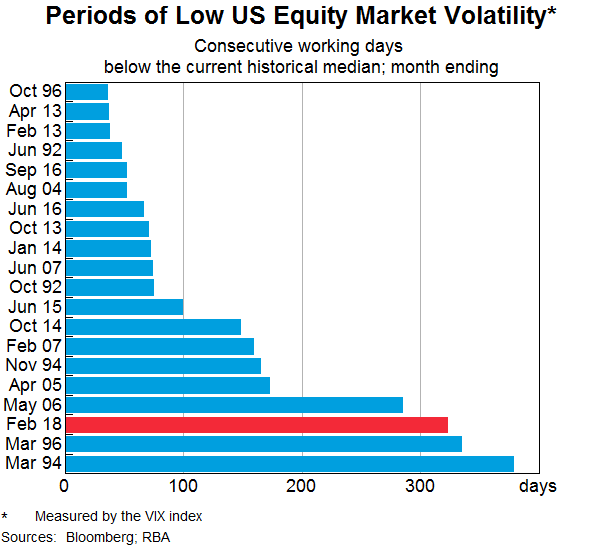
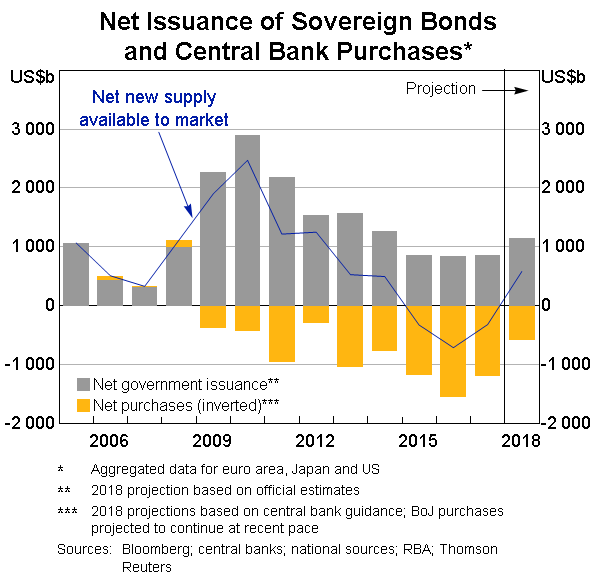
Central banks in a few countries have begun to raise policy rates and the US Federal Reserve is reducing the size of its balance sheet. Financial market pricing suggests that market participants expect policy accommodation globally to be withdrawn only gradually. Consequently, financial conditions continue to be very accommodative. Risk and term premiums have narrowed to low levels, as have spreads on corporate bonds. This has encouraged a rise in corporate bond issuance. Equity prices have risen in most markets. Financial market volatility remains low.

The stimulatory setting of monetary policy in Australia has supported the economy and helped generate a decline in unemployment. Over the period ahead, further progress on reducing spare capacity in the economy is expected, which in turn would support the forecast gradual increase in inflation. Accordingly, at its recent meetings the Reserve Bank Board has judged that holding the cash rate at its current level of 1.5 per cent would be consistent with sustainable growth in the economy and achieving the medium-term inflation target.

The RBA may have to lift rates to manage debt risk

From Business Insider.

Financial stability risks have taken on increased importance in monetary policy deliberations of Reserve Bank of Australia (RBA) Governor Philip Lowe – far more than under his predecessor, Glenn Stevens.

The importance of managing those risks, especially in the household sector, were scattered, yet again, through the RBA’s November monetary policy statement this week.

“Household incomes are growing slowly and debt levels are high,” Lowe said, elaborating on the uncertain outlook for household consumption given recent weakness in retail sales.

And, on household debt specifically, he said that “growth in housing debt has been outpacing the slow growth in household income for some time,” repeating the warning he issued in October.

Clearly, managing these risks, in his opinion, are of utmost importance.

Despite persistently low inflationary pressures, weak economic growth, softening household spending levels and strength in the Australian dollar, Lowe has left interest rates unchanged since his took over as Governor in September last year, a distinct shift in mindset to what was seen in prior years.

Gone are the days of rates moving like clockwork in the month following a quarterly consumer price inflation (CPI) report, replaced instead by a broader focus that appears to place less emphasis on the inflation outlook and more on what could happen in other parts of economy should rates be lowered again, especially the east coast property market.

The era of continually lowering rates to bring inflation back into the bank’s 2-3% target in a more timely manner now appears to be over.

Lowe, as many Australians are acutely aware, knows all too well what happened in 2016 when the RBA cut rates twice in an attempt to boost inflationary pressures.

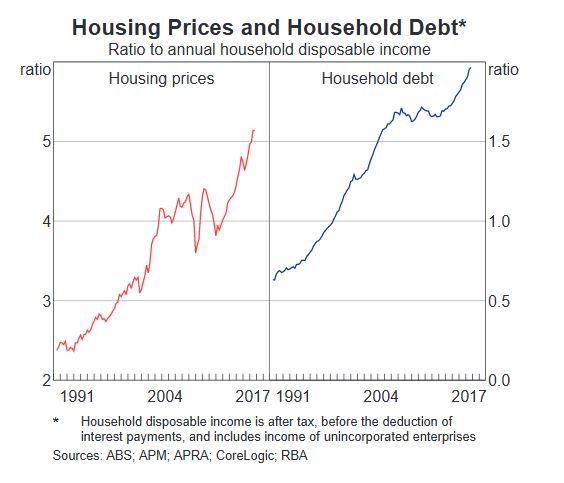
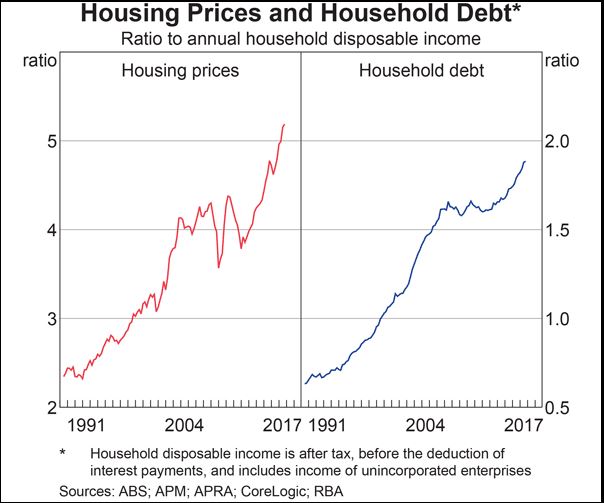
Property prices in Sydney and Melbourne surged again, thanks largely to a pickup in investor activity. Household debt levels, as a response, rose from already elevated levels, far outpacing growth in household incomes.

Household leverage, therefore, continued to increase, helping to explain why Lowe has been reluctant to cut interest rates further, pouring even more fuel on an already hot east coast property market.

As he told parliamentarians earlier this year, further rate cuts “would probably push up house prices a bit more, because most of the borrowing would be borrowing for housing.”

Instead of hiking rates to mitigate financial stability risks as was usually the case in the past, the RBA, working with other members of Australia’s Council of Financial Regulators — APRA, ASIC and Treasury — decided to go down another path, introducing tougher macroprudential restrictions on interest-only lending earlier this year, building upon the 10% annual cap on investor housing credit growth introduced by APRA in late 2014.

On the early evidence, it’s succeeded in helping to cool the rampant Sydney and Melbourne property markets.

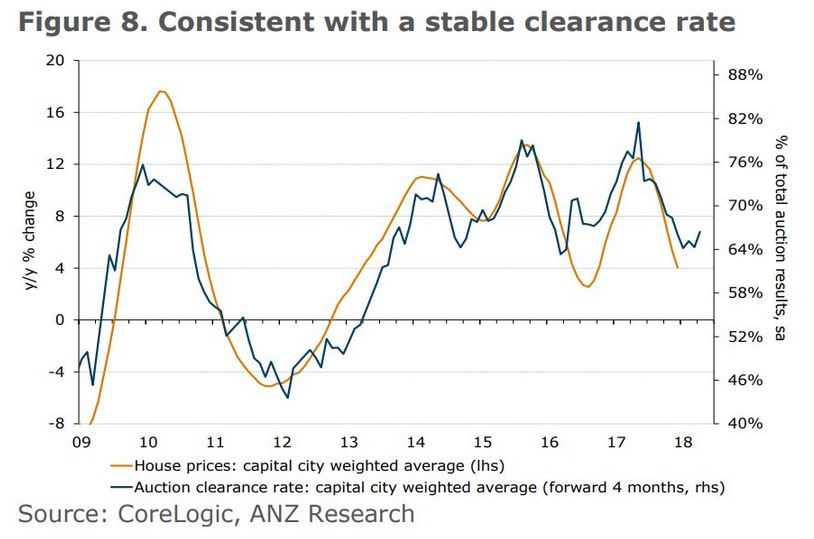
According to data from CoreLogic, Sydney house prices have fallen in each of the past two months, coinciding with auction clearance rates falling to the lowest level since January 2016.

Price growth in Melbourne has also slowed, logging the smallest quarterly increase since mid-2016 in the three months to October. Clearance rates there have also fallen from the highs seen earlier this year.

With prices in Sydney going backwards and those in Melbourne, it saw national house prices, on a weighted basis, remain unchanged last month.

As Lowe said earlier this week, “housing prices have shown little change over recent months”, partially attributing the slowdown to tougher macroprudential measures introduced in late March.

“Credit standards have been tightened in a way that has reduced the risk profile of borrowers,” he said.

However, while this, along with other factors such as affordability constraints and out-of-cycle mortgage rate increases for some borrowers, has undoubtedly helped to slow the housing market without having to resort to rate hikes, Lowe still has a problem that remains unaddressed.

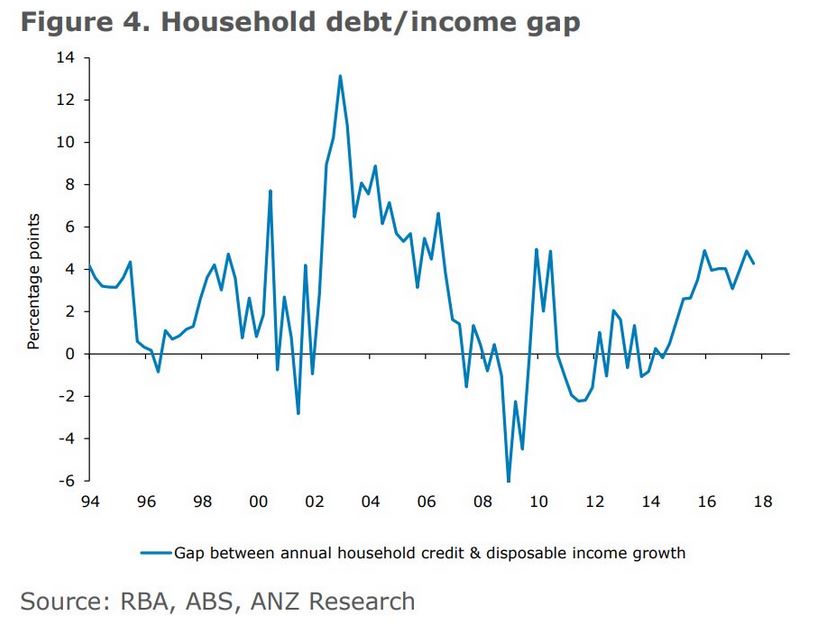
No only is growth in housing debt outpacing household incomes, it’s actually widened further this year despite tighter lending restrictions.

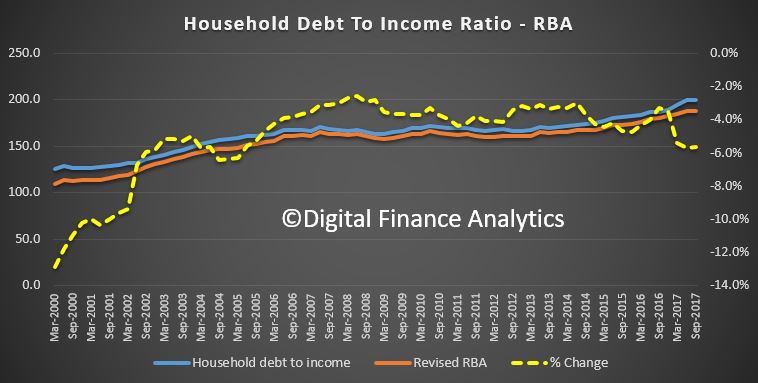
This excellent chart from ANZ shows the quandary facing Lowe.

Source: ANZ


It shows Australia’s household debt to income ratio, expressed as an annual percentage change.

“The most recent RBA data on private sector credit showed that in the year to September housing credit was up 6.6% year-on-year,” says David Plank, Head of Australian Economics at ANZ.

“The annual growth rate has been steady since May, though it has accelerated marginally since this time last year and is still significantly outpacing income growth.”

So even with the slowdown in the housing market and increased scrutiny of borrowers, household leverage has still continued to increase, adding to financial stability risks should an unexpected economic shock occur.

Plank suggests that unless income growth accelerates substantially, or growth in housing credit slows, household leverage will likely increase further.

He doesn’t hold out much hope that an acceleration in income growth will be able to achieve this in isolation.

“We very much doubt that an acceleration of income growth will completely close the gap,” he says.

“For this to happen, we need to see a further slowing in the growth rate of housing debt. “We think it unlikely that the gap can be closed without additional policy action.”

While Plank doesn’t think the RBA or APRA will rush into tighter restrictions on housing lending anytime soon, noting that annual housing credit growth has slowed marginally since APRA changes were introduced earlier this year, he says that other measures will likely be required to slow or reduce household leverage.

And that list includes rate hikes.

“We think the RBA and APRA will wait to see how things unfold, especially with house price inflation continuing to slow,” he says.

“We are sceptical, however, that the gap between debt and income growth will close without more direct policy action.

“This may initially be in the form of further macro-prudential policy, but ultimately we think it will take somewhat higher interest rates, at the very least, to bring household debt growth in line with that of income.”

ANZ is forecasting that the RBA will lift interest rates twice in 2018 — once in May and again in the second half of the year — making it one of the more hawkish forecasters in the market at present.

“We think it will opt to raise rates around the middle of next year, so long as it is confident that inflation is not moving lower and the economy is on track to deliver a falling unemployment rate,” Plank says.

The question, he says, is how will the RBA balance its inflation and financial stability objectives?

Attempting to address financial stability risks while at the same time ensuring the fledgling economic recovery isn’t derailed before it is truly self-sustaining will not be an easy task for the RBA.

Indeed, one could easily argue that higher interest rates or tighter macroprudential measures to reduce household leverage could actually heighten financial instability risks.

Given the pressure on households from high levels of indebtedness, weak wage growth and increased energy costs, along with the slowdown in the housing markets that’s already underway, any further measures could place even further pressure on household balance sheets, creating additional headwinds for household consumption that already exist.

As the most important component in the Australian economy, weaker consumption levels would almost certainly lead to slower economic growth and softer labour market conditions.

For highly indebted households, a slowdown in the both the housing and labour markets — especially at the same time — would do little to mitigate financial stability risks.

One suspects it would be the exact opposite outcome, in fact.

You can see the dilemma facing Lowe, trying to solve one problem without creating an even larger one in response.

Given how influential the property market has become on the Australian economy, a policy misstep now could have significant ramifications, both now or in the future.

RBA Holds (Month 15)

At its meeting today, the Board decided to leave the cash rate unchanged at 1.50 per cent.

Conditions in the global economy are continuing to improve. Labour markets have tightened and further above-trend growth is expected in a number of advanced economies, although uncertainties remain. Growth in the Chinese economy is being supported by increased spending on infrastructure and property construction, with the high level of debt continuing to present a medium-term risk. Australia’s terms of trade are expected to decline in the period ahead but remain at relatively high levels.

Wage growth remains low in most countries, as does core inflation. Headline inflation rates are generally lower than at the start of the year, largely reflecting the earlier decline in oil prices. In the United States, the Federal Reserve has started the process of balance sheet normalisation and expects to increase interest rates further. In a number of other major advanced economies, monetary policy has become a bit less accommodative. Equity markets have been strong, credit spreads have narrowed and volatility in financial markets remains low.

The Bank’s forecasts for growth in the Australian economy are largely unchanged. The central forecast is for GDP growth to pick up and to average around 3 per cent over the next few years. Business conditions are positive and capacity utilisation has increased. The outlook for non-mining business investment has improved, with the forward-looking indicators being more positive than they have been for some time. Increased public infrastructure investment is also supporting the economy. One continuing source of uncertainty is the outlook for household consumption. Household incomes are growing slowly and debt levels are high.

The labour market has continued to strengthen. Employment has been rising in all states and has been accompanied by a rise in labour force participation. The various forward-looking indicators continue to point to solid growth in employment over the period ahead. The unemployment rate is expected to decline gradually from its current level of 5½ per cent. Wage growth remains low. This is likely to continue for a while yet, although the stronger conditions in the labour market should see some lift in wage growth over time.

Inflation remains low, with both CPI and underlying inflation running a little below 2 per cent. In underlying terms, inflation is likely to remain low for some time, reflecting the slow growth in labour costs and increased competitive pressures, especially in retailing. CPI inflation is being boosted by higher prices for tobacco and electricity. The Bank’s central forecast remains for inflation to pick up gradually as the economy strengthens.

The Australian dollar has appreciated since mid year, partly reflecting a lower US dollar. The higher exchange rate is expected to contribute to continued subdued price pressures in the economy. It is also weighing on the outlook for output and employment. An appreciating exchange rate would be expected to result in a slower pick-up in economic activity and inflation than currently forecast.

Growth in housing debt has been outpacing the slow growth in household income for some time. To address the medium-term risks associated with high and rising household indebtedness, APRA has introduced a number of supervisory measures. Credit standards have been tightened in a way that has reduced the risk profile of borrowers. Housing market conditions have eased further in Sydney. In most cities, housing prices have shown little change over recent months, although they are still increasing in Melbourne. In the eastern capital cities, a considerable additional supply of apartments is scheduled to come on stream over the next couple of years. Rent increases remain low in most cities.

The low level of interest rates is continuing to support the Australian economy. Taking account of the available information, the Board judged that holding the stance of monetary policy unchanged at this meeting would be consistent with sustainable growth in the economy and achieving the inflation target over time.

RBA Releases FOI Data On Housing Component of CPI

Does the CPI method of calculation accurately reflecting the housing costs facing households? This has been subject of much discussion and RBA has released 98 pages of information under a FOI request – “Documents relating to the removal of mortgage interest rates from the CPI series in September 1998 and documents relating to the housing component of the CPI between September 2016 and September 2017″.

The FOI papers go through from the 1997/8 decision by the ABS to change the housing element of CPI from an “outlay” to “acquisition” approach. Market prices for goods and services are exclusively utilised… Non‐monetary transactions (i.e. imputed prices, such as imputed rent) and interest rate payments are excluded. This is the method the RBA supported.

There was much discussion in the documents as to whether house prices are connected with actual dwelling construction costs, rather than the market rate, which is more to do with sentiment, location etc. [Compare similar property  in Sydney versus Tasmania, for example].

This from 2017:

Papers this morning continue to discuss the ‘massive flaw’ in the consumer price index (CPI). The Daily Telegraph headlines ‘flaw in RBA calculations hits home’, though the article later clarifies that it is referring to the Australian Bureau of Statistics’ ‘premier’ inflation gauge, which guides the Bank in its monetary policy deliberations. Articles say the main problem (revealed in a Commonwealth Bank analysis released yesterday) is the exclusion of a broad measure of property price growth in the CPI calculation. It is argued that including dwelling prices in the CPI would ‘assist’ the Bank in hitting its inflation target. This suggests that the current cash rate setting is too low, which in turn is fuelling the property boom and leading to record high household debt.

Recent media reports have discussed the treatment of housing in the CPI, arguing that due to the exclusion of dwelling prices (including land) the CPI understates cost of living pressures for those looking to purchase property.

The media reports refer to a Commonwealth Bank (CBA) article, which argues that the CPI is considered to be a defacto cost of living index. The author suggests that the cost of a dwelling, including land, is part of the inflation faced by households who aspire to own a home. By adding in a measure of dwelling prices (with a 10 per cent weighting), CBA suggest that CPI inflation would have been much higher over most of the past decade.

This would mean the policy interest rate setting was too low.

The CBA article uses the residential property price index to measure owner-occupied housing costs. This is not suitable for a cost of living measure. A dwelling is an asset that provides a stream of housing services.

The cost of living index should measure the cost of obtaining the housing services, which is the user cost, not the cost of obtaining the dwelling itself. The user cost will be affected by the price of the dwelling, but it will also reflect other considerations, such as the real interest rate. Of course, changes in the prices of existing dwellings are still relevant to debates about intergenerational equity. Changes in dwelling prices, like changes in the prices of financial assets, can affect the relative wealth of different demographic groups.

In response, the ABS said “The Australian CPI is primarily used as a macro‐economic indicator to monitor and evaluate levels of inflation in the Australian economy. The CPI is not designed as a cost of living index.” This is consistent with earlier statements by the ABS”.

Also worth noting in today’s ABS release, they stick to the acquisition approach.

Under the acquisitions approach used in the CPI, the net purchase of housing, the increase in volume of housing due to renovations and extensions, plus other costs (e.g. maintenance costs and council rates) are all included for owner–occupied households. Of note, land is excluded from the calculation of housing in the Australian CPI as it is considered an investment rather than consumption. This approach aligns with international statistical standards and the primary purpose of the CPI as a macro–economic indicator. Changes in rental are measured for that part of the population that resides in rented dwellings. The CPI excludes interest paid on mortgages.


Why the RBA would want to create a digital Australian dollar

From The Conversation.

The Reserve Bank of Australia could join the likes of Estonia and Lebanon in creating a cryptocurrency based on the Australian dollar, to reap the benefits of technology like the blockchain but with more stability than other well known currencies like Bitcoin.

The RBA has already been approached by interested startups to create this new digital currency, known as the “DAD” or Digital Australian Dollar.

In contrast with other cryptocurrencies a state-backed digital currency has the advantage of being backed by the government as in fiat currency, but at the same time has the technological advantages shared by other cryptocurrencies.

A digital Australian dollar could remove the role of middlemen and create a cheaper electronic currency system, while at the same time enabling the government to fully regulate the system.

It would also allow transactions to settle faster (several minutes to an hour) than the traditional banking system (several hours to several days), especially in a situation where an international payment is involved.

The difference between a digital Australian dollar and Bitcoin

We already use the Australian dollar in a digital form, for example paying via your smartphone. But banks are essential in this system, moving money on our behalf.

When using a cryptocurrency, you interact with a system like the blockchain, an online ledger that records transactions, directly. Bitcoin, Litecoin, and Ethereum are examples of cryptocurrency that use the blockchain in this way. These currencies are created by the community that use them and are accepted and trusted within the community.

However, since the community runs the system, the price of the cryptocurrency solely depends on the market mechanism. When the demand increases, the price increases, but when the demand decreases, the price also decreases. While it might create an opportunity for speculators to gain profit from trading, it also creates risk for the cryptocurrency holders.

In comparison to cryptocurrency, the Digital Australian Dollar might be well managed that the price volatility could be reduced significantly. The government holds the capability of increasing or decreasing the money supply in the system. This power can be used to stabilise the market supply of the new digital currency.

The blockchain technology also reduces the fee for every payment made. This is made possible by removing the role of banks or other intermediary parties charging fees for their services. However, a small transaction fee still needs to be introduced to protect the system from being flooded by adversaries with insignificant transactions.

The characteristics of cryptocurrency itself might limit its usage to daily transactions. As the pioneer of cryptocurrency, Bitcoin was created to become a payment system, but the users gain incentive by simply saving their cryptocurrency and not using them to purchase goods or services.

They believe the future price of the cryptocurrency is higher than the current price and thus does not make a good medium of exchange nor a store of value. There is no guarantee that the cryptocurrency will hold any value in the future. Since there is nothing to back up the value, users will lose their wealth when the community no longer acknowledges the value of cryptocurrency.

Cryptocurrency might also jeopardise the local government’s effort of implementing regulations to minimise illegal activities. Perpetrators create cryptocurrency transactions easily without being detected by the government’s financial monitoring system.

The privacy features of cryptocurrency also make it hard for law enforcement agencies to determine the actors behind illegal activities. Although most governments in the world have enforced the coin exchange services to identify their users, the operation of the cryptocurrency is beyond their reach.

There are other state-backed digital currencies

The idea of creating a national cryptocurrency is not new. Estonia has explored ways to create Estcoin, following an initiative on the blockchain-based residency registration called e-Residency. Lebanon’s central bank has also started to examine the possibility of creating one.

Despite the efforts of those central banks, several questions must first be addressed before launching the real product to the public. The user’s financial data could be exposed since the blockchain will make all transactions created in the system transparent.

Consumer protection is also a concern since all transactions made in the blockchain are permanent without the possibility of being reversed. Without firm solutions to those problems, the Digital Australian Dollar will not satisfy all requirements to be the next groundbreaking innovation for the country’s financial system.

Author: Dimaz Wijaya, PhD Student, Monash University

Lending In Sept 2017 Still Fixated On Housing

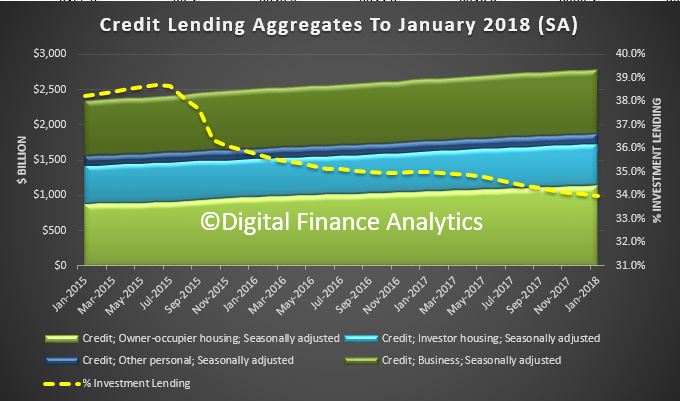
The RBA has released their financial aggregates to September 2017.  The data confirms the growth is still in the mortgage sector, with both owner occupied and investment lending growing quite fast, significantly faster than productive business lending. So expect to see household debt rise still further. The settings are just not right to create sustainable economic growth, rather they still support a debt driven property splurge.

There was a significant volume of loans switched in the month – $1.4m are shown in the aggregates table, but are corrected in the growth tables, which is why investor lending is reported more strongly there.

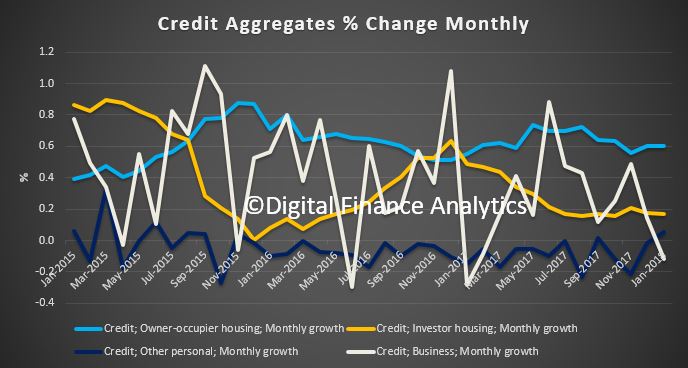
Overall lending for housing rose 0.5% in the months, or 6.6% for the year, which is higher than the 6.4% the previous year. Personal credit rose slightly in the month and down 1.% in the past year.  Lending to business rose just 0.1% to 4.3% for the year, which is down from 4.8% the previous year.

Owner occupied lending grew $5.5bn or 0.5% to $1.11 trillion while investment lending rose $1.9% or 0.3% to $583 billion. Lending to business rose just $0.3 billion and personal credit rose $0.3 billion or 0.2%, the first rise since February 2017.

The share of investment lending remained at 34.3% of lending for housing, while the share of all lending to business fell to 32.7%.

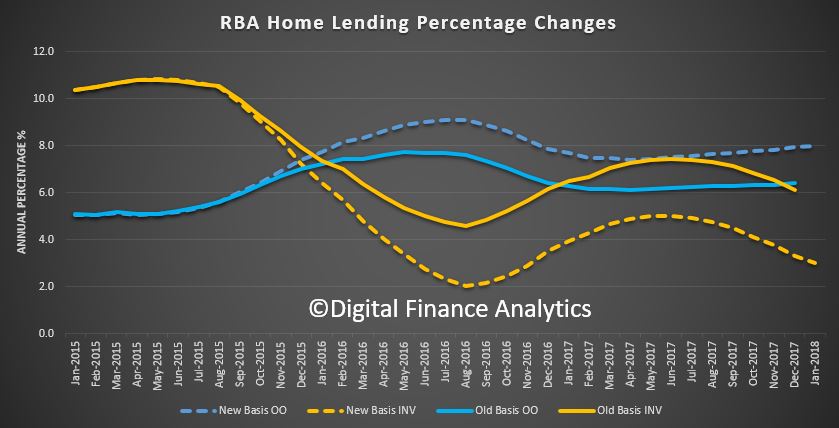
Looking at the adjusted RBA percentage changes we see that over the 12 months investor lending is still stronger than owner occupied lending, both of which showed a slowing growth trend, while last month growth in business lending continued to ease.

The RBA noted that:

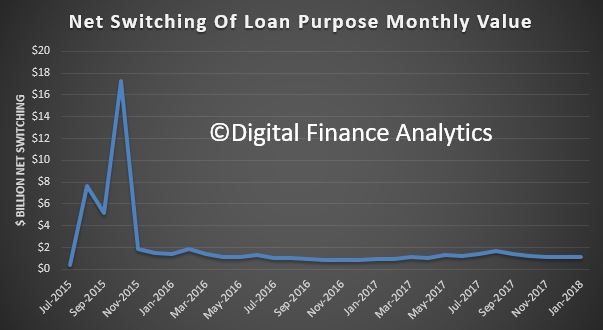
Following the introduction of an interest rate differential between housing loans to investors and owner-occupiers in mid-2015, a number of borrowers have changed the purpose of their existing loan; the net value of switching of loan purpose from investor to owner-occupier is estimated to have been $59 billion over the period of July 2015 to September 2017, of which $1.4 billion occurred in September 2017. These changes are reflected in the level of owner-occupier and investor credit outstanding. However, growth rates for these series have been adjusted to remove the effect of loan purpose changes.

Household Debt Grinds Higher

The ABS published some revisions to their Household Income and Wealth statistics.

Two data series stood out for me. First, more households are in debt today, compared with 2005-6, and second more households have debts at more than three times their income.

Here is the plot of the proportion of households with debt, by income quintile. In 2003-4, 72.9% of all households had debt, and this rose to 73.6% in 2015-16, up 0.7% across the series.

But, those on lower incomes have borrowed harder, with 50% in the bottom income range borrowing, compared with 44.6% in 2003-4, a rise of 5.4%. The second lowest saw a rise of 2.2%, up from 64.5 to 66.7. On the other hand, the highest quintile saw a fall from 91.8% in 2003-4 to 89.2% in 2015-16, down 2.6%.

The ABS also said that in 2005-6 the proportion of households with debt more than three times income was 23.9%, while in 2015-16 it was 27.2%, up 3.3%.

This underscores the issue we face, debt is higher, and more lower income families are more stretched. Sure, net worth may be higher now, but the debt (mostly mortgage debt) is the problem. As we saw last week, most of the growth in wealth is associated with home prices. Should they reverse, then this looks very wobbly.


CPI and Uncertainly

Interesting speech from RBA’s Guy Debelle, highlighting issues around measuring an number of economic factors. He calls out CPI as one area of uncertainly, especially as the ABS does a quarterly report (unlike many other countries who publish monthly) and the changes in weightings which will impact ahead. There is a lot of noise in the data…!

For inflation – which is also published quarterly in Australia – we won’t get an official read on the current rate until the December quarter Consumer Price Index (CPI) is released in late January, three months from now. In most other countries, the CPI is published monthly, so the wait to get an assessment on current inflation is not so long elsewhere.

More timely and more frequent estimates of output and inflation are not unambiguously desirable. There is clearly a trade-off between timeliness and accuracy. But, in the case of inflation, a more frequent estimate would help to identify changes in the trend in inflation sooner; it probably comes with more noise, but we have ways to deal with that. Any reading on inflation always contains varying degrees of signal and noise about the ‘true’ inflation process. At the moment, we need to wait three more months to gain a better understanding as to whether any particular read on inflation is signalling a possible change in trend or is just noise. That is one of the reasons why the RBA has long advocated a shift to monthly calculation of the CPI.

That said, we do not depend solely on GDP and the CPI to assess the current state of the economy. We spend a lot of time and effort piecing together information from a large number of other sources. These include higher frequency and more timely data, including from the ABS, but also from a wide range of other data providers. The information we obtain from talking to people, particularly through our business liaison program, is also invaluable.

The question then arises as to how we can filter the information we receive from all these different sources to gain an overall picture about inflation and the state of the overall economy. Take GDP as an example. Some of the data released before the national accounts, such as monthly retail sales and international trade, feed directly into the calculation of GDP. So we have a direct read on those. We ‘nowcast’ other components of GDP using data that are more timely. Let me illustrate for household consumption. We get a good measurement of consumption of goods by looking at monthly retail sales and sales of motor vehicles and fuel. But there is very little timely information on household consumption of services, so the nowcast of this component relies more on statistical relationships. Some of these relationships are pretty weak, so we also supplement this with information on sales from our regular discussions with our business liaison contacts. This then gives us an estimate of consumption for the quarter. To get a preliminary nowcast for GDP growth for the quarter, we aggregate our best estimate for each of the relevant components. We then ask ourselves whether this estimate is consistent with other information that we have, such as the monthly labour market data, as well as predictions from our macro forecasting models.

The nowcast can be then updated with new information as it comes to hand. That said, my observation from a couple of decades of forecasting is that your first estimate of GDP (three months out) is often the best, and that additional information is often noise rather than signal.

Measurement uncertainty

Aside from when data are published, uncertainty about the present also arises from how things are measured. This takes two forms. First, there is the methodology used to actually measure the variable in question. Second, there are the revisions to data after they were first published.

On the first, a good example is the CPI. The CPI measures prices for a large number of items purchased by households. When aggregating these to calculate the overall consumer price index, each item is assigned a weight based on its average share of household expenditure. That is, the aim is to weight each price by the amount households spend on it, on average, in the period in question.

Obviously, these weights can change through time. But the weights used in the CPI are only updated each time the ABS conducts a Household Expenditure Survey, which, in recent times, has been every five or six years.

In between each household expenditure survey, a number of things can happen. First of all, some new goods and services can come along that weren’t there before. One example you might think of is a mobile phone. Though it’s not quite that straightforward, as before mobile phones, households spent money on landline phone bills and on cameras. So often these ‘new’ goods are providing similar services to something that was there before. Nevertheless, the ABS needs to take account of these new goods coming in, as well as some old items dropping out.

Secondly, households adjust their spending in response to movements in prices and income. In practice, households tend to substitute towards items that have become relatively less expensive, and substitute away from items that have become relatively more expensive. But the expenditure weights in the CPI are only updated every five or six years. Over time, the effective expenditure weights in the CPI become less representative of actual household expenditure patterns. That is, they are putting more weight on items whose prices are rising than households are actually spending on them. This introduces a bias in the measured CPI – known as substitution bias – which only is addressed when the expenditure weights are updated. Because households tend to shift expenditure towards relatively cheaper items, infrequent updating of weights tends to overstate measured CPI inflation.

The ABS will very shortly update the expenditure weights in the CPI. Because of substitution bias, history suggests that measured CPI inflation has been overstated by an average of ¼ percentage point in the period between expenditure share updates. While we are aware of this bias, we are not able to be precise about its magnitude until the new expenditure shares are published, because past re-weightings are not necessarily a good guide. It is also not straightforward to account for this in forecasts of inflation. However, from a policy point of view, the inflation target is sufficiently flexible to accommodate the bias, given its relatively small size.

Going forward, the ABS will update the expenditure shares annually, rather than every five or six years. This will reduce substitution bias in the measured CPI.

Banking Regulators Asleep at the Wheel?

Well, finally, we got an admission from APRA that mortgage lending standards have decayed over the last decade, and that they needed to take action to reverse the trend. And now they are looking at debt-to-income.

Poor lending standards, they say are systemic, driven by completion, and poor bank practices. They recently intervened (a little). And late to the piece (now) debt-to-income is important. Did you hear the door slamming after the horse has bolted?

This is after ASIC called out poor lending practices, and the RBA have been raising concerns about the high household debt, and the downstream risks to growth this represents.

A completed change of tune from the declarations of 2015 when everything was said to be just dandy!

Those following this blog over the past few years will know we have been flagging these concerns, especially as the cash rate was brought to its all time low.  We said DTI was critical, that standards should be tightened, and the growth of debt to income was unsustainable.

These three parties, plus the Treasury form the “Council of Financial Regulators” which is chaired by the RBA are all culpable.  This body, which works behind the scenes, is referred to when hard decisions need to be take. If you look back at recent APRA and RBA statements, the Council gets a Guernsey!

The problem is there has been group-think for year, driven by the need to use households as a growth proxy for the failing mining and resource sector. And no clear accountability.

But too little has been done, too late.  And it is poor old households who, one way or the other will pick up the pieces – not the banks who have enjoyed massive profit and balance sheet growth.

Even now, lending for housing is growing three time faster than incomes or cpi.

Regulators are now lining up to call out the problems. Managing the risk going forwards is a real challenge. Time to review the regulatory structure.

Worth remembering that the Financial System Inquiry recommended the creation of a new Financial Regulator Assessment Board to assess the performance of the regulatory framework, but this was rejected by the Government!