UK GDP Weakest Growth Since 2012

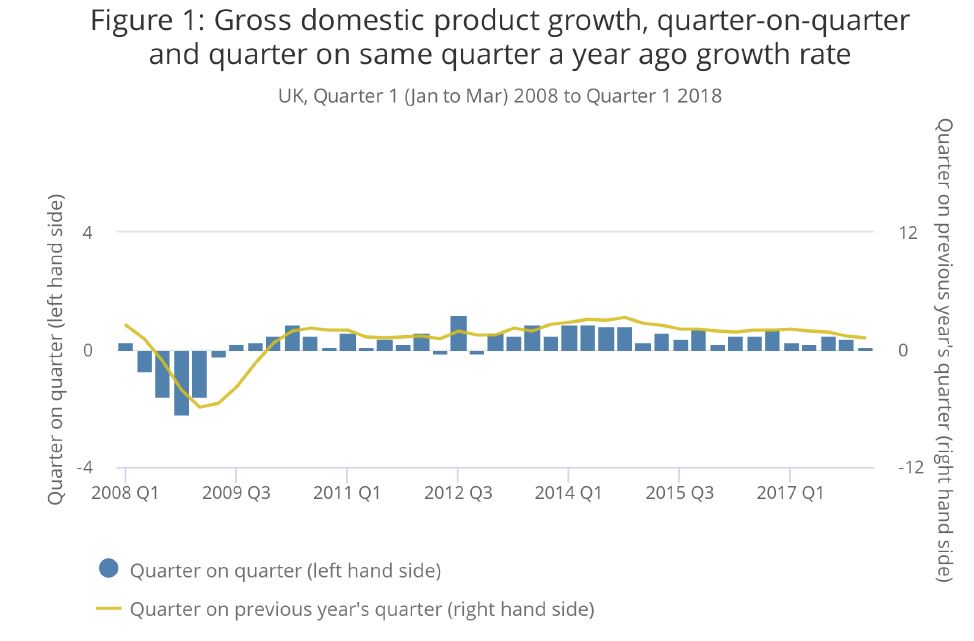
According to the Office for National Statistics, the UK economy grew by 0.1% in Quarter 1 (Jan to Mar) 2018, marking the weakest quarterly growth since Quarter 4 (Oct to Dec) 2012. The weakness in Quarter 1 2018 was driven by a sharp decline in construction output and a sluggish manufacturing sector, while growth in the services industry also slowed.

While today’s figures suggest that recent heavy snow had a negative impact on some areas of the economy, such as construction and parts of retail trade, the overall impact of adverse weather conditions on output in Quarter 1 2018 was relatively small.

The 12-month growth rate for the Consumer Prices Index including owner occupiers’ housing costs (CPIH) fell to 2.3% in March 2018; the change was driven mainly by the clothing and footwear, and alcoholic beverages and tobacco categories.

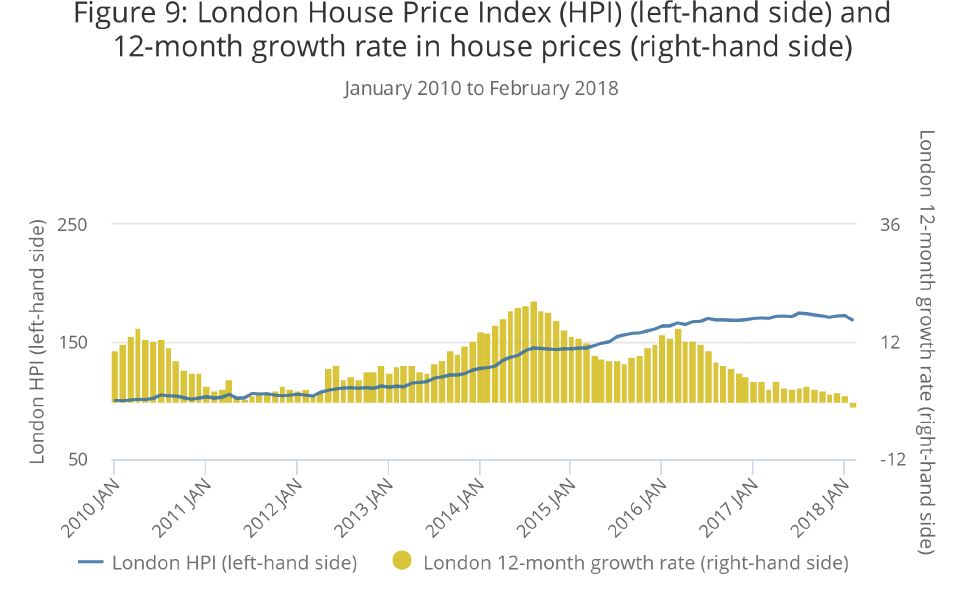
In February 2018, the latest month for which data are available, the 12-month growth rate for house prices in London fell to negative 1.0%, its first month of annual contraction since September 2009, continuing a recent broad trend of slowdown that started in 2014. The decrease in house price growth in London since March 2016 probably reflects changing demand for properties in the capital, following the introduction of a higher rate of Stamp Duty on additional properties in April 2016, and affordability due to historic high prices in the capital.

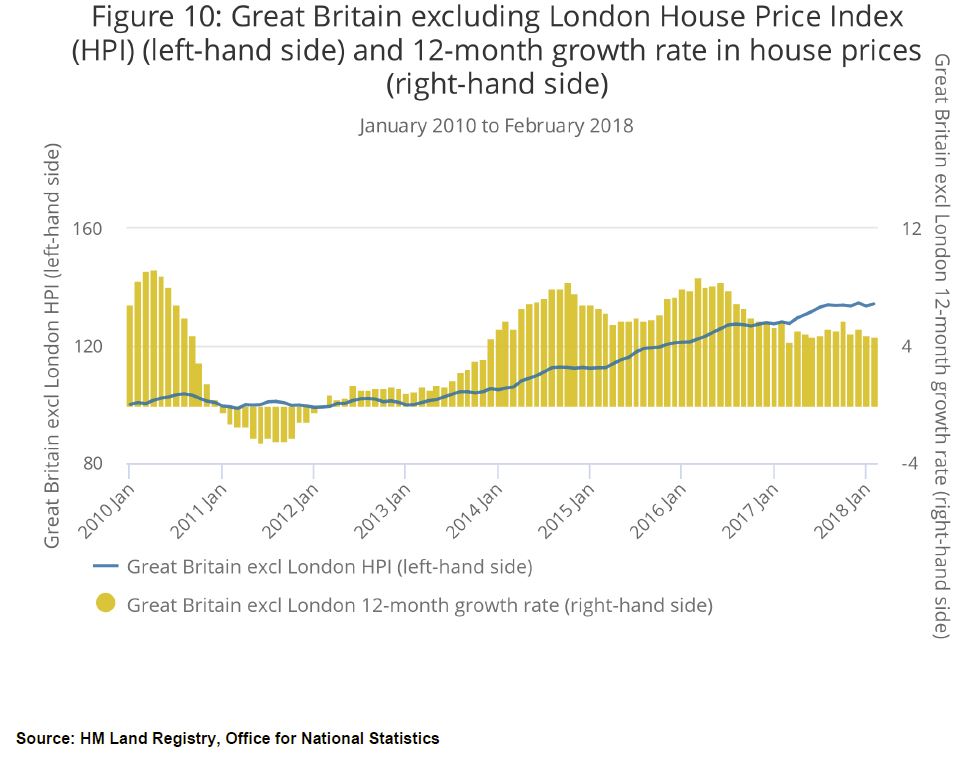
Over the same period, the 12-month growth rate in Great Britain excluding London has been relatively more stable, falling only from 8.7% in March 2016 to 4.7% in February 2018.

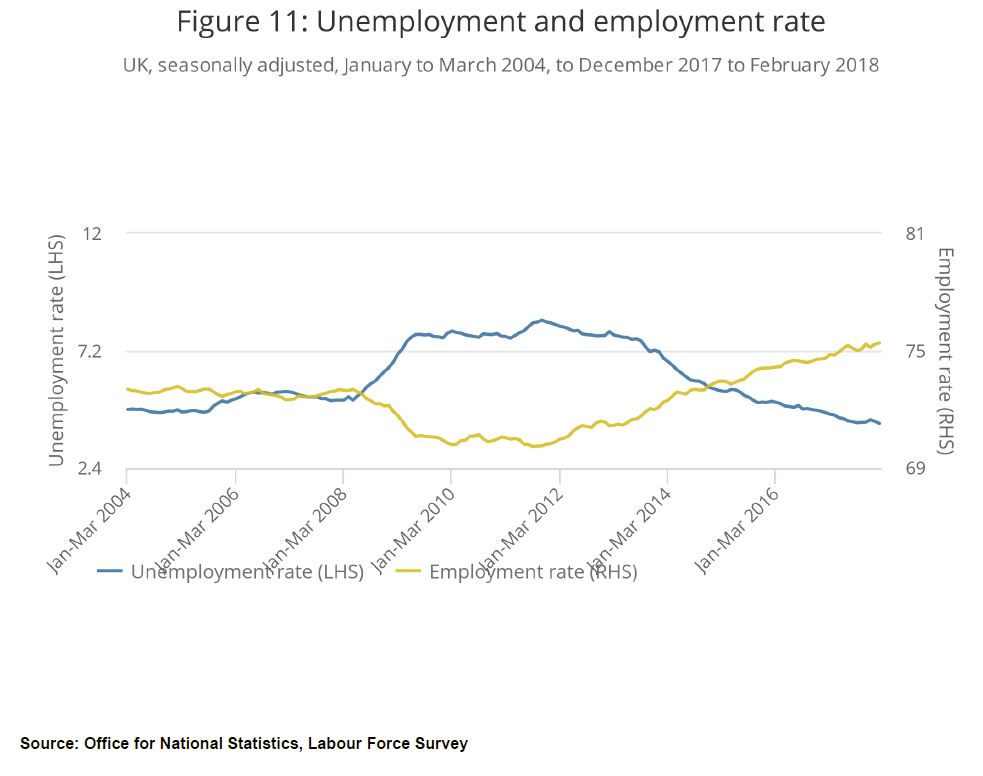
The unemployment rate was at 4.2% in the three months to February 2018, a record low since 1975. The employment rate was at a record high in December 2017 to February 2018, at 75.4%. There has been an increase since the economic downturn in the responsiveness of employment to economic growth. Industries with high employment intensity of growth help contribute to the growing employment and low unemployment.

Peer to Peer – Scale and Scalability

From BankUnderground.

Peer to Peer (P2P) lending is a hot topic at Fintech events and has received a lot of attention from academia, journalists, various international bodies and regulators.  Following the Financial Crisis, P2P platforms saw an opportunity to fill a gap in the market by offering finance to customers and businesses struggling to get loans from banks.  Whilst some argue they will one day revolutionise the whole banking landscape, many platforms have not yet turned a profit.  So before asking if they are the future, we should first ask if they have a future at all. Problems such as a higher cost of funds, or limited ability to scale the business, may mean the only viable path is to become more like traditional banks.

Present Scale and Profitability

P2P activity has now been around for over a decade. The fastest growth has been in China, followed by the USA and the UK (total new alternative finance provision in 2016: China – $243bn,US – $35bn, UK – £4.6bn). P2P lending platforms offer an online marketplace and depend on both the external supply of investment and the demand for loans. Currently, platforms lack product diversification with their revenue deriving from origination and servicing fees. As such, platforms are extremely reliant on continuously attracting and matching loans for investors and borrowers.

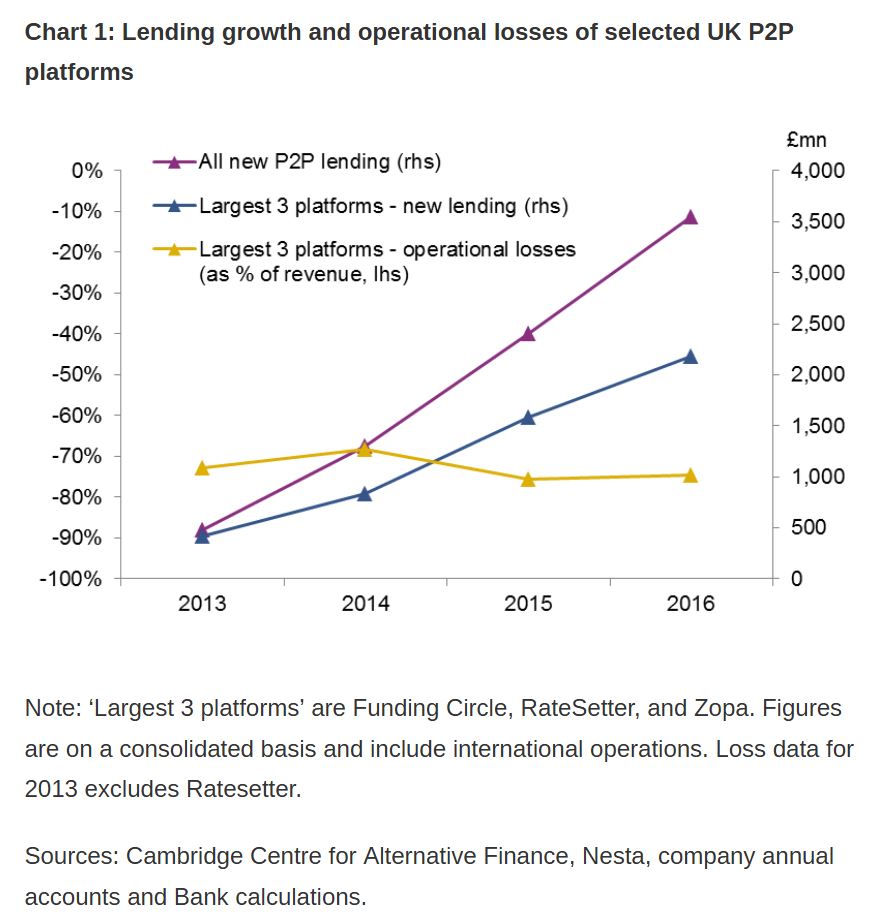
Despite having substantial lending volumes, many big UK and US platforms are still making operating losses despite their rapid growth.

In the following two sections we explore two ways in which P2P platforms could make money: first, by scaling up their existing business models; and second, by changing their business models altogether.

Scalability

It may be that some platforms have made a conscious decision to favour growth over profitability for now, with a view to realising economies of scale. Central to this business model is i) whether there is sufficient appetite for the P2P investments and loans for the platform to reach scale and ii) whether their revenues can exceed the costs, even if they achieve higher scale.

Appetite for P2P products

P2P lending is still relatively young in the UK. As matchmakers, P2P lending platforms need to keep attracting new customers from both sides of the equation in order to grow. This is not a straightforward task: for example, supply of funds might be available but there might be lack of quality borrowers.  Or alternatively, they might have a slew of willing borrowers but are unable to tempt sufficient investors to finances them. A slowdown on either side affects platforms’ growth.

In the UK, P2P lending to businesses (mostly small to medium sized) is more substantial than to consumers. By contrast, in China and the US, P2P lending is mostly consumer focused.  On the supply side, retail investors have dominated the market, but the role of institutional investors has been increasing.

In the past few years, the market in the UK has been growing very rapidly, with year on year new lending growth in the region of 100%. But new data from the Cambridge Centre for Alternative Finance suggests that although activity is still growing, the pace of that growth has slowed down considerably.  In 2016, total new lending grew by roughly 50% in the UK and 20% in the US.

This, coupled with indications from some lenders that they are running into borrower constraints (i.e. their lending activity is being restricted by the low amount of potential borrowers), suggests that the traditional P2P lending model, that is widely used in the UK, may be reaching its limits. If growth rates continue to slow, platforms will find it more difficult to achieve the size necessary to fully realise their economies of scale.

One way that individual platforms may attempt to tackle this issue is through consolidation but given that the industry appears to be quite concentrated already (currently there are 3-4 major platforms that are key players), there might be only limited room for further concentration.  At the end, it may be that sustainable profitability may only be achievable with a few large lenders on the market.  Parallels can be drawn with other tech industries, where initially there were a number of players, but they gradually consolidated down to one or two market leaders (e.g. Google, Facebook).

Cost Structure

However, it might be the case that even following consolidation and hence larger scale, platforms still will not make money. For example, Uber is still unprofitable despite being a market leader on a large scale. And the two largest lendingplatforms in the US, who are dominant providers of P2P loans and several times larger than UK platforms, are also loss making.

The answer may lie in examining platforms’ cost structure more closely.  In theory, P2P platforms have operating cost advantages; they have no legacy costs, no requirement for branch networks and lower regulatory costs. At face value, these should be lower than for traditional banks. And, unlike traditional banks, these should be largely unrelated to scale- because, like other tech disruptors, their main cost is setting up and operating a platform. That opens up the possibility of undercutting traditional banks if platforms can achieve high enough lending volumes to overcome their fixed costs and realise these cost advantages.

But we must also think about the P2P lenders’ cost of funding- i.e. the interest rate they have to offer lenders to induce them to invest.  If this cost of funding is sufficiently higher, this could undo the advantage of lower operational costs. In reality, banks are able to borrow money at a lower cost, so even if P2P lenders have the slimmer cost base they may not be able to undercut banks, despite offering higher interest rates to borrowers.  Just scaling up might not be enough and some platforms may need to adjust their business model altogether…

Becoming a bank-like P2P platform

In the UK, P2P lending platforms have generally begun with ‘traditional’ or ‘pure P2P’ business models. But what started as pure and simple has been continuously evolving. Platforms have already been experimenting with new business models and techniques.

Some “P2P” platforms have had success operating a ‘balance sheet’ lending model. These platforms’ business model is not pure peer-to-peer lending, because the bank itself co-invest with investors, putting their ‘skin in the game’.  To do this successfully, such platforms tend to also concentrate on a particular lending market (e.g. property lending).

Other platforms might turn to traditional banking (one of the leading UK platforms is already applying for a banking licence) perhaps to diversify range of services they offer. For example, platforms will be able to offer FSCS-protected deposit accounts for savers and personal loans, car finance, and credit cards for borrowers, alongside their P2P products. Another reason is that FSCS protected deposits mean lower funding costs. Guaranteed deposits also mean that platforms can be listed on “best buy” comparison portals for savings account, creating a new potential market to tap for funds.

A natural question that follows – is there a fundamental difference for customers between banks and P2P platforms? The answer is not straightforward. Undoubtedly, platforms offer some distinct benefits for investors compared to banks– an opportunity to lend directly to businesses and retail consumers with relatively small amounts of investment, and achieve a higher rate of interest than is available from traditional savings accounts. On the other hand, banks offer deposits that are covered by the FSCS and so are less risky to P2P investors (although less risk averse investors might find that a better place to be on the risk-return trade-off).

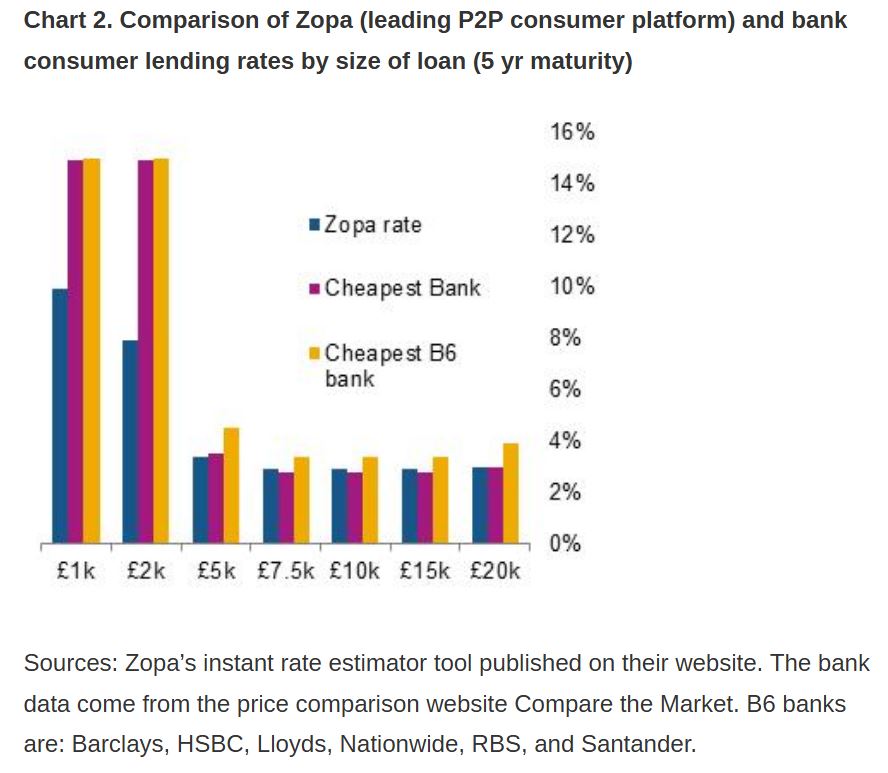
On the borrowers’ side, there may be less differentiation. Our internal analysis (Chart 2) shows that interest rates on personal loans arranged via P2P platforms are competitive but not significantly lower than the rates available from banks. The exception is low-value loans (i.e. around £1-2k), where banks’ manual processes and fixed costs, make it uneconomical for them to compete.

But P2P platforms are not the only ones adapting. As P2P lenders start to become more like banks, banks are starting to become more like P2P lenders in some respects.  To counter the possible competitive threat from P2P lenders, banks have started to offer quicker and more user-friendly loan applications services (including quick, all-digital SME lending services). For a potential borrower, the difference between a P2P platform and a bank becomes less obvious. So, to stay in the game, platforms will need to compete for borrowers’ attention by offering a wider range of bank-like services.

Ironically, it might be the case that as much as the platforms have wanted to disrupt the banking model, they might need to turn towards it to grow and to achieve profitability.

Conclusion

Ultimately, the feasibility of scaling up depends on the balance of the two factors: a continuous appetite for P2P investments and loans, and whether the revenues can be higher than the costs when they do scale up.

The answer could be that platforms will need to consolidate and adjust their business models if they wish to have a significant and lasting presence in the financial system. A key part of this may be turning to banking: whether via partnering with banks or by offering bank-like services themselves. Peer-to-peer lending might be changing the world, but perhaps it will have to change itself first.

Bank Underground is a blog for Bank of England staff to share views that challenge – or support – prevailing policy orthodoxies. The views expressed here are those of the authors, and are not necessarily those of the Bank of England, or its policy committees.

Millennials’ home ownership hopes dashed by a broken housing market

From The Conversation.

Speaking to the Conservative Party conference in September 2017, the UK prime minister, Theresa May, gave a stark assessment of the UK housing market which made for depressing listening for many young people: “For many the chance of getting onto the housing ladder has become a distant dream”, she said.

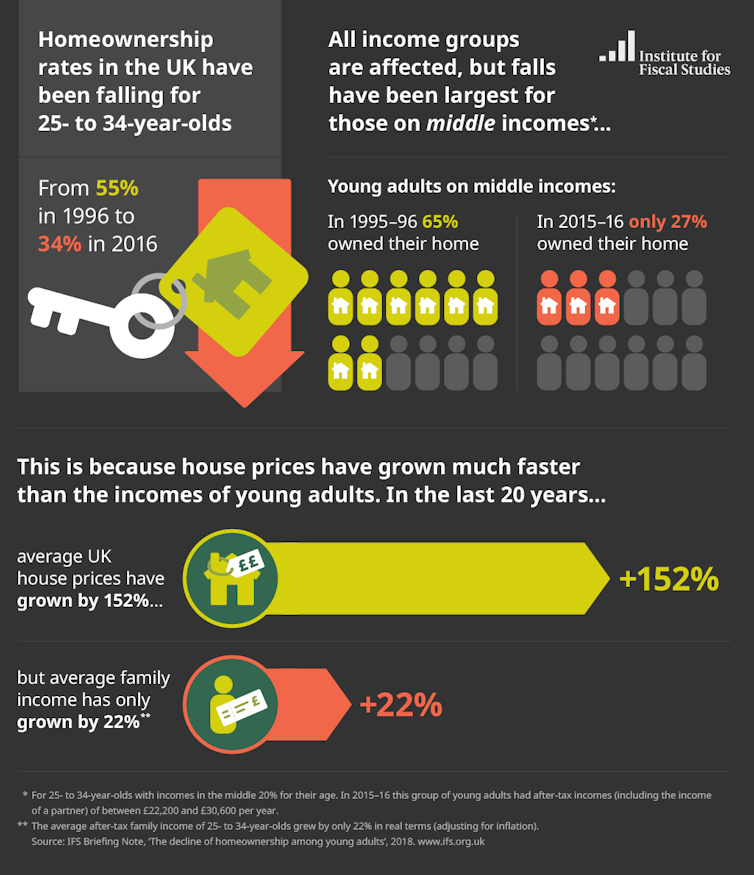
Now a new report by the Institute of Fiscal Studies (IFS) provides further, clear evidence of this. The study finds that home ownership among 25 to 34-year-olds has declined sharply over the past 20 years. Home ownership rates have declined from 43% at age 27 for someone born in the late 1970s, to just 25% for someone aged 27 who was born in the late 1980s.

The most significant decline has been for middle-income young people, whose rate of home ownership has fallen from 65% in 1995/6 to 27% now – most significantly hitting aspirant buyers in London and the South-East.

Causes and consequences

The IFS study lays the blame for all this on the growing gap between house prices and incomes. Adjusting for inflation, house prices have risen 150% in the 20 years to 2015/16, while real incomes for 25 to 34-year-olds have grown by 22% (and almost all of that growth happened before the 2008 crash).

A bleak picture. Institute for Fiscal Studies.

But, as the report acknowledges, the problem goes much deeper than this. Home ownership rates differ by region. Although there has been a decline in home ownership rates for young people across all areas of Great Britain, the decline is less significant in the North East and Cumbria as well as in Scotland and the South West. The biggest decline in ownership has been in the South-East, the North-West (excluding Cumbria) and London.

So a person aged 25 to 34 is more than twice as likely to own their own home in Cumbria, as their counterpart in London. Worse, young people from disadvantaged backgrounds are less likely to own their own homes – even after controlling for differences in education and earnings. Home ownership continues to reflect a deeper inequality of opportunity in our society.

More houses needed

Part of the problem is that both Labour and Conservative governments have seen housing as a single, stand-alone market and have focused their attention on what is happening to prices in London. But housing is a number of different markets, which have regional variations and different interactions between the owner-occupier, private rented and social rented sectors.

Regional variations in house prices for similar sized properties reflect the imbalances of the economy: it is heavily reliant on financial services, which are concentrated in London, while the public sector makes up a significant share of many local economies – particularly in the North. Migration from across the UK to overcrowded and expensive areas – such as London and the South-East – have put property prices in those areas even further out of reach for would-be buyers.

To make matters worse, both Labour and Conservative governments have routinely failed to build enough houses. While the current government’s aim to build 300,000 new properties a year by 2020 is welcome, it is simply not enough to meet the backlog in demand – let alone address the fundamental affordability problem.

Where homes are being built, they’re often the wrong types of homes, in the wrong places. Family homes are being built, despite there being some four million under-occupied such properties across the country.

Not that long ago, government was reducing the housing stock in many parts of the North, through the disastrous Housing Market Renewal programme. Houses are currently being sold in smaller cities such as Liverpool and Stoke-on-Trent for just £1. And none of the government’s actions suggest that ministers understand these issues, or are prepared to address them.

House price inflation – and the awful affect it is having on home ownership rates for young people – is part of a wider problem of the global asset bubble. This bubble has seen huge increases in the price of assets – stocks, housing, bonds – in high income countries such as the UK. Successive governments have helped to fuel this through quantitative easing, ultra-cheap money and successive raids on pension funds.

What’s needed to address this asset bubble is a substantive increase in interest rates. But while this may slow the growth in house prices, the sad truth is it will do nothing to make housing more affordable for most young people.

Author: Chris O’Leary, Deputy Director, Policy Evaluation and Research Unit and Senior Lecturer, Manchester Metropolitan University

Open banking – the invisible reform that will shake up UK financial services

From The Conversation.

Open banking launched on January 13 in the UK. It requires major banks to share data with third party financial providers. This will bring a new level of transparency and encourage competition, shaking up the financial services industry and levelling the playing field for new challengers to take on the more established high street banks.

The reforms follow a 2016 investigation by the Competition and Markets Authority into retail banking. Its report concluded that the existence of barriers to entry for smaller and newer banks made the banking market less competitive.

This paved the way for open banking, which requires banks to securely share customers’ financial data with other financial institutions – provided customers give their permission. This should boost the range of products and deals made available to people and facilitate more switching, with offers better tailored to individuals, based on their past spending habits.

It will also enable people to bring together their financial information from different providers so they can, for example, open one app and see a list of their accounts with other banks.

All in all open banking is set to change the financial services industry in several ways.

Better banking options

The launch of open banking will be a turning point for large retail banks in the UK. The traditional retail banking business model will be transformed from a closed one to a modern, open source one.

The basis is a united financial platform that has been designed to provide users with a network of their financial data. This will disrupt the existing advantages that big banks in the UK have where they have a monopoly on customers’ data, not making it easy for customers to see the alternatives that are out there.

With more access to customers’ data, new financial technology (fintech) start ups, which are able to provide innovative solutions and modern financial products, will develop and challenge the traditional industry. Meanwhile, the increased competition and narrower profit margins will force existing big banks to adopt new technologies, improve their customer services and open up new revenue streams to keep up.

Better payment systems

Open banking will enable financial institutions to launch easy, fast and innovative global payment methods. Linked with the EU’s Second Payment Services Directive, which also comes into force this year, open banking also aims to boost competition in payment methods, which has been in need of a modernisation in the digital era.

The open access to people’s financial data means that new payment services can be developed. New providers will be able to initiate online payments (whether to friends, retailers, charities) directly from the payer’s bank account, avoiding the use of intermediaries like banks. Paying bills and transferring money will become as easy as sending a message.

As well as the emergence of new services that are more efficient, they should also be secure. Key to the new open banking standards is enhancing financial safety. Third party financial services providers will be required to obtain licenses and to meet the rules set by the main UK bank regulator, the Financial Conduct Authority.

Collaboration between banks and fintech

Open banking will digitise UK banking and strengthen UK fintech. Under the new regulation, fintech firms will play a more important role in the financial services industry and a huge number of fintech startups will enter into competition with existing major banks.

In a world of digital financial systems, big banks will have to rethink their position. Until now, collaboration between banks and fintech firms has mostly involved the financing of acquisition of fintech firms by big banks or partnership agreements, which enable a bank to use or acquire a digital solution developed by the fintech company.

Collaboration needs to become more customer focused – providing people with better products and solutions. Plus, a successful strategy for banks lies in greater cooperation with fintech firms to improve their own, often older technology to help them lower costs and improve customer experience, as well as developing new income streams so they can compete in the long term.

There are still unanswered questions about how open banking will play out. Security and privacy is fundamental to its successful implementation. Nonetheless, it is a revolutionary experiment aimed at boosting retail banking competition and will help new challengers in the financial services space to grow.

Authors: Ru Xie, Senior Lecturer in Finance, University of Bath;
Philip Molyneux, Professor of Banking and Finance, University of Sharjah

The UK’s “Open Banking” Initiative Went Live Last Saturday

Open Banking, where customers can elect to share their banking transaction information with third parties went live in the UK.

This initiative is designed to lift completion across financial services, and of course in Australia, there are early moves in this direction, though the shape of those here are not yet clear. An issues paper from August 2017 outlines the questions being considered by the Australian Review into Open Banking.

What data should be shared, and between whom?

How should data be shared?

How to ensure shared data is kept secure and privacy is respected?

What regulatory framework is needed to give effect to and administer the regime?

Implementation – timelines, roadmap, costs


The report was due to report end 2017.  So the UK experience is useful.

In essence, consumers (if they choose to) are able to give access to the data on their bank accounts to selected third parties, which allows them potentially to offer new and differentiated banking and financial services products.  In practice, whilst some firms rely on simple (and risky) “screen scraping” the idea is that banks will provide a standard application programme interface (API) to allow selected third parties to access agreed data.  Screen scraping is based on sharing the standard internet banking password and credentials, whilst API’s are more selective, using special passwords, which can time-limit access. This is more secure.

In addition, customers give access by logging on to their bank account, and establishing the data share from there, so again is more secure. Also, in the UK, firms wanting to access the data must be registered, and will be listed on an FCA directory. This is to avoid fraud. In addition, there is some protection for consumers if validly shared credential are misused, unlike the current state of play, where if banking passwords are shared, banks may avoid liability.

It is too soon to know whether this is truly a banking revolution, or something more incremental, but in the light of the emerging Fintech wave, we think the opportunities could be large, and the impact disruptive.

For example, Moody’s says the UK’s Open Banking initiative is credit positive for consumer securitisations.

By directly accessing current accounts, the lenders will gain valuable data about its customers’ disposable income and spending patterns. This data will complement the less detailed data that credit reference agencies provide and will result in stronger underwriting and better risk-adjusted returns when prudently applied.

The improved access to information also will benefit the debt collection process. Data on disposable income provides a realistic picture of a consumer’s debt repayment patterns. A clearer picture of consumers’ repayment patterns increases the probability of successful debt collection while ensuring compliance with the UK’s Financial Conduct Authority’s guidelines on fair treatment of customers.

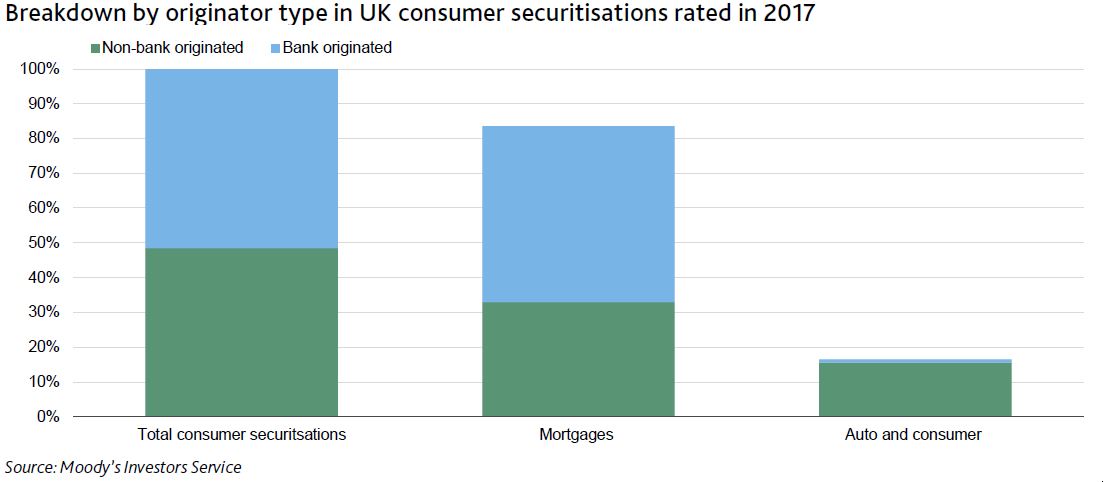
Of the approximately £32 billion of UK consumer securitisations that we publicly rated in 2017, around half were backed by pools solely originated by non-banks. The exhibit below shows that auto and consumer pools, which will benefit most from improved underwriting, are almost entirely originated by non-banks lenders. We include auto-captive bank lenders in the non-bank category since they do not have a material current account presence.

The nine banks with the largest current accounts market share in the UK that will be obliged to share their data are Allied Irish Banks, Bank of Ireland (UK), Barclays Bank , Danske Bank, HSBC Bank, Lloyds Bank, Nationwide Building Society, The Royal Bank of Scotland and Santander UK plc. Four of the nine banks have been granted an extension of six weeks and the Bank of Ireland has until September to meet the technical requirements.

There is an initial six weeks trial during which only bank staff and third parties will be able to test new services.

Moody’s also notes that “the Open Banking requirements coincide with the European Union’s (EU) Second Payment Services Directive (PSD2), which requires all payment account providers across the EU to provide third-party access. For as long as the UK remains part of the EU, it will need to comply with the EU’s legal framework. However, the regulatory technical standards on customer authentication and secure communication under PSD2 have yet to be agreed, meaning that full data sharing under PSD2 likely will be applied no earlier than third-quarter 2019”.

Who’s driving UK consumer credit growth?

From Bank Underground.

Consumer credit growth has raised concern in some quarters. This type of borrowing – which covers mainstream products such as credit cards, motor finance, personal loans and less mainstream ones such as rent-to-own agreements – has been growing at a rapid 10% a year. What’s been driving this credit growth, and how worried should policymakers be?

For many years regulators have relied on aggregated data from larger lenders to monitor which lenders and products are driving credit growth. These data are useful. But they also have important gaps. For example, they don’t include less-mainstream products that people with low incomes often rely on.

Crucially, such data do not show who is borrowing, or people’s overall debts across different lenders and products. This matters. If people borrow on many products, problems repaying one debt could rapidly spill over to others. Consumer surveys can offer some insights here. But surveys often have limited product coverage, are only available with a lag, and may suffer from misreporting.

To build a better, fuller picture of borrowing, the FCA requested credit reference agency (CRA) data for one in ten UK consumers. CRAs hold monthly data on most types of borrowing – including consumer credit, mortgages, and utilities. These data are really rich, going back six years, and can be studied at many different levels. For example, it is possible to scrutinise individual borrowing across products, or to focus on particular lenders or types of products.

We examined these data to assess possible risks from recent credit growth. This article summarises three particular insights which have emerged from this work:

  1. Credit growth has not been driven by subprime borrowers;
  2. People without mortgages have mainly driven credit growth;
  3. Consumers remain indebted for longer than product-level data implies.

Insight 1: Credit growth has not been driven by subprime borrowers

CRA data enables us to examine the distribution of credit scores among groups of borrowers. This is valuable because credit scores are excellent predictors of which types of borrowers are most likely to default or have high risks of suffering broader financial distress. A lower credit score indicates a greater risk of a person being unable to repay their debt. Those with very low credit scores are often referred to as ‘subprime’ borrowers.

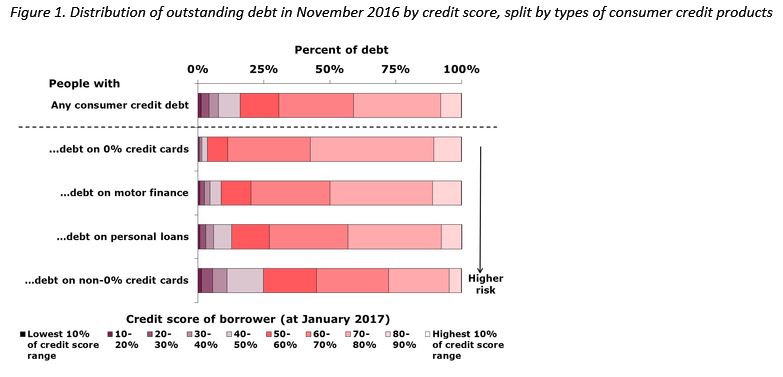
In Figure 1 we show the share of outstanding consumer credit debt (net of repayments) by people’s credit scores. We divide the range of credit scores into ten buckets – the lowest bucket contains people with scores in the bottom tenth of the range (the riskiest borrowers).

Doing so reveals that a small proportion of all consumer credit debt is held by subprime consumers. There are some important differences when we compare people holding different credit products. Borrowing on credit cards with 0% offers and motor finance is concentrated among people with the highest scores. This contrasts with people borrowing on interest-bearing (non-0%) credit cards who more commonly have low scores.

Given motor finance and 0% credit cards have accounted for a majority of consumer credit growth since 2012, this suggests much of the growth is going to the borrowers least likely to suffer financial distress. This story is consistent with high-cost credit markets used by subprime borrowers not rapidly expanding – on the contrary, some are contracting.

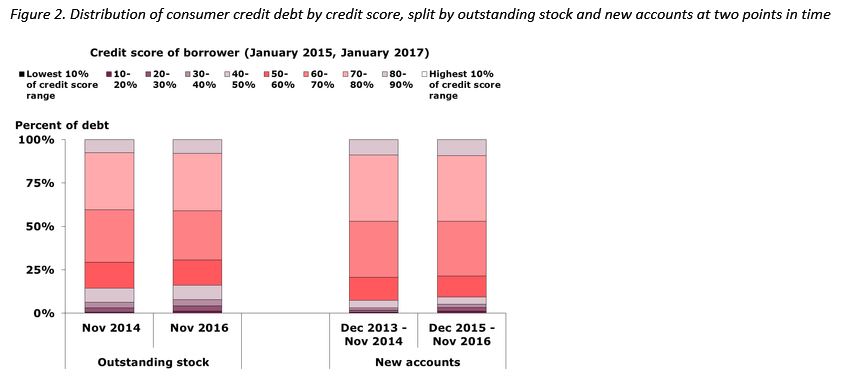
In Figure 2, we turn to how the distribution of borrowing has changed over time. Here we find little difference in credit scores over the recent period of rapid credit growth. This holds when looking at both the outstanding stock and the flow of new borrowing. At face value, this indicates that lenders have not dramatically relaxed their lending standards. But observing a similar credit score distribution when the macroeconomic environment has slightly improved may be better interpreted as a deterioration. The only product where we find an increased concentration of subprime borrowing is interest-bearing credit cards.

History also offers some caution on the relative importance of subprime lending. Recent research on the US mortgage crisis found the pre-crisis growth of subprime borrowing was less dramatic and important to explaining the crisis than earlier studies implied.

Insight 2: People without mortgages have mainly driven credit growth

The recent credit growth has followed a tightening of mortgage lending requirements. Did this tightening have the unintended side-effect of turning mortgage borrowers away from extracting home equity and instead towards consumer credit?

We assess the interaction between these two markets by splitting the growth and stock in borrowing between mortgagors and non-mortgagors. This is shown in Figure 3. About half of outstanding consumer credit is held by those with mortgages. However, this group accounts for a minority of growth in credit balances, with 60% of the growth in credit balances coming from non-mortgagors.

It is comforting that mortgagors do not appear to be bypassing tighter mortgage regulation by amassing consumer credit debt. But a key question going forward is how much of the growth is coming from renters and how much from outright owners.

We know that renters tend to spend a higher share of their income on housing than mortgagors, and so may have less income available for debt repayments. Rapid increases in indebtedness among renters could therefore be a vulnerability.

It is also possible that outright owners are taking out credit, even if they don’t need it. Survey data suggest around 40% of households with consumer credit debt hold savings in excess of such debt. If driven by outright owners, rapid credit growth among non-mortgagors may be less worrying.

Insight 3: Consumers remain indebted for longer than product-level data implies

The Bank has previously argued that lenders’ consumer credit portfolios turn over relatively quickly, reflecting the short terms of consumer credit products (relative to mortgages). In theory, this rapid turnover means that the prudential risks from outstanding consumer credit could quickly increase (or decrease) if lending standards were to deteriorate (or improve).

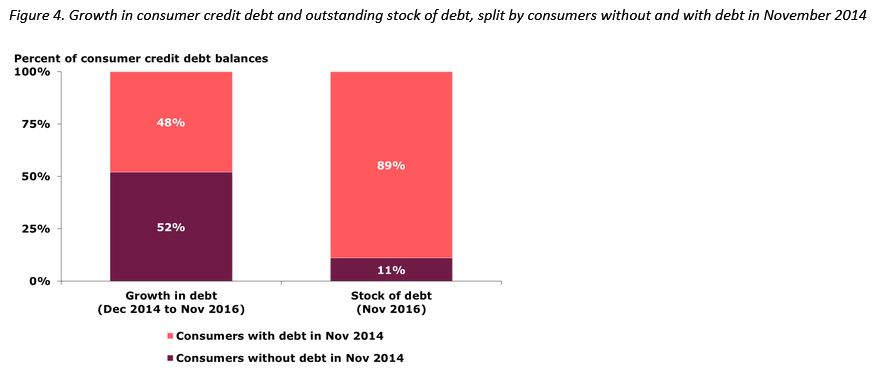
While this may hold from a lender perspective, our analysis tells a different story from consumers’ perspective. We find that although a consumer may clear their debt on one credit product, it is not uncommon for them to remain in debt as they transfer balances, take out new credit products or draw down on existing credit lines (such as credit cards). As shown in Figure 4, 89% of the total outstanding stock of debt in November 2016 was held by people who also owed debt two years earlier. While approximately half of new borrowing is due to ‘new’ borrowers, these people are typically only able to access relatively small amounts of credit and therefore account for a small proportion of the overall stock of debt.

An implication of these findings is that regulators should not become too relaxed when they observe improvements in specific products at particular lenders. Unless the borrower population significantly changes, it is possible that the risk of consumer harm will simply be shifting from one part of the market to another rather than reducing. It is therefore important to regularly examine the financial health of people and their debts holistically using CRA (or similar) data.

Should policymakers be worried?

Credit growth not being disproportionately driven by subprime borrowers is reassuring. As is the lack of evidence that mortgage lending restrictions are pushing mortgagors towards taking on consumer credit.

But vulnerabilities remain. Consumers remain indebted for longer than previously thought. And renters with squeezed finances may be an increasingly important (and vulnerable) driver of growth in consumer credit.

Bank Underground is a blog for Bank of England staff to share views that challenge – or support – prevailing policy orthodoxies. The views expressed here are those of the authors, and are not necessarily those of the Bank of England, or its policy committees.

How Does Uncertainty Affect How UK Firms Invest?

From the Bank Underground Blog.

Uncertainty is in the spotlight again. And the MPC believe it is an important factor influencing the slowdown in domestic demand (August 2017 Inflation Report). Previous work by Haddow et al. (2013) has found a composite aggregate indicator of uncertainty combining several different variables that does appear to have explanatory power for GDP growth; but as Kristin Forbes notes these measures correlate better with consumption than investment. So in this blog post, we look at firm-level data to explore measures of uncertainty that matter for how firms invest in the United Kingdom. Our aggregate measure of uncertainty has a better forecast performance for investment than the composite aggregate indicator does.

Uncertainty is difficult to define, and since it is unobservable, it is hard to measure. It is correlated with other factors that drive an economy but it is unclear whether movements in uncertainty simply reflect the influence of those factors or indicate an independent change in uncertainty (see, for example, Bloom (2014)). This makes it challenging to distinguish its direct effect on the economy. Various approaches have been adopted in recent literature both to measure it and to capture its effects on macroeconomic variables, like GDP, consumption and investment. Jurado et al. (2015) have emphasised certain desirable features of uncertainty measures. First, these measures should be forward-looking since we are interested in uncertain events in the future. Second, they should measure variation in future outcomes (i.e., the width of the probability distribution) rather than specific future outcomes (like a mean or a median). And third, they should not include a component that can be systematically forecast in advance; we are not typically uncertain about outcomes that we can forecast!

One potentially useful measure of uncertainty is based on UK firms’ stock price volatility, inspired by a similar measure introduced for US firms by Gilchrist et al. (2014). The intuition behind the stock market uncertainty (SVU) measure is that we would expect those firms facing a more uncertain environment to have a more volatile stock price. This is because investors are less certain about the value of the company and hence the value of the shares they hold in the company. We use this measure to construct an estimate of UK firms’ uncertainty that has all three of the desirable features mentioned above.

To calculate the SVU measure we use a sample of 622 firms listed on the stock exchange in the UK. To do this, we first estimate the daily variation in individual stock prices that cannot be explained by general market variation in a capital asset pricing model (CAPM) (see, for example, Sharpe (1964)). Then, we calculate the quarterly firm-specific standard deviation of the daily unexplained returns from the first step. The outcome is a firm-specific and time-varying SVU measure. Finally, we estimate a common component of these measures over time, which we interpret as an aggregate-level measure of the SVU.

Because the SVU measure already reflects the expected variation in the stock price based on general market variation in the first step, this measure picks up the unforecastable variation in the price. That helps achieve the desirable features of uncertainty measures discussed above; it is forward-looking (stock prices should include information about future prospects of a firm), it measures variation rather than means or medians, and it makes an attempt to exclude the forecastable component of uncertainty.

Chart 1 shows what the resulting aggregate SVU measure looks like. It also shows how it compares across large firms (over 250 employees) and small and medium-size firms (about 20% of firms in our sample).

The aggregate uncertainty measure is fairly volatile, and there is a large spike during the financial crisis. The SVU measure for small and medium-size firms is even more volatile than for larger firms, probably reflecting the more uncertain environment facing smaller firms. When compared to the Haddow et al. uncertainty indicator, the measures generally move in the same direction. More recently, both increased in anticipation of the EU Referendum, but after it, the SVU measure fell while the Haddow et al. indicator remained elevated (Chart 1).

Chart 1: Different measures of uncertainty

So, what might be the effect of uncertainty on investment? Chart 2 shows that firms which experienced higher uncertainty during the crisis, on average, have subsequently tended to report lower investment (in other words, the distribution for these firms is, on average, more to the left than for the other group of firms). This is in contrast to firms which experienced less uncertainty during the crisis, on average, and have tended to invest more since the crisis. The difference between two groups of firms is statistically significant and suggests that investment dynamics might be negatively affected by uncertainty.

Chart 2: Distributions of firm-level investment-to-capital ratios split by increases in uncertainty during the financial crisis
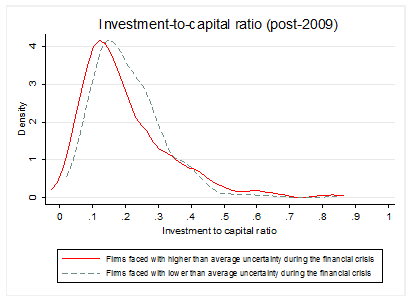
The chart shows sample distributions for investment-capital ratios since 2009 by the size of an increase in uncertainty during the financial crisis.

But Chart 2 is only suggestive. It does not prove any form of causality. To get a better idea of how uncertainty might actually affect investment, we model investment at the level of the firm. We also control for other relevant drivers of investment, as well as variation in investment across time and across firms. More specifically, we regress firm-level investment-to-capital ratios on variables like firm-specific sales, a proxy for future investment opportunities, and different measures of the cost of capital. We find that firm-specific SVU is a very significant explanatory variable for firms’ investment rates in all specifications of the model that we tried, as well as when we include different measures of the cost capital and firm-specific risk premia. We also find that the SVU measure has only been important, in a statistical sense, after the financial crisis.

Given there is evidence that firms’ investment behaviour is correlated with our measure of uncertainty, we can use that insight to study aggregate business investment in the UK. We model uncertainty in a multivariable time series model that also includes other relevant aggregate level variables (GDP, interest rates and inflation). In this framework, an increase in uncertainty produces a relatively persistent effect on investment (Chart 3). This effect peaks after one year and then gradually dies out over the next two years. And a model with our SVU measure forecasts business investment dynamics better over the past than a model with the Haddow et al. uncertainty measure (Chart 4).

Overall, there is evidence that our measure of firm-specific uncertainty can help explain investment behaviour both at the level of the firm and in aggregate. Whereas the work by Haddow et al. suggested that the uncertainty is an important driver of GDP fluctuations, our work provides complementary analysis, using a different measure of uncertainty, to suggest that uncertainty is a crucial factor in firms’ investment decisions.

Chart 3: Impulse response of business investment to an uncertainty shock
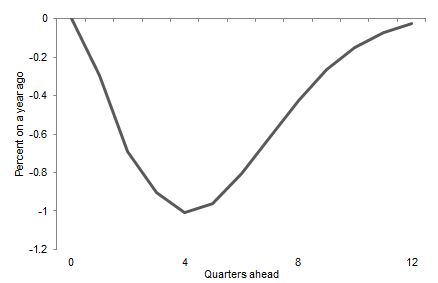
The chart shows percentage changes to a one-standard deviation shock to the uncertainty variable. The impulse response has been identified with a Choleski ordering of the variables (see here for more detailed definitions), where investment reacts with a lag to exogenous shocks in the other variables.

Chart 4: Relative forecast performance of different uncertainty measures on business investment
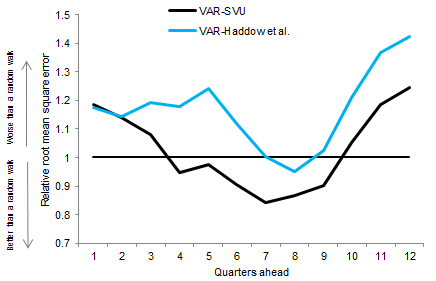
The chart shows the root-mean square error (RMSE) relative to a random walk forecast for annual changes in business investment at different forecast horizons, where random walk = 1. The lower the RMSE, the better the forecast.

Marko Melolinna works in the Bank’s Structural Economic Analysis Division and Srdan Tatomir works in the Bank’s Macro Financial Analysis Division.

Note: Bank Underground is a blog for Bank of England staff to share views that challenge – or support – prevailing policy orthodoxies. The views expressed here are those of the authors, and are not necessarily those of the Bank of England, or its policy committees.

UK Bank Rate maintained at 0.50%

The Bank of England’s Monetary Policy Committee (MPC) sets monetary policy to meet the 2% inflation target, and in a way that helps to sustain growth and employment. At its meeting ending on 13 December 2017, the MPC voted unanimously to maintain Bank Rate at 0.5%.

The Committee voted unanimously to maintain the stock of sterling non-financial investment-grade corporate bond purchases, financed by the issuance of central bank reserves, at £10 billion. The Committee also voted unanimously to maintain the stock of UK government bond purchases, financed by the issuance of central bank reserves, at £435 billion.

In the MPC’s most recent economic projections, set out in the November Inflation Report, GDP grew modestly over the next few years, at a pace just above its reduced rate of potential. Consumption growth remained sluggish in the near term before rising, in line with household incomes. Net trade was bolstered by the strong global expansion and the past depreciation of sterling. Business investment, while affected by uncertainties around Brexit, was projected to continue to grow at a modest pace, supported by strong global demand, high rates of profitability, the low cost of capital and limited spare capacity.

Unemployment was expected to remain low throughout the three-year forecast period, and domestic inflationary pressures were projected to pick up gradually as remaining spare capacity was absorbed and wage growth recovered. Nevertheless, reflecting the diminishing effect of sterling’s depreciation, CPI inflation was forecast to decline from around 3% to approach the 2% target by the end of the three-year forecast period.

The recent news in the macroeconomic data has been mixed and relatively limited. Global growth has remained strong. Domestically, some activity indicators suggest GDP growth in Q4 might be slightly softer than in Q3. The measures announced in the Autumn Budget will lessen the drag on aggregate demand stemming from fiscal consolidation, relative to previous plans. The labour market remains tight, and surveys suggest this will continue. Although it is too early to arrive at a comprehensive view of the effect of November’s rise in Bank Rate on the economy, the impact on interest rates faced by households and firms has been consistent with previous experience.

CPI inflation was 3.1% in November. It remains the case that inflation has been pushed above the target by the boost to import prices that resulted from the past depreciation of sterling. The MPC judges that inflation is likely to be close to its peak, and will decline towards the 2% target in the medium term. In line with the procedure set out in the MPC’s remit, the Governor will be writing an open letter to the Chancellor of the Exchequer, accounting for the overshoot relative to the target and explaining the MPC’s policy strategy to return inflation sustainably to the target. This letter will be published alongside the minutes of the February 2018 MPC meeting and the accompanying Inflation Report.

Developments regarding the United Kingdom’s withdrawal from the European Union – and in particular the reaction of households, businesses and asset prices to them – remain the most significant influence on, and source of uncertainty about, the economic outlook. The Committee noted the progress in the Article 50 negotiations between the United Kingdom and the European Union. In such exceptional circumstances, the MPC’s remit specifies that the Committee must balance any trade-off between the speed at which it intends to return inflation sustainably to the target and the support that monetary policy provides to jobs and activity.

The steady erosion of slack over the past year or so has reduced the degree to which it is appropriate for the MPC to accommodate an extended period of inflation above the target. Consequently, at its previous meeting, the MPC judged it appropriate to tighten modestly the stance of monetary policy in order to return inflation sustainably to the target, while continuing to provide significant support to jobs and activity. At this meeting, the Committee voted unanimously to maintain the current monetary stance. The Committee remains of the view that, were the economy to follow the path expected in the November Inflation Report, further modest increases in Bank Rate would be warranted over the next few years, in order to return inflation sustainably to the target. Any future increases in Bank Rate are expected to be at a gradual pace and to a limited extent. The Committee will monitor closely the incoming evidence on the evolving economic outlook, including the impact of last month’s increase in Bank Rate, and stands ready to respond to developments as they unfold to ensure a sustainable return of inflation to the 2% target.

Using Credit Card Payments Data For The Public Good

Interesting post from the UK’s Office for National Statistics blog, which highlights the power of data analytics using anonymised  credit card payments data.

The intelligent use of data gathered by our leading financial institutions can result in faster, more detailed economic statistics.  Tom Smith describes how a joint event staged by ONS and Barclaycard illustrates the vast statistical potential of  anonymised  payments data.

“My job at the Data Science Campus brings many fascinating days as we work with organisations across government and the UK to unlock the power of data. One recent event particularly stands out.

Our experts from across ONS joined forces with analysts from one of the world’s biggest financial organisations to explore how commercial payments data could help tackle some of the UK’s biggest economic questions.

Following a successful knowledge sharing day at the ONS Data Science Campus, Barclaycard, which sees nearly half of the nation’s debit and credit card transactions, hosted a ‘hackathon’ at the state-of-the-art fintech innovation centre Rise. This brought together 50 economists, developers, data scientists and analysts to address three challenges:

  • How could payments data improve our understanding of regional economies?
  • Where could financial inclusion policies best be targeted?
  • How could we use payments data to create superfast economic indicators?

Over two days, the ONS and Barclaycard teams worked collaboratively – in some cases right through the night – to identify how the payments data could be used to improve our understanding of the economy. The traditional hackathon finish saw the teams ‘pitching’ their work to a panel of judges from across ONS and Barclaycard.

The winning team focused on building predictors and indicators that provide fine-detail information for trending economic changes. Even at this early stage of development, their work shows how bringing together card spending data and economic data held by ONS could improve the information available for policy & strategy decision makers to make timely economic decisions.

There is much work to be done to turn this demonstration into a working model. But one of the things that stood-out for the judges was the winning team’s roadmap for how to get there, including the development and data architecture needed for a successful prototype.

“We’re really excited to play a key role in helping to support a better understanding of UK economic trends and growth. The hackathon was a great event to harness the excitement and expertise created through our partnership with the ONS, and the winning teams have shown tangible evidence that payments data can indeed be used for public good.” – Jon Hussey, MD Data & Strategic Analytics, Barclaycard International

For the Data Science Campus, collaborations are all about knowledge exchange. They are an opportunity for us to access expertise in tools, technologies and approaches to data science from outside government, evaluate them in a safe environment, and share our learning across ONS and wider government.

It was inspiring to see the level of energy, drive and collaboration, and to pool ONS and Barclaycard skills into understanding how payments data can be used for public good. (And it is worth pointing out that no money changed hands and no personal data were involved. ONS is only interested in producing aggregate statistics and analysis.)

Our work with Barclaycard illustrates perfectly how the rich data held by partners outside government can improve our understanding of the UK’s economy. This is a key part of ONS’ Better Statistics, Better Decisions strategy, enabling ONS to deliver high quality statistics, develop and implement innovative methods, and build data science capability by tapping in to best practices wherever they may be.

UK Property Investors Head For The Exit

The UK Property Investment Market could be a leading indicator of what is ahead for our market. But in the UK just 15% of all mortgages are for investment purposes (Buy-to-let), compared with ~35% in Australia.  Yet, in a down turn, the Bank of England says investment property owners are four times more likely to default than owner occupied owners when prices slide and they are more likely to hold interest only loans. Sounds familiar?

According to a report in The Economist,  “one in every 30 adults—and one in four MPs—is a landlord; rent from buy-to-let properties is estimated at up to £65bn ($87bn) a year. But yields on rental properties are falling and government policy has made life tougher for landlords. The age of the amateur landlord may be”.

Investing in the housing market has seemed like a one-way bet, with prices trending upwards in real terms for four decades, mainly because government after government has failed to loosen planning restrictions on building new houses. Now, however, there are signs that regulatory changes have begun to send the buy-to-let boom into reverse.

Yields on rental properties have fallen. House prices have risen faster than rents, in part because buy-to-letters have reduced the supply of housing available to prospective owner-occupiers while simultaneously increasing the supply of places to rent. Britain’s ratio of house prices to rents is now 50% above its long-run average. All this makes buy-to-let investment less lucrative. Data from the Bank of England suggest that yields in September were below 5%, their joint-lowest rate since records began in 2001, when they were above 7.5%.

One consequence of this could be a more stable financial system. Roughly 15% of mortgage debt is on buy-to-let properties. The Bank of England has warned that there are risks associated with this. One problem is that property investors buy when house prices are rising but sell when they are falling, making house prices more volatile. Buy-to-let landlords are also more likely to default than owner-occupiers. One reason is that doing so does not force them out of their home. Another is that buy-to-let mortgages are more likely to be interest-only (ie, where the principal is not repaid). That can be tax-efficient but it means that monthly repayments can jump sharply if interest rates rise. The Bank of England’s stress tests last month showed that the rate at which landlords’ loans turn sour could be four times greater than the rate for owner-occupiers’ loans. All things considered, the shrinking of the buy-to-let sector may come as a relief to regulators.

The future for buy-to-letters will not get much brighter. In January a tweak to the rules on capital-gains tax will increase the liabilities of landlords who register as businesses. Large institutional investors are moving on to buy-to-letters’ turf, hoping to benefit from their economies of scale to offer better-quality housing to tenants. It was good while it lasted, but the golden age for the amateur landlord may be over.