Why Do Companies Behave Badly?

ACCC Chair Rod Sims delivered the Giblin Lecture in Tasmania, and shared his observations on company behaviour that drives breaches of Australia’s competition and consumer laws. The speech is excellent and worth reading as it gets to the heart of why so many companies are behaving poorly, and on an ongoing basis. Many, he says, puts immediate profit ahead of their customers.

He walk through a whole series of bad company behaviour, and recounted the famous Adam Smith quote:

It is not from the benevolence of the butcher, the brewer, or the baker that we expect our dinner, but from their regard to their own interest.

“Few companies behave badly often, but rather many engage in occasional significant instances of bad behaviour, which remains unacceptable.”

“It is often said that companies succeed by looking after the needs of their customers. I have been surprised over very many years, however, at the way in which many businesses often do precisely the opposite.”

“Companies appear to put immediate profit ahead of their customers either by engaging in misleading or unfair conduct, or even unconscionable conduct towards their customers, or they engage in cartel or other anti-competitive activity that raises prices for their customers.“

“Too many large companies continue to mislead their customers, or treat them unconscionably. And it is not just customers who are subjected to bad behaviour from big companies. More recently, the ACCC has been taking action over unfair contract terms imposed on small businesses.”

“On the competition side we have seen a range of cartel behaviours; where competitors agree to raise prices directly or restrict supply to achieve the same result, all of which hurts their own customers.”

“There is clearly no shortage of work for the ACCC. Many well-known and respected major Australian companies have admitted, or been found, to have breached our competition and consumer laws. These same companies regularly proclaim to put their customers first.”

“Being the best at meeting the needs of consumers is not the only, or even the dominant, way firms succeed. Staying ahead of rivals through continual improvement is a difficult task for most companies; eventually someone works out how to do things better and cheaper.”

“In some cases, company executives push the boundaries to achieve short-term growth targets. Some appear to ignore the risk of reputational damage over the longer term to achieve short-term gains.”

“The strongest constraint on firm behaviour is the risk of losing sales. The larger the number of customers that ‘vote with their feet’ in response to poor behaviour by firms, the more firms will do to avoid engaging in such behaviours.”

“Poor behaviour can interfere with the competitive process and cause a ‘race to the bottom’. We have observed firms winning customers through misrepresenting their offers and employing high pressure selling tactics. In addition to hurting consumers, this type of behaviour hurts rival firms.”

“It often appears as if company executives behave differently when they are at work, than the way they would privately, as if they feel their obligations to their company compels them to pursue profit to the maximum, even if their behaviour pushes too close to the boundaries of the law.”

“The market economy is based on incentives. When the incentives for misconduct are strong, and the penalties for misconduct are comparatively weak, it is easy to understand that company boards and senior management do not act strongly enough to ensure such behaviour does not occur.”

“Accordingly, the ACCC strongly encourages the Parliament to approve changes to the Australian Consumer Law, or ACL, bringing increased penalties for contraventions of the ACL. Increasing penalties for contraventions of the Competition and Consumer Act, and the ACL, has long been a priority focus of the Commission.”

“Just imagine if the penalties we have achieved recently were 10–20 times higher. Then perhaps some companies would not be behaving so badly. And then, when they say they put their customers first, it might have more validity than it does today.”

Banking Profitably Rose In March 2018 Quarter But…

Alongside the property exposures data that we discussed recently, see our post, “The Mortgage Industry in Three Sides“, APRA also related their quarterly data relating to banks in Australia to March 2018.

In summary the total profits were up 9.1% compared with a year ago, total assets grew 3% over the same period, the capital base grew 5.8%, the capital adequacy rose 0.4 percentage points and the liquidity coverage ratio rose 8.3 percentage points.

So superficially, all the ratios suggest a tightly run ship. But it is worth looking in more detail at these statistics, because as we will see below the waterline, things look less pristine.

First, there were 148 Authorised Depository Institutions (ADI’s) a.k.a banks at the end of March.

  • Endeavour Mutual Bank Ltd changed its name from Select Encompass Credit Union Ltd, with effect from 9 February 2018.
  • Gateway Bank Ltd changed its name from Gateway Credit Union Ltd, with effect from 1 March 2018.
  • My Credit Union Limited had its authority to carry on banking business in Australia revoked, with effect from 1 March 2018.

So the net number rose by 1 from December 2017.

In terms of overall performance, APRA says that the net profit after tax for all ADIs was $36.4 billion for the year ending 31 March 2018. This is an increase of $3.0 billion or 9.1 per cent on the year ending 31 March 2017.

This was because of a nice hike in mortgage margins, in reaction to the regulator’s intervention in the investor mortgage sector, and a significant drop in overall provisions. But top line revenue growth slowed and margins have started to tighten. As a result, profits were lower this quarter compared with the prior three quarters.

The cost-to-income ratio for all ADIs was 48.5 per cent for the year ending 31 March 2018, compared to 48.2 per cent for the year ending 31 March 2017. In other words, the costs of the business grew faster than income.

The return on equity for all ADIs increased to 12.3 per cent for the year ending 31 March 2018, compared to 11.7 per cent for the year ending 31 March 2017. We suspect this increase will not be repeated in the coming year.

That said an ROE of 12.3 per cent would still put the banking sector near the top of both Australian companies and global banks, reflecting a lack of true competition and some poor practices as laid bare by the Royal Commission. The quest for profit growth from some players has proved to be at the cost of customers. If banks do become more customer focussed, it is possible ROE’s will fall, and one-off penalties and fees (for example CBA, ANZ) will also hit returns.

The total assets for all ADIs was $4.67 trillion at 31 March 2018. This is an increase of $135.9 billion (3.0 per cent) on 31 March 2017 and was largely driven by mortgages which grew strongly over the period.

The total gross loans and advances for all ADIs was $3.22 trillion as at 31 March 2018. This is an increase of $161.4 billion (5.3 per cent) on 31 March 2017.

The total capital ratio for all ADIs was 14.8 per cent at 31 March 2018 , an increase from 14.4 per cent on 31 March 2017. This is a reflection of higher APRA targets. The common equity tier 1 ratio for all ADIs was 10.7 per cent at 31 March 2018, an increase from 10.3 per cent on 31 March 2017.

The risk-weighted assets (RWA) for all ADIs was $1.99 trillion at 31 March 2018, an increase of $53.9 billion (2.8 per cent) on 31 March 2017.

So if you compare the $3.22 trillion assets with the $1.99 trillion weighted assets for capital purposes, you can see the impact of lower risk weights for some asset types.

Looking at impairments for all ADIs we see that impaired facilities were $11.4 billion as at 31 March 2018. This is a decrease of $2.1 billion (15.7 per cent) on 31 March 2017.

Past due items were $15.4 billion as at 31 March 2018. This is an increase of $1.6 billion (11.5 per cent) on 31 March 2017. Rising 90 day delinquencies for mortgage loans was the main reason for the uplift, despite commercial loans performing a little better. Expect more delinquencies ahead, as indicated by our mortgage stress analysis. See our post “Mortgage Stress On the Rise”

That said, impaired facilities and past due items as a proportion of gross loans and advances was 0.83 per cent at 31 March 2018, a decrease from 0.89 per cent at 31 March 2017 and specific provisions were $5.9 billion at 31 March 2018. This is a decrease of $0.8 billion (11.7 per cent) on 31 March 2017. In addition, specific provisions as a proportion of gross loans and advances was 0.18 per cent at 31 March 2018, a decrease from 0.22 per cent at 31 March 2017.

But there were two really important observations in the data, when we look at just the big four. The first is that total loans and advances by the four majors reached $2.55 trillion dollars, a record, and 63.69% of all loans were for housing lending.  Not since 2012 has this been such a high proportion, its previous peak was 64.48% in the Jun 2011 quarter.  The proportion of investor loans fell slightly, thanks to the recent tightening, but owner occupied lending by the big four remained strong. Think about it, nearly 64% of all loans are property related, so consider what a significant fall in prices would mean for them.

The second observation relates to the critical banking ratios. We all know that APRA has been pushing the capital rations and the newer CET1 (from January 2013) higher, and these are all rising, with the CET1 sitting, on an APRA basis at 10.5%, the highest its been.

However, if you look at the ratio of shareholder capital, it is sitting at a miserly 5.4% of all loans. In other words for every $100 invested in the loans made by an investor, they only have $5.40 at risk. This is, in extremis, the heart of the banking business, and this explains why shareholder returns are so high from the banking sector. These are highly leveraged businesses and if their risk and loan underwriting standards are not correctly calibrated it can go wrong very quickly. By the way the smaller banks and mutual have much lower leverage ratios, so they are simply less risky.

Banking is a risk business, but we see here laid bare, who is really taking the risks while the shareholders are doing very nicely thank-you!


ANZ’s regulatory capital will increase with OnePath Life NZ sale to Cigna

Last Wednesday, Australia and New Zealand Banking Group Limited  announced that it had agreed to sell its New Zealand life insurance business OnePath Life NZ Limited to Cigna Corporation, a global healthcare services organization with an established New Zealand specialist insurance business. The planned sale is credit positive for ANZ because it will lift the group’s Level 2 Common Equity Tier 1 (CET1) ratio by approximately 15 basis points, says Moody’s.

Total consideration for the sale is NZD700 million and the company expects to generate a gain of approximately NZD50 million. As part of the agreement, ANZ will enter a 20-year strategic alliance with Cigna to offer life insurance products through ANZ’s distribution channels. ANZ expects to complete the sale during its 2019 fiscal year, which ends September 2019.

The sale follows ANZ’s announcement in December 2017 that it had agreed to sell its Australian insurance business to Zurich Insurance Company Ltd. (financial strength Aa3 stable) for a total consideration of AUD2.85 billion.

The sale comes as capital requirements for Australian banks are increasing. The Australian Prudential Regulation Authority announced in July that it is increasing the minimum capital requirements for ANZ and domestic peers Commonwealth Bank of Australia, National Australia Bank Limited  and Westpac Banking Corporation to 9.5% by 2021 from 8% currently, including a capital conservation buffer and a domestic systemically important bank charge. Although the higher capital requirements will take effect in early 2021, the regulator said it expects banks to exceed the new requirement by 1 January 2020 at the latest.

ANZ’s sale of OnePath Life NZ, combined with the previously announced sale of its Australian life insurance business and it pension, investments and aligned dealer groups’ business, will boost ANZ’s CET1 ratio by approximately 95 basis points. That includes 65 basis points from the sale and reinsurance of its Australian life insurance business, 15 basis points from the sale of pensions, investments and aligned dealer groups’ business and 15 basis points from the sale of OnePath Life NZ). The transactions will significantly raise ANZ’s CET1 ratio well above the future minimum requirement of 9.5%.

Consequently, we expect that ANZ will continue to return surplus capital to shareholders in line with its announced AUD1.5 billion on-market share buyback. ANZ had completed AUD1.1 billion of share buybacks as of 31 March 2018. The additional capital generated by these business sales may provide capacity for future share buybacks. Despite these capital distributions, ANZ remains highly capitalized, with excess capital above the higher future minimum requirements of AUD 5.7 billion, assuming it completes the full AUD1.5 billion on-market share buyback.

Macquarie reduces stake in Yellow Brick Road

From Investor Daily.

Macquarie has reduced its stake in financial services firm Yellow Brick Road from 18 per cent to 5 per cent.

Yellow Brick Road revealed in a disclosure to the ASX that Macquarie Group had sold more than 4 million shares on 22 May, dropping its holding from 6.6 per cent to 5.15 per cent. The banking group now owns a little over 14.5 million shares in YBR.

Macquarie began offloading its stake in YBR in April, prior to which it owned more than 51 million shares. On 24 April, the banking group decreased its stake from 18.4 per cent to 7.8 per cent; then on 15 May, its holding dropped further to 6.6 per cent.

The equity reduction comes despite YBR turning around years of significant losses into profits. In FY17, it posted a net profit after tax of $1 million, up from a loss of $9.5 million in FY16.

Yellow Brick Road’s underlying EBITDA increased from negative $3.9 million in FY16 to $5.2 million in FY17, and the value of its underlying loan book grew from $37.8 billion in FY16 to $44.1 billion in the last financial year.

As of 30 June 2017, the firm’s underlying funds under management totalled nearly $1.5 billion, more than double the $703 million recorded in the previous corresponding period.

Yellow Brick Road executive chairman Mark Bouris told InvestorDaily sister title Mortgage Business that the firm’s relationship with Macquarie “remains the same and is still as strong as ever”, adding that the reduction in ownership is a result of corporate raider Sir Ron Brierley’s Mercantile Investment Company increasing its stake from 9.1 per cent to 19.9 per cent.

“We aren’t the only company Macquarie Group has reduced its shareholder stake in, and we won’t be the last,” Mr Bouris said.

While there have been no disclosures around a potential takeover by Mercantile, Yellow Brick Road shares are trading at a record low of around 11 cents, taking its market capitalisation to around $31 million.

AMP Q18 Update – Tough Times Ahead

AMP gave a brief updated today on the Q118. They said the cashflows were subdued in Australian wealth management (AWM); but there was continued strength in AMP Capital and AMP Bank. AMP Bank’s total loan book up 2 per cent to A$19.8 billion during the quarter. The portfolio review of manage for value businesses continues.

In response to ASIC industry reports 499 and 515, AMP continues to review adviser conduct, customer fees, the quality of advice, and the monitoring and supervision of its advisers. They anticipate that this review will lead to further customer remediation costs and associated expenses and they will provide a further update at or before the 1H 18 results.

A summary by business segment:

Australian wealth management

  • Net cash outflows of A$200 million in Q1 18 in line with Q1 17. Inflows and outflows in Q1 18 were subdued due to reduced activity in superannuation following 2017 non-concessional contribution cap changes and volatile investment markets in the quarter.
  • AMP’s wrap platform, North, continued to perform strongly with cashflows growing 14 per cent to A$1,181 million in Q1 18.
  • Total Australian wealth management AUM at the end of Q1 18 was A$128.3 billion, down 2 per cent from Q4 17 reflecting negative investment markets during the quarter.
  • AMP’s SMSF business, SuperConcepts, added approximately 5,500 funds across administration and software services during Q1 18, supported by the acquisition of MORE Superannuation. The business now supports more than 64,600 SMSFs.

AMP Capital

  • AMP Capital external net cashflows were A$1.6 billion in Q1 18, an increase from A$228 million in Q1 17, driven by flows into real assets (real estate and infrastructure investments), and strong performance by China Life AMP Asset Management (CLAMP).
  • AUM increased from A$187.7 billion at the end of Q4 17 to A$188.1 billion in Q1 18. AUM now includes AMP Capital’s 24.9 per cent share of US-based real estate investment manager PCCP’s AUM.
  • AMP’s partnership with China Life continues to grow; AMP Capital’s share of CLAMP contributed net cashflows of A$462 million in Q1 18.
  • AMP Capital has A$4.5 billion of committed real asset capital available for investment.

AMP Bank

  • Total loan book grew to A$19.8 billion during Q1 18, up 2 per cent on Q4 17, supported by continued growth in loan books for both aligned adviser and mortgage broker channels.
  • Retail deposit book increased by A$321 million in Q1 18 relative to Q4 17.
    Australian wealth protection
  • Australian wealth protection annual premium in-force (API) was down 1 per cent in Q1 18 to A$1,890 million. The small decline was primarily driven by a 1 per cent fall in API for individual lump sum.

New Zealand financial services

  • AMP New Zealand financial services’ net cashflows were A$54 million in Q1 18, up from A$23 million in Q1 17. The increase was mainly driven by lower cash outflows in retail investments.
  • AMP remains one of New Zealand’s largest KiwiSaver providers with net cashflows of A$47 million in Q1 18.

Australian mature

  • Australian mature net cash outflows in Q1 18 were A$323 million, compared to A$335 million in Q1 17, reflecting the run-off nature of the book. AUM declined 2 per cent to A$20.4 billion during the quarter.

Update on industry and regulatory compliance investigations

  • There are a number of reviews being undertaking by ASIC. These include industry reports 499 and 515 on financial advice. AMP is continuing its program of work to review the nature of ongoing service arrangements between its advisers and customers, and the incidence of inappropriate fees and advice, since 1 July 2008.
  • This program is ongoing, and the outcomes will lead to higher customer remediation costs and related expenses and enhancements to AMP’s control frameworks, governance and systems will be required.

CBA Q3 Trading Update – Pressure At The Coal Face

CBA released their 3Q18 trading update today. They announced an unaudited statutory net profit of approximately $2.30bn, in the quarter and unaudited cash net profit of approximately $2.35bn in the quarter. This is down 9% on an underlying basis compared with 1H18.

We see some signs of rising consumer arrears, and a flat NIM (stark contrast to WBC earlier in the week!).  Expenses were higher due to provisions for regulatory and compliance.

The APRA imposed increase Operational Risk regulatory capital by $1 billion (RWA of $12.5 billion) was effective 30 April 2018 and the pro-forma impact on the CET1 ratio as at 31 March 2018 is a decrease of 27 basis points, to 9.8%.

Underlying operating income decreased by 4%. Excluding the impact of two fewer days in the quarter (approximately $100m), net interest income was broadly flat. Volume growth was offset by a slight decline in Group Net Interest Margin due to customer switching from interest only to principal and interest home loans, as well as higher basis risk. Other banking income was lower driven by lower treasury and trading performance, and seasonally lower card fee income.

Underlying operating expense increased by 3%, driven by increased provisions for regulatory and compliance project spend.

CBA says the credit quality of the Group’s lending portfolios remained sound. Loan Impairment Expense of $261 million in the quarter equated to 14 basis points of Gross Loans and Acceptances, compared to 16 basis points in 1H18.

Consumer arrears were seasonally higher in the quarter.  There has been an uptick in home loan arrears, influenced by a small number of customers experiencing difficulties with rising essential costs and limited income growth.


Troublesome and impaired assets increased to $6.6 billion. A small number of credits drove the increase in troublesome exposures over the quarter, with impaired assets stable.

Prudent levels of credit provisioning were maintained, with Total Provisions at approximately $3.8 billion. Overall collective provisions rose.

Funding and liquidity positions remained strong, with customer deposit funding at 68%

The average tenor of the long term wholesale funding portfolio at 5.1 years. The Group issued $10.2 billion of long term funding in the quarter.

The Net Stable Funding Ratio (NSFR) was 111% at March 2018, up from 110% at December 2017.  The Liquidity Coverage Ratio (LCR) increased to 133% as at March 2018, driven by higher liquid assets (up approximately $5 billion in the quarter to $144 billion13).

The Group’s Leverage Ratio was 5.2% on an APRA basis and 5.9% on an internationally comparable basis, 20 basis points lower than December 2017, primarily reflecting the impact of the 2018 interim dividend.

CET1 (APRA) ratio at 10.1%, up 37 bpts since Dec 17 after allowing for payment of the 2018 interim dividend

After allowing for the impact of the 2018 interim dividend (which included the issuance of shares in respect of the Dividend Reinvestment Plan), CET1 increased 37 basis points in the quarter. This was driven by capital generated from earnings, partially offset by higher Risk Weighted Assets.

Credit Risk Weighted Assets were higher in the quarter (-18 basis points), reflecting a combination of volume and foreign exchange movements, credit quality and regulatory changes.

The final tranche of Colonial debt ($315m) is due to mature in the June 2018 quarter, with an estimated CET1 impact of -7 basis points.

The Group will adopt AASB 9 on 1 July 2018. The impact will be recognised in opening retained earnings. The Group’s estimate of the pro-forma impact of AASB 9 as at 1 January 2018 is an increase in collective provisions of approximately $1,050 million (before tax) and a reduction in the CET1 ratio of approximately 26 basis points. This reflects the revised treatment of the General Reserve for Credit Losses as advised by APRA.

On 1 May 2018, APRA released the findings of the Prudential Inquiry into CBA. APRA requires CBA to increase Operational Risk regulatory capital by $1 billion (RWA of $12.5 billion). This adjustment is effective 30 April 2018, being the date the Group entered into an Enforceable Undertaking with APRA which states that CBA may apply for the removal of the adjustment only on meeting certain conditions. The pro-forma impact on the CET1 ratio as at 31 March 2018 is a decrease of 27 basis points, to 9.8%.

The sale of the Group’s Australian and New Zealand life insurance operations is expected to be completed in the December 2018 half year (subject to regulatory approvals) resulting in an uplift to the CET1 ratio of approximately +70 basis points.


Westpac 1H18 Result Stronger Than Expected

Westpac released their 1H18 results today. It was an interesting counterpoint to recent announcements, with stronger NIM, including from Treasury. They CET1 ratio fell a little, but they are still well placed. There were no signs of particular stress in their mortgage books, and they also were able to lift margin by reducing rates on some deposits, though they did signal higher funding at the moment. They also underscored the migration to digital channels which is well in hand, and customer led.

Statuary profit net profit was $4,198m up 7%, on the prior corresponding period (1H17), and cash earnings was up 6% to $4,251m.

Cash return on equity (ROE) 14.0%, at top end of the 13 – 14% range Westpac is seeking to achieve. The dividend was unchanged at 94 cents per share,

The Federal Government bank levy cost Westpac $186 million pre-tax for the six months. The levy will be paid out of retained earnings and is equivalent to 4 cents per share.

The Net Interest margin was up 7% from the prior period, and a rise in Treasury and Markets income contributed  4 basis points while margins excluding Treasury and Markets increased 3 basis points.

Net interest income increased $665 million or 9% compared to First Half 2017, with total loan growth of 5%, mostly from Australian housing which grew 6%. Reported net interest margin increased 11 basis points to 2.16%, reflecting higher spreads on certain mortgage types (including investor lending and loans with an interest-only feature), and increased deposit spreads. These were partly offset by the Bank Levy which was effective from July 2017.

Non-interest income decreased $281 million or 9% compared to First Half 2017 primarily due to a decrease in trading income of $226 million and the impact of economic hedges on New Zealand earnings ($63 million lower).

Expenses were up 1%, and included $34 million relating to the Royal Commission. They benefited from $131m productivity savings.

Stressed assets to total committed exposure were down 5 basis points over the year, but moved from 1.05% in September to 1.09% in March, up 4 basis points.

Mortgage delinquencies were a little higher, but from a low base.

The CET1 capital ratio was 10.5%, and the liquidity coverage ratio was 134% and the net stable funding ratio 112%.

Westpac’s CET1 capital ratio was 10.50% at 31 March 2018, 6 basis points lower than 30 September 2017.

Looking at the divisional summaries:

Consumer Bank (CB) has continued to be a key driver of the Group’s growth, lifting cash earnings by 6%. Disciplined balance sheet growth, flat operating expenses and a $60 million reduction in impairment charges were the key drivers of performance. Net interest income increased from a 2% rise in mortgages, a 1% increase in deposits and a 1 basis point improvement in margins. Margins benefited from lower funding costs, including improved spreads on term deposits, and prior period loan repricing although this was partly offset by the full period impact of the Bank Levy and from customers switching to lower rate loans. Non-interest income was lower, mostly due to the elimination and reduction of certain transaction and account keeping fees and lower credit card interchange fees. This was partly offset by the non-repeat of customer refunds and payments that occurred in Second Half 2017. Expenses were little changed (up $3 million) as the division continues to transform itself via digital while enhancing service. More customers migrating to digital channels has supported a 4% decrease in branch transactions and a reduction of 21 branches in the last six months. The reduction in impairment charges reflects the lower seasonal unsecured personal lending write-offs.

Looking in more detail at the Australian Mortgage portfolio, we see a reduction in interest only loan flow, and a rise in loans from brokers. They have been growing their relative share of investor loans in terms of flow.

They showed that delinquencies on interest only loans are LOWER than for P&I loans.

Personal loan delinquencies have risen.

Mortgage delinquencies are a little higher with WA significantly above, though it now represents just 9% of the portfolio, compared with system 1t 12%.

Business Bank (BB) delivered a 3% increase in cash earnings. Lending increased 2% with SME business lending up 2%, and commercial lending increasing 2%. Deposits rose 1% over the half, mostly in term deposits. The net interest margin was up 4 basis points, from repricing on certain mortgages in Second Half 2017 and improved term deposit spreads partially offset by the full period impact of the Bank Levy. Non-interest income was up 1% with higher business line fees. Expenses were 1% higher, mostly from higher investment related costs, and regulatory and compliance costs. Credit quality has been sound, although stressed assets to TCE were up 35 basis points, mostly due to commercial customers moving into the watchlist category. Impairment charges decreased $6 million from lower impaired downgrades in the commercial portfolio.

BT Financial Group (Australia) lifted cash earnings 13% with higher funds, an increase in life insurance premiums and a stronger contribution from Private Wealth. Growth was also supported by provisions for customer refunds and payments raised in the Second Half 2017 that were not repeated. Partially offsetting these gains were lower advice income and seasonally higher general insurance claims. Superannuation balances and platform funds were both up 3% while packaged funds increased 4%. Growth was supported by stronger investment markets and $2.6 billion of net flows onto Panorama. Fund margins were lower including from the migration of customers into MySuper accounts which has now been completed. Expenses were well managed, down 1%. The decline was consistent with normal seasonal patterns (higher costs are incurred around the end of the June financial year) and continued productivity gains. Investment spending was a little higher including from the launch of the new super product, “BT Super Invest”. Regulatory and compliance costs were little changed but remain elevated.

Westpac Institutional Bank (WIB) delivered a 4% lift in cash earnings to $551 million. The $21 million rise was due to a 1% rise in core earnings and a $9 million benefit from impairment charges. Supporting core earnings, lending increased by 3% and deposits were 7% higher while markets related income also increased. These gains were partially offset by lower net interest margins and a reduction in Hastings fees. While investing more, particularly in payments, expenses were lower from the full period impact of productivity initiatives. Continuing good credit quality and the workout of further impaired assets led to another impairment benefit in First Half 2018.

Westpac New Zealand delivered cash earnings of NZ$482 million, down 5%, compared to the prior half. The business generated 3% core earnings growth although this was more than offset by a small impairment charge which followed a NZ$40 million impairment benefit in the Second Half 2017. A 3% lift in net interest income was the main driver of core earnings growth with lending up 2%, deposits rising 5% and margins increasing 6 basis points. The rise in margins followed some repricing of mortgage and business lending and improved deposit spreads. Expenses were 1% lower as the benefits from the division’s transformation program flowed through. The program has led to a reduction in the size of the branch network and increased self-serve via digital channels. Impairment charges increased NZ$67 million over the half, as Second Half 2017 benefited from the improvement in the dairy industry and from the increase in consumer delinquencies in First Half 2018.

The Group Businesses delivered cash earnings of $58 million in First Half 2018, up $50 million on the prior half. The increase was due to a higher Treasury contribution (from interest rate risk management) partially offset by higher expenses and an increased impairment charge. Higher expenses were mainly due to increased investment and a rise in regulatory and compliance costs, including expenses associated with the Royal Commission and higher employee costs. The impairment charge in Group Businesses was mostly related to movements in centrally held impairment overlays. The impairment charge was $13 million in First Half 2018 compared to a $32 million benefit in Second Half 2017 – a $45 million turnaround.

They made specific comments on the need to restore their reputation.

The First Half 2018 has continued to see the industry (including Westpac) under intense scrutiny including from the Royal Commission into Financial Services.

Restoring the Group’s reputation has remained a focus and the Group has continued to implement a number of programs aimed at improving trust. In particular, Westpac has largely completed the implementation of the Australian Banking Association’s “Six point plan” with the Group waiting for finalisation of the industry Code of Banking Practice to complete implementation. In 2017 the Group also commenced a broader program to reduce complexity and resolve prior issues that have the potential to impact customers and the Group’s reputation. These reviews have identified some previous instances where the Group has not met industry or community standards and Westpac is taking action to put things right so that customers are not at a disadvantage from past practices. Work on this program over the last 12 months included:

  • Progressing the review of products to reassess their features and how the Group had engaged with customers. As part of these reviews, 150 changes were made including more than halving the number of consumer products on offer;
  • Cutting transaction fees for 1.3 million customers, removing ATM fees, and introducing a new low rate credit card; and
  • Continuing remediation of previous issues, paying out $39 million to customers from our 2017 provision for customer refunds and payments.

Macquarie Does It Again

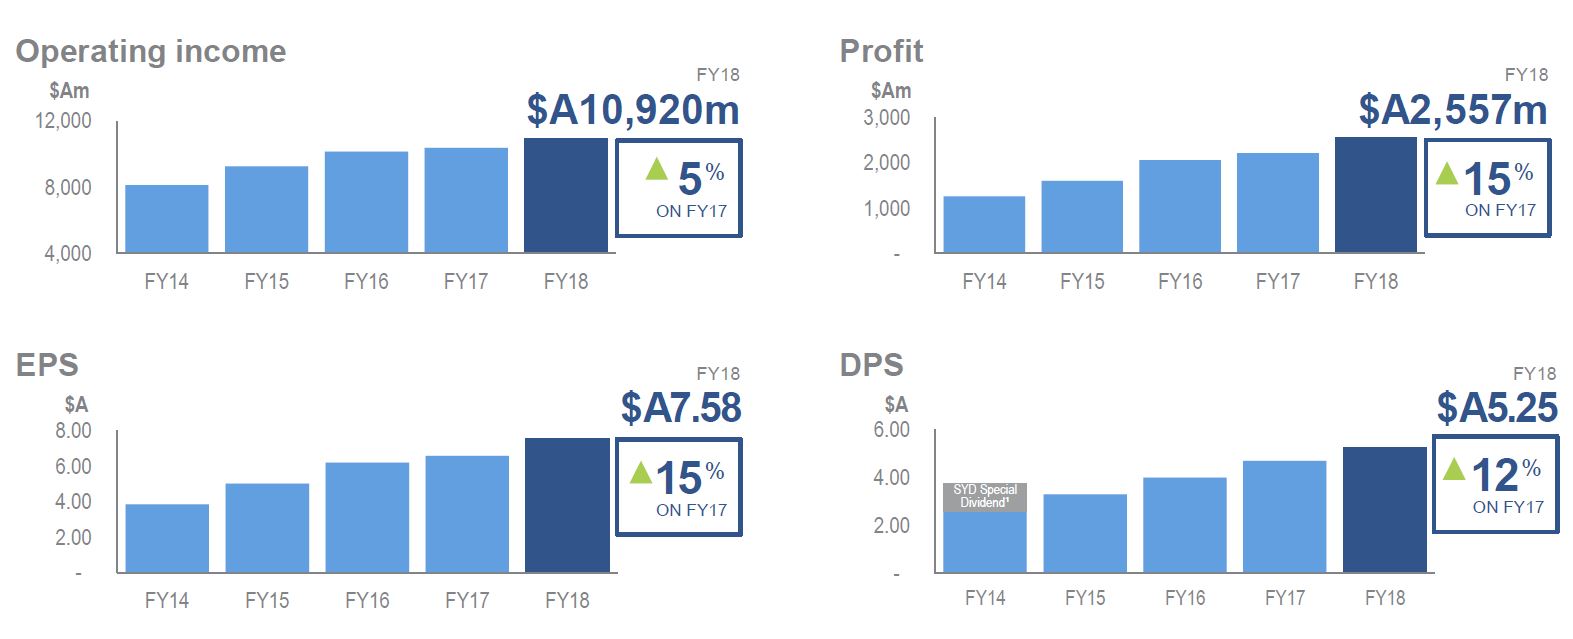
Macquarie presented their full year results to 31 March 2018. The 2H18 result was $1,309m, up 5% on 1H18 and 12% higher on 2H17. This represents a return on equity of 16.9%, up 1% from 1H18. The earnings per share rose 5% to $3.88.

They were helped by some one off items and tax benefits, but they to seem to manage to continue the upswing – especially with assistance from the capital markets division.  They continue to outperform against their guidance.

Looking at 2H18 business mix their annuity-style businesses contributed $1,357m, down 35% on 1H18 and 16% on 2H17. But their capital markets facing businesses contributed $1,042m, up 83% on 1H18, and 37% on 2H17.

Overall there was an increase in 2H18 NPAT, notwithstanding net profit contribution from operating groups being down 10%, due to lower corporate costs as a result of higher earnings on capital, lower profit share, lower provisions and lower tax.

Profits from the FY18 was $5,061m, up 8% on FY17, with annuity-style business up 6% to $3,451m, and capital markets facing businesses up 11% to $1,610m.

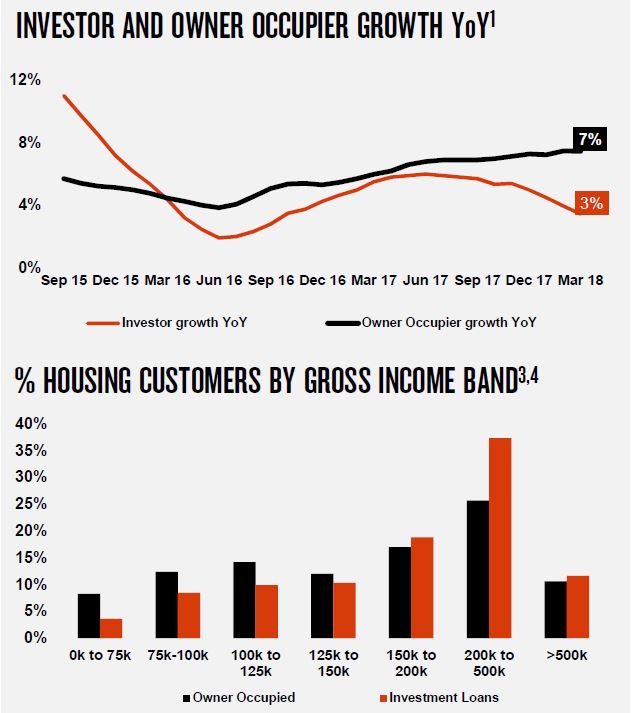
Annuity-style businesses represent approximately 70% of the Group’s performance.

Assets under management were $A496.7 billion, up $A15.0b since Mar 17, largely due to positive market movements and favourable currency
movements, partially offset by net asset realisations in MIRA (Includes divestment of Thames Water by MIRA-managed funds and ceasing asset services to consortia investors ($A25b).

International income was 67% of total income, with 33% of total income. A 10% movement1 in AUD is estimated to have approx. 7% impact on NPAT.

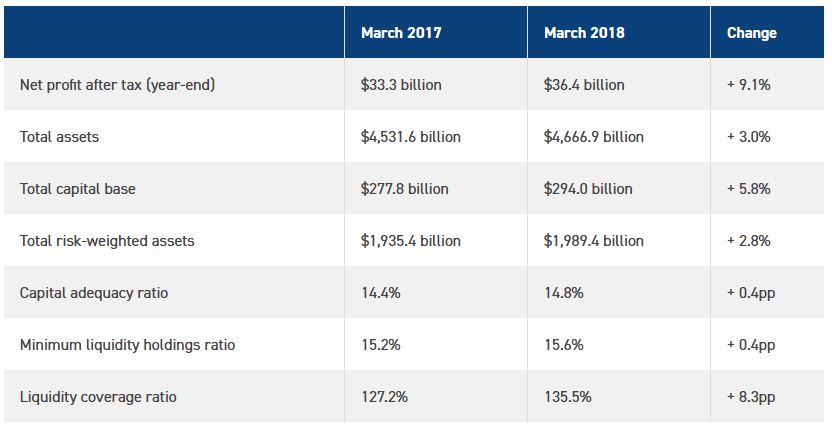
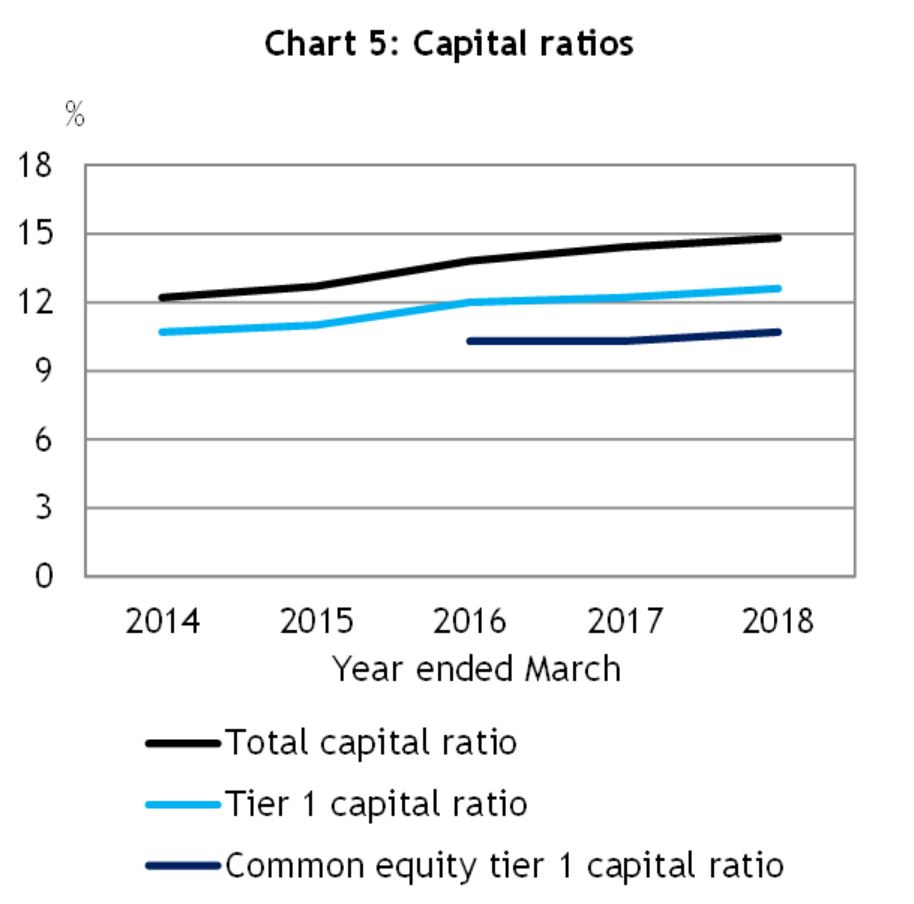
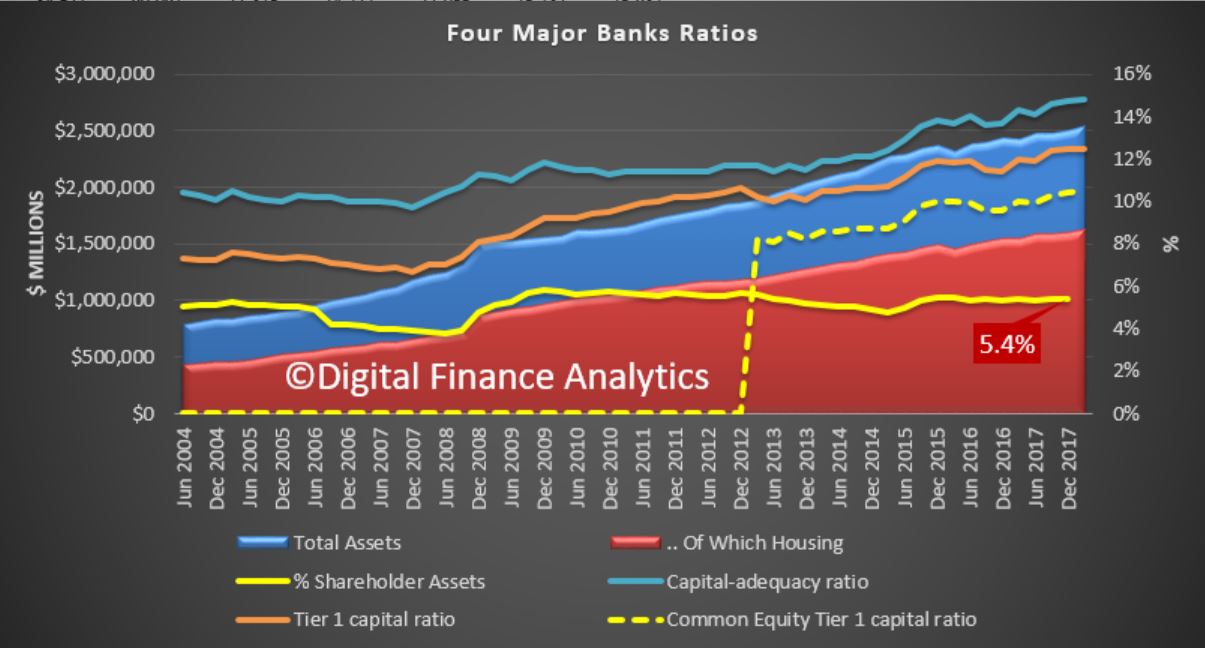
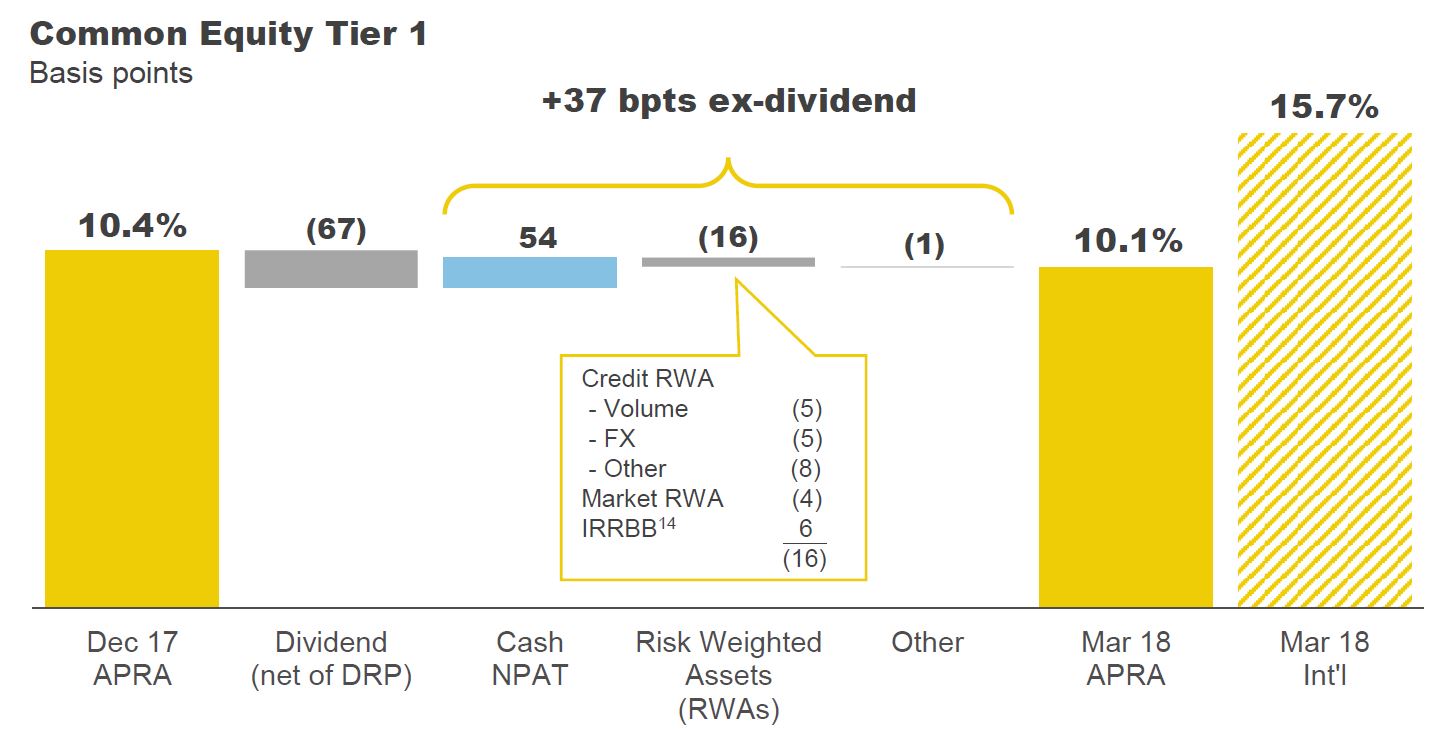
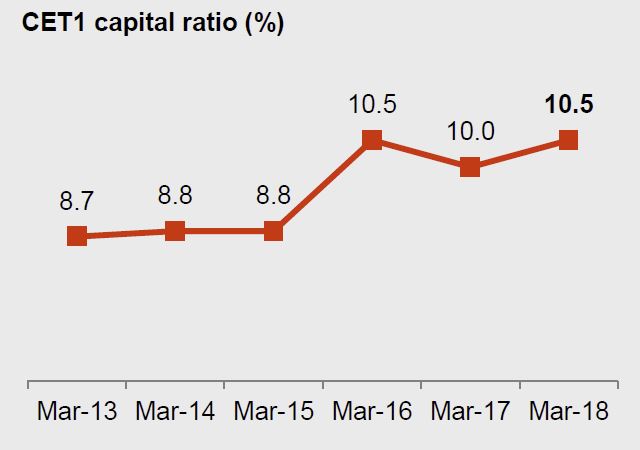
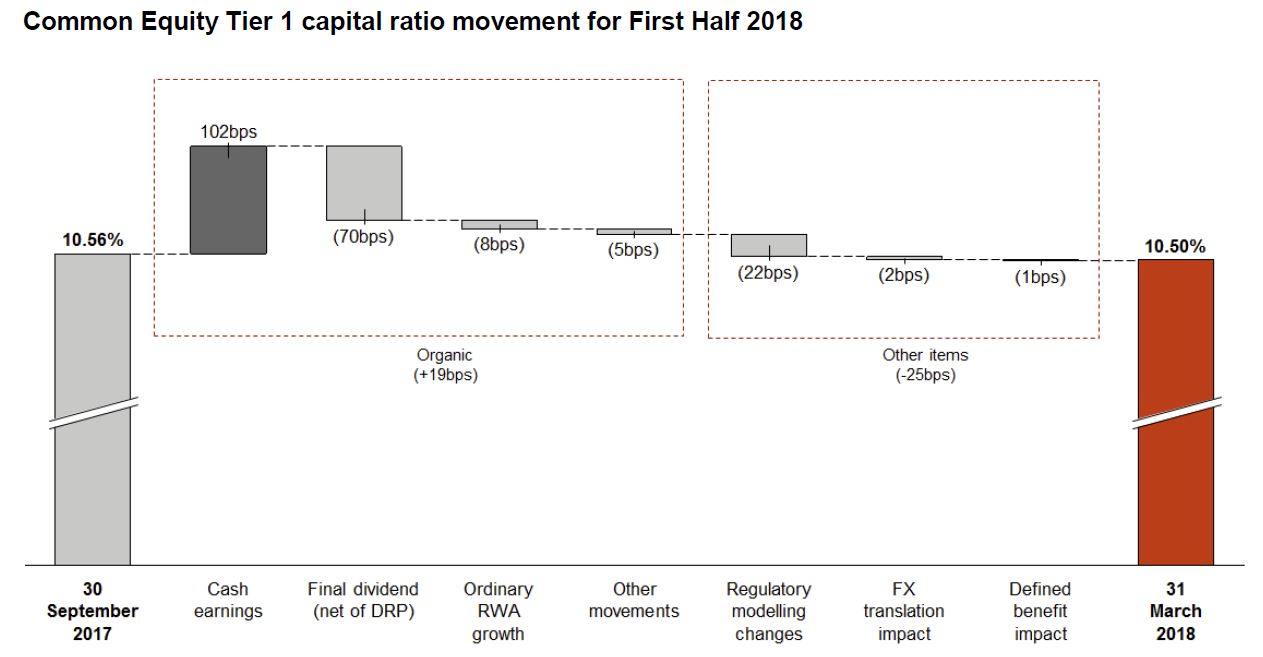
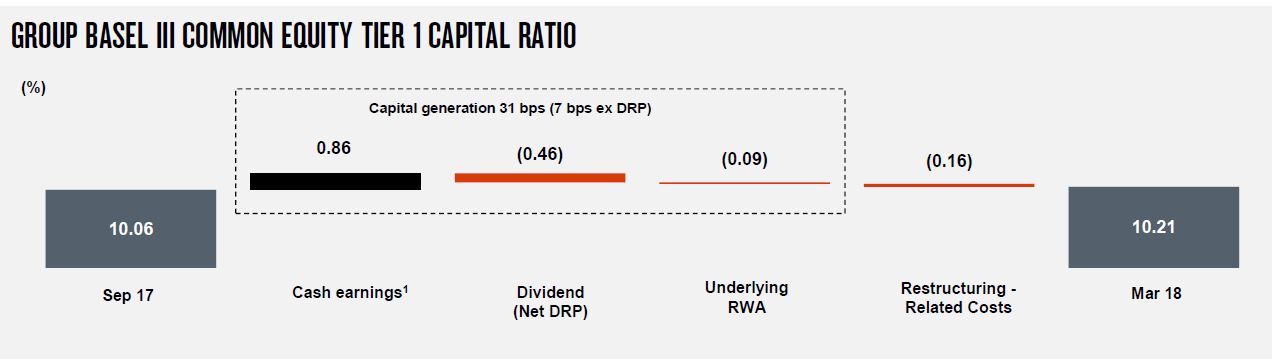
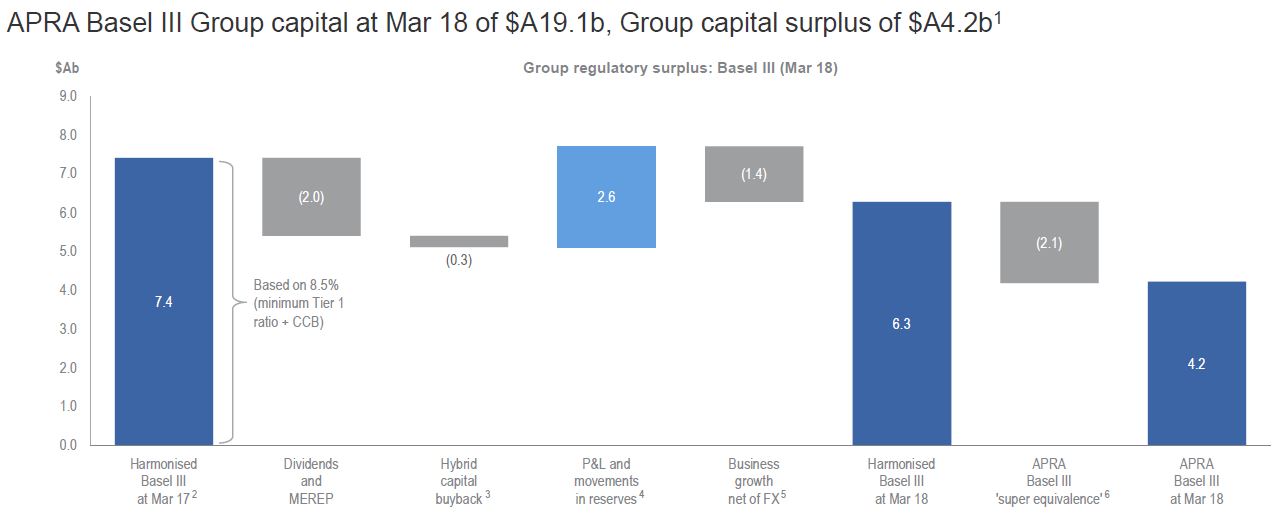
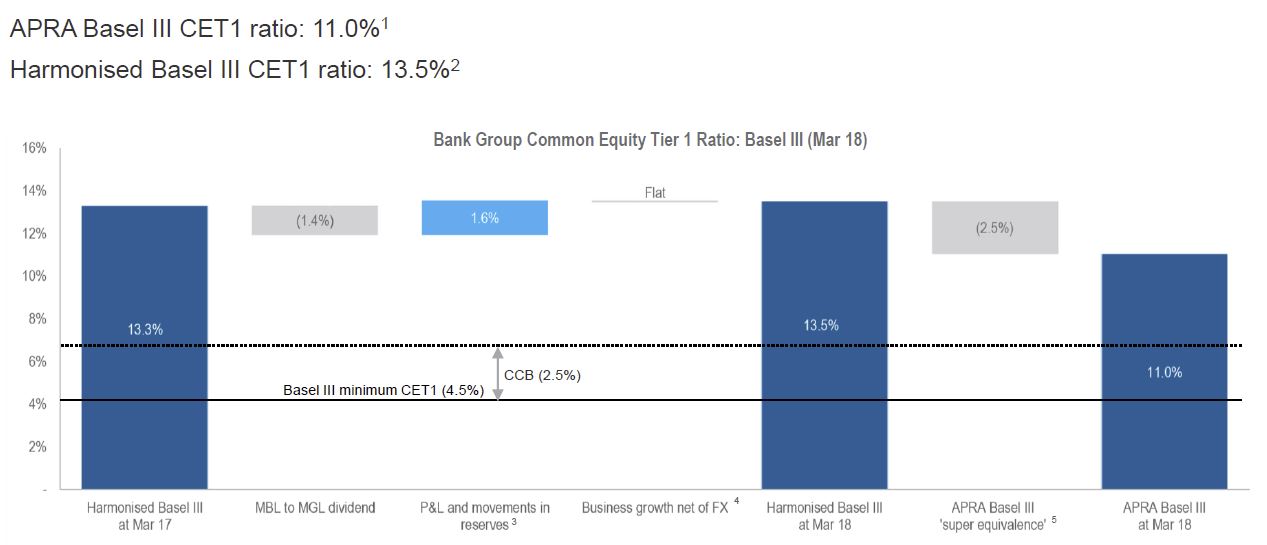
They reported a strong capital position, wiht APRA Basel III Group capital at March 18 of $19.1 billion.

Given significant business growth in FY18, Macquarie did not purchase any shares under the share buyback program announced at the 1H18 result announcement; the program remains in place, with any share purchases subject to a number of factors including the Group’s capital surplus position, market conditions and opportunities to deploy capital by the businesses.

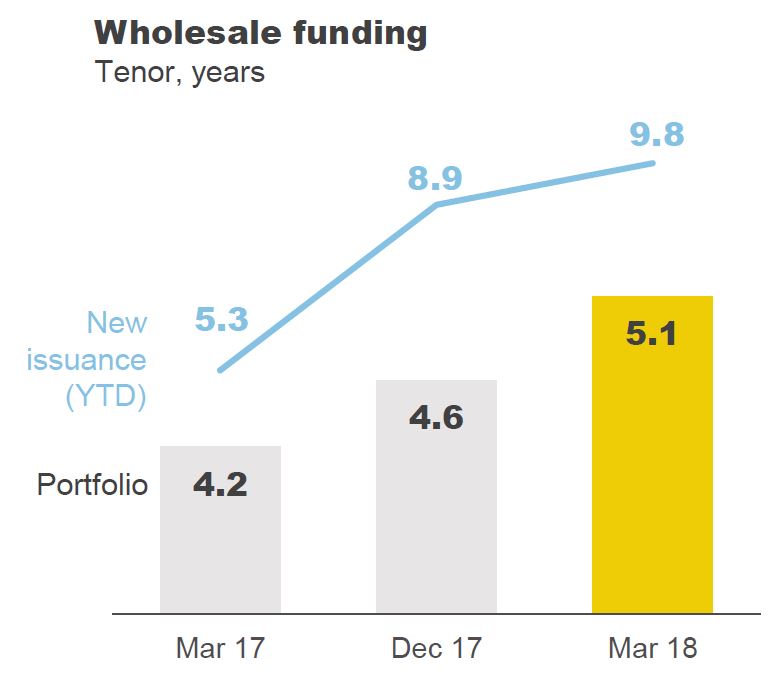
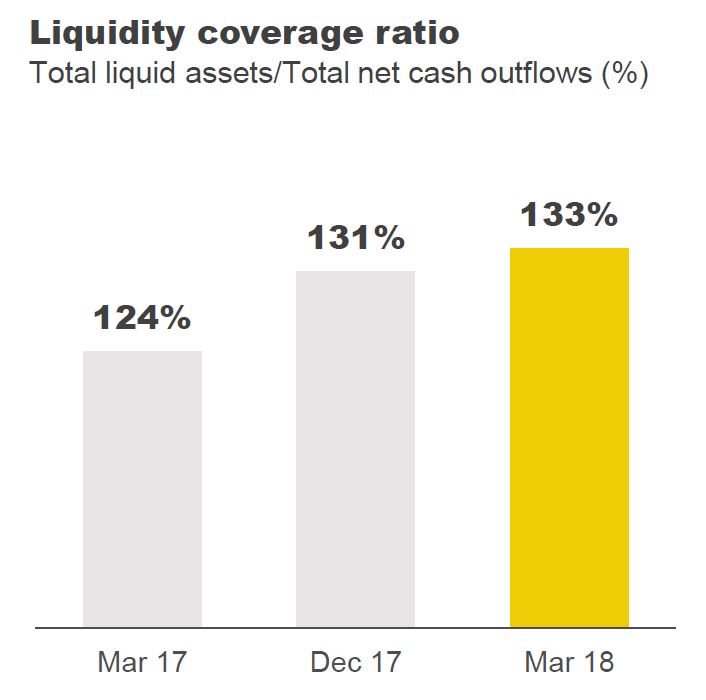
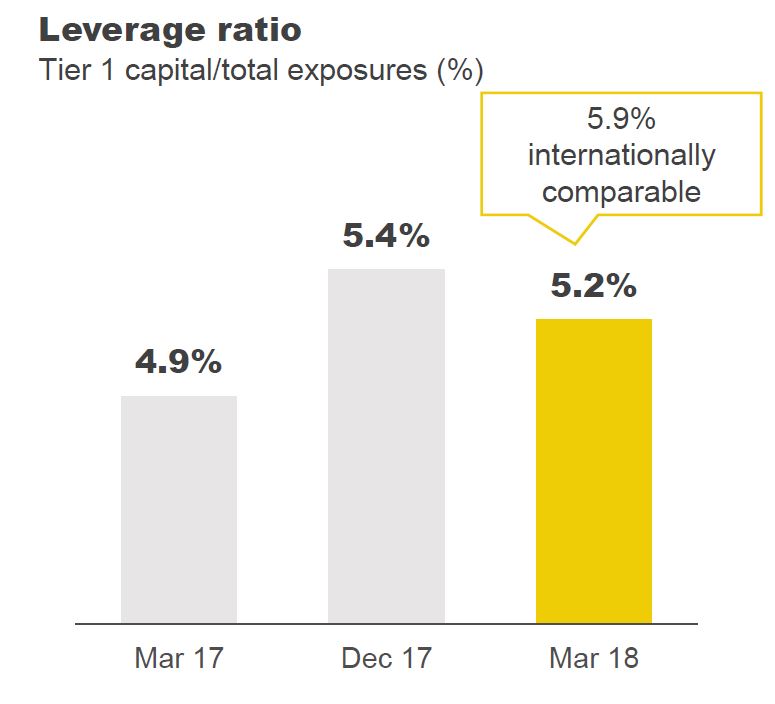
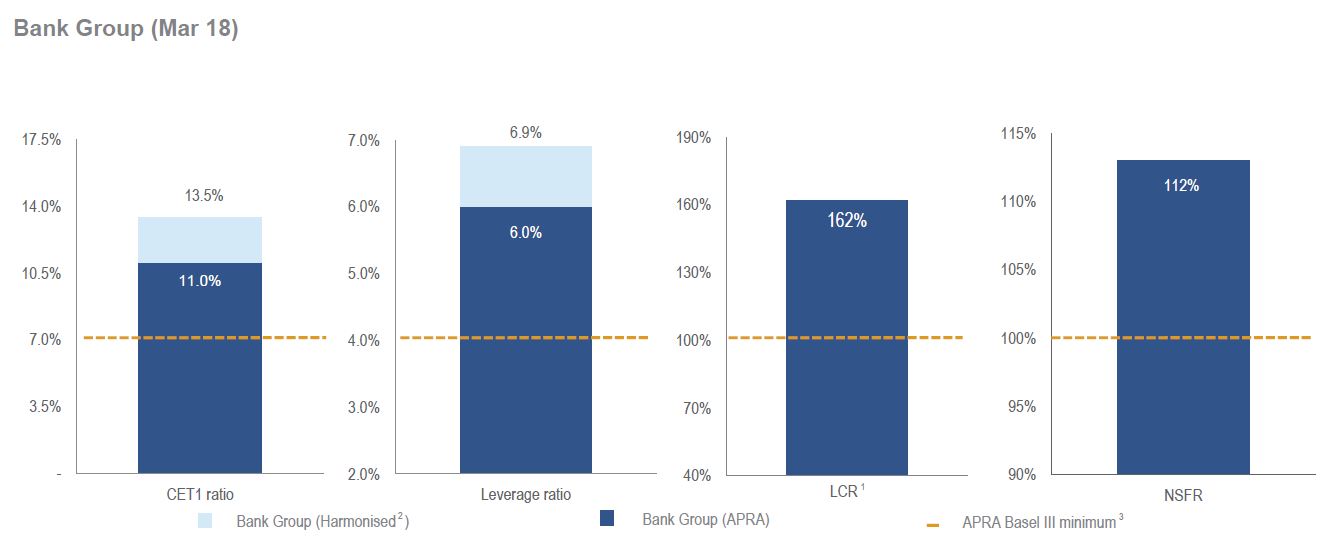
They have strong key ratios.

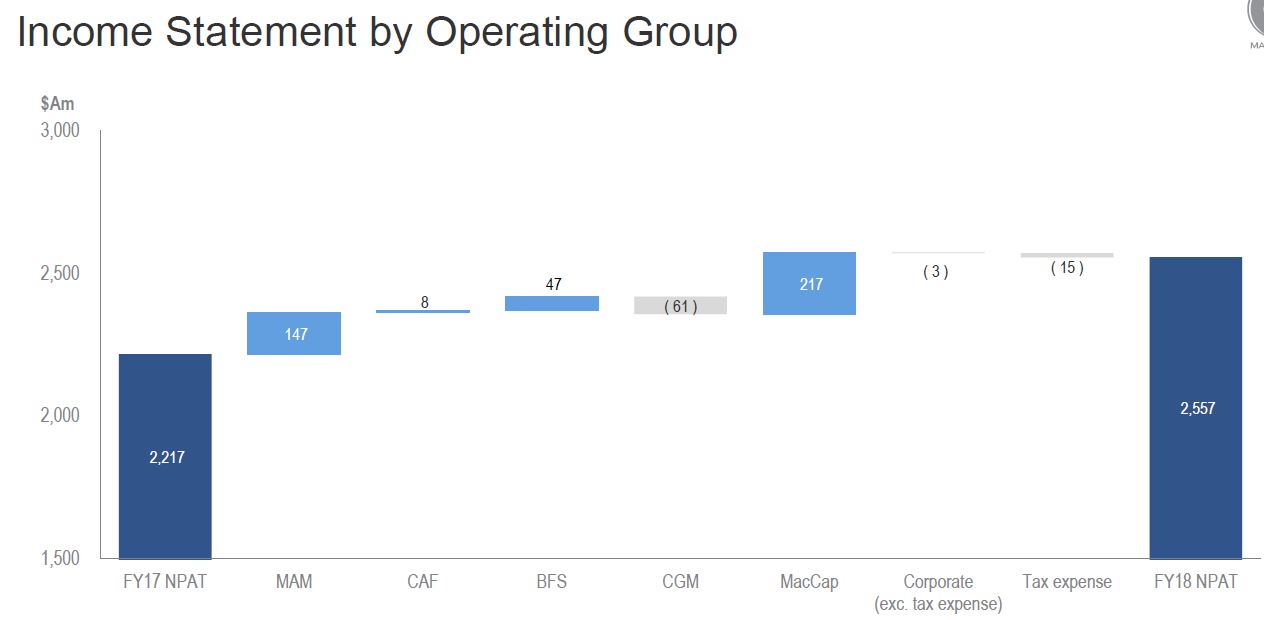
Looking at the Group entities, MacCap provided the largest contribution.

Macquarie Asset Management reported base fees of $A1,608m, broadly in line with FY17, with an increased fees from positive market movements in MIM AUM and investments made by MIRA-managed funds, but partially offset by asset realisations by MIRA-managed funds, net flow impacts in the MIM business and foreign exchange.

Performance fees of $A595m, up on FY17, and included performance fees from MEIF3, MQA and other managed funds, Australian managed accounts and Listed Equities. FY17 included performance fees from a broad range of funds, Australian managed accounts and from co-investors in respect of infrastructure assets. Investment and other income of $A766m, up on FY17, including increased equity accounted income as a result of the sale of a number of underlying assets as well as gains from the sale of infrastructure debt but partially offset by reduced gains from the sale and reclassification of certain infrastructure investments and lower distribution income

Impairments and provisions of $A177m largely reflects the write-down of MIRA’s investment in MIC

Total operating expenses of $A1,107m, up 5% on FY17 largely driven by increased employment expenses as a result of higher average headcount.

Corporate and Asset Finance reported net interest and trading income of $A582m, down 18% on FY17 mainly as a result of the reduction in the Principal Finance portfolio. Net operating lease income of $A929m, up 3% on FY17 due to improved underlying income from the Aviation, Energy and Technology portfolios.

Impairments and provisions expense of $A15m, down from $A111m in FY17 driven by the partial reversal of collective provisions, driven by net loan repayments, and the improved credit performance of underlying portfolios, but partially offset by the impairment of a legacy Asset Finance business and impairments of certain Aviation assets

Other income of $A352m, up 29% on FY17 including gains generated from Principal Finance investments in Europe and the US, The sale of the US commercial vehicles financing business and prior year primarily related to a gain realised on the sale of an interest in a toll road in the US by the Principal Finance business

Total operating expenses of $A679m, up 7% on FY17 mainly due to increased deal and project related expense.

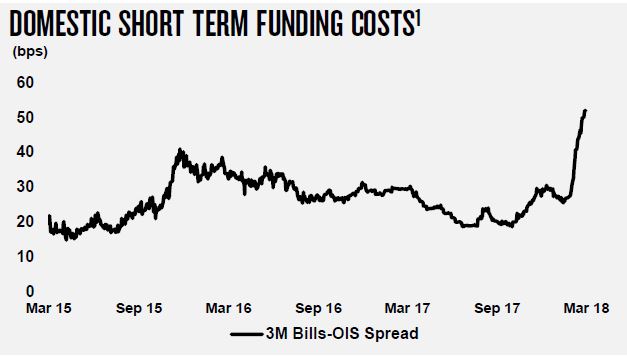
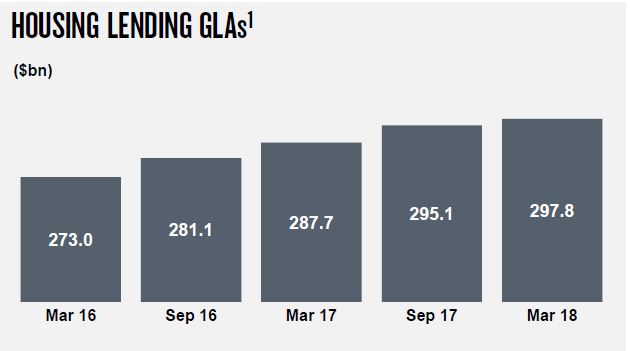
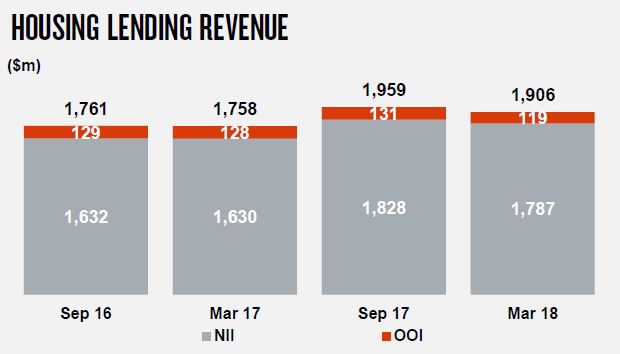
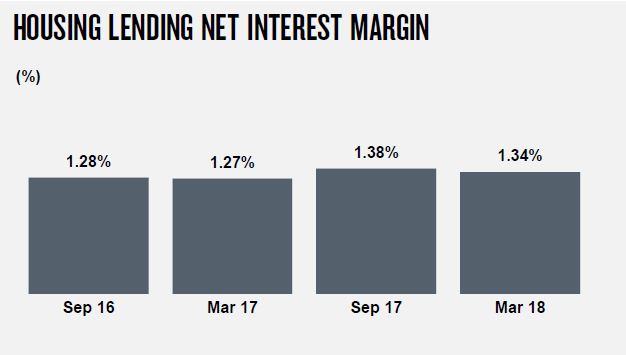
Banking and Financial Services reported net interest and trading income of $A1,182m, up 13% on FY17 with a 6% growth in average Australian loan volumes and 7% growth in average BFS deposits, though partially offset by $A16m allocation of the Australian Government Major Bank Levy that
came into effect from 1 Jul 17. Fee and commission income of $A466m, in line with FY17, with wealth Management fee income increased 7% driven by platform commissions from higher funds on the Wrap and Vision platforms which increased 14% on FY17 and decrease in life insurance income following the sale of Macquarie Life’s risk insurance business in Sep 16. There was a net gain on disposal of businesses of $A2m down from $A192m in FY17, which benefited from the net overall gain on sale of Macquarie Life’s risk insurance business to Zurich Australia Limited and the US mortgages portfolio.

Impairments and provisions expense of $A26m, down on FY17, which  included higher impairment of equity investments and impairments of intangibles relating to the Core Banking platform and higher business lending provisions taken on a small number of loans.

Total operating expenses of $A1,086m, down 4% on FY17 which was impacted by nonrecurring expenses. Underlying expenses were $A34m higher and included a 4% increase in average headcount to support growth.

Commodities and Global Markets reported commodities income of $A1,093m, down 3% on FY17, with risk management products down 6% on FY17 reflecting mixed results across the commodities platform with continued subdued volatility impacting client hedging activity and trading opportunities in Global Oil, partially offset by strong results in North American Gas and Power, Bulk Commodities and continued growth in Commodity Investor Products. Lending and financing income down 9% on FY17 largely due to wind down in legacy portfolios in the oil and gas sectors and a reduced contribution from metals financing. Inventory management, transport and storage income up 22% on FY17 mainly driven by significant
opportunities for the North American Gas and Power business to benefit from price dislocations across regions. However, the timing of income recognition in relation to tolling agreements and capacity contracts results in a net $A144m of income being recognised in future years.

Credit, interest rate and foreign exchange income of $A508m, down 18% on FY17 driven by reduced client activity in an environment of sustained low volatility and tighter credit spreads, unfavourable market conditions impacting trading opportunities, partially offset by strong client activity in structured foreign exchange products. Equities up 17% on FY17 reflecting more favourable conditions in Asia, a moderate increase in volatility and
strong demand for warrants and structured client capital solutions. Fee and commission income of $A893m, up 4% on FY17 driven by demand for advisory and structured solutions primarily in Asia and North America. • Investment and other income down on a strong FY17 which included gains on the sale of a number of investments in energy and related sectors

Impairments and provisions down on FY17 which was impacted by certain underperforming commodity related loans.

Expenses of $A1,997m were broadly in line with FY17, with impact of the Cargill acquisitions partially offset by cost synergies following the merger of CFM and MSG.

Macquarie Capital reported fee income was broadly in line with FY17, including M&A: lower fee income across most regions except Europe,    ECM: reflected a sustained period of lower deal activity in Australia, DCM: higher fee income reflected increased market share and client activity in the US. There was stronger investment-related income (ex non-controlling interests), including higher revenue from asset realisations across most regions, primarily in the green energy, conventional energy and infrastructure sectors together with gains in the insurance and technology sectors, Increase in equity accounted income primarily due to the improved underlying performance of investments but partially offset by higher funding costs for balance sheet positions due to increased activity, including the acquisition of GIG

Lower provisions for impairment and net operating expenses increased 9% on FY17 reflecting transaction, integration and ongoing costs associated with the acquisition of GIG and higher operating expenses from increased investing activity

NAB Profit 16% Lower (PCP)

National Australia have released their 1H18 results. They were soft, but of most interest is the pressure on net interest margin, from both heightened competition in the mortgage lending segment, on lower growth, and higher funding costs.  This was offset by deposit repricing.  But Markets NIM was also down. Plus results were muddied by more restructuring costs and lower provisions, despite higher consumer arrears. Capital is lower than was expected. They also plan to sell, or float MLC, the bulk of their wealth management arm, which should provide some capital upside after 2019.

CEO Andrew Thorburn said “We continue to learn from our mistakes and respond by making changes to be better for customers. The commitment of our people to do the right thing is unwavering and together we are working to restore trust and respect in our industry, during and after the Royal Commission”.

The cash earnings was down 16% on the prior corresponding period (pcp) to $2,759m, which was below consensus.  This included $755m restructuring charges, so cash earnings, exceeding these were $3,289m, down 0.2% on 1H17 or down 1.8% on last half.  The statutory profit was $2,583m up 1.5% on pcp, but down 5.7% on the previous half.

The diluted earnings per share were $0.988 per share, down 17% and the cash RPE was 11.4%, down 260 basis points, or excluding restructuring costs down 40 basis points to 13.6%.

Revenue was up 2.5% on pcp to $9,093m with growth in housing and business lending lifting margins, but offset by lower Markets and Treasury income.

Overall Net interest margin was down 1 basis point. A rise of 5 basis points, reflecting repricing and lower funding costs was offset by the impact of the bank levy and housing competition and product mix changes.

They said if current short term funding costs continue to rise..

.. 2H18 NIM would be reduced by 2-3 basis points.

Expenses were up 25.3% of 5.4% excluding restructuring-related expenses. Net FTE were up from 33,422 to 33,944, which is interesting bearing in mind its plan to reduce 6,000 from existing FTE and add back 2,000 digital specialists by 2020.

Looking at the home lending portfolio, total loans rose from $295.1 billion in Sept 17 to $297.8 billion in March 18, the smallest rise for some time.

Housing revenue fell in 1H18, despite maintaining a 15.7% market share.

Housing NIM fell by four basis points in 1H18, as the effect of earlier repricing faded, and competition of loans increased.

Data on the portfolio shows that growth is stronger in owner occupied loans. However, the gross incomes appear to us to be significantly higher than the “average income” from households.  41.6% of draw-downs are via brokers compared with 34.6% in the portfolio.

They also said 54.1% of investment loans are interest only.  Interest Only loans are below the 30% Interest Only flow cap includes all new IO loans and net limit increases on existing IO loans. The cap excludes line of credit and internal refinances unless the internal refinance results in an increased credit limit (only the increase is included in the cap).

They said that the banks is using granular customer expense conversation and capture since late 2016 – across 12 expense criteria.  They use the greater of customer expense capture or income scaled Household Expenditure Measure (HEM).  Around 60% of mortgage applications have declared expenses above HEM since October 2014.

In 1H18 home loans drawn with Loan-to-Income (LTI) >6x was 9%, >7x was 3%. The  average LVR at origination is 69%. The dynamic LVR 43% (2% have >90% dynamic LVR).

They said 465 home loan files were reviewed by Ernst & Young as part of
APRA review of all major bank home loan policies, processes and controls. They found issues with verification of serviceability found in 23 files (5%), but on further review serviceability was proven for all but 1 file. None of the 23 files are in arrears.

Portfolio arrears are rising with 90 day+ past due now at 0.75%, up from 0.69% in September. This is worth $2.2 billion, up from $2.02 billion in September.

The rises are most noticeable in WA and QLD, but small hikes in other states too.

Arrears in the consumer credit portfolio are also rising.

Yet overall Group credit impairment charges declined 5.3% to $373 million, and declined 1 basis point to 13 basis points as a percentage of gross loans and acceptances.

Overall asset quality improved with the ratio of 90+ days past due and gross impaired assets to gross loans and acceptances down 14 basis points to 0.71%, thanks to improved conditions for New Zealand dairy customers and work-out strategies across Australian business lending.

The Group CET1 ratio was 10.21%, up 15 basis points from September 2017.

They still expect to meet APRA’s unquestionably strong target of 10.5% by 2020.  Their leverage ratio was 5.6%. The liquidity coverage ratio was 127% and the net stable funding ratio was 115%.

The announced the sale of MLC and other wealth management businesses with a view to evolving a simpler wealth offering through JBWere and nabtrade. They are targetting a separation by the end of 2019 via public market options including demerger and IPO whilst maintaining flexibility to consider trade sale options.  Subject to board and regulatory approval.

Genworth Delinquencies Up Again

Lenders Mortgage Insurance is a tough gig, because they tend to get the higher risk loans, written at higher loan to value ratios. So, perhaps no surprise that in the current environment, of tougher lending conditions, and high debt, we continue to see a drop in new business and a rise in delinquencies. Significantly, there was a rise in NSW delinquencies, the most populous state, with the biggest loans! “In non-mining regions there are indications of a softening in cure rates, in particular in NSW and Western Australia. These are being closely monitored to ascertain any developing adverse trends”.

Genworth Mortgage Insurance Australia Limited has reported statutory net profit after tax (NPAT) of $8.4 million and underlying NPAT of $19.9 million for the quarter ended 31 March 2018 (1Q18). This is down 70.9% on prior corresponding period (though 1Q17 underlying NPAT included a $20.8 million realised gain resulting from a re-balancing their investment portfolio).

New business volume, as measured by New Insurance Written (NIW), decreased 36.8% to $4.3 billion in 1Q18 compared with $6.8 billion in 1Q17.

NIW excludes excess of loss insurance and the new business written via Genworth’s Bermudan entity. NIW reflects the fact that: i) there were no bulk portfolio transactions in 1Q18 (1Q17 included $1.3 billion of bulk portfolio business); and ii) 1Q17 included business written pursuant to an agreement with the Company’s then second largest customer. This agreement terminated in April 2017 and represented $1.6 billion of NIW in 1Q17.

Gross Written Premium (GWP) increased 97.4% to $174.1 million in 1Q18 (1Q17: $88.2 million). This includes the new business written via Genworth’s Bermudan entity and the new Micro Markets LMI business. Genworth has retained $170.2 million of risk and placed the remainder with a consortium of global reinsurers through its Bermudan entity. Net of the premium to the consortium of global reinsurers, Genworth’s GWP increased 26.5% in 1Q18. For reporting purposes this risk is not reflected in NIW. In terms of the traditional LMI business written during the quarter, the lower volumes were partially offset by the higher LVR mix resulting in a modest increase in the average price of the flow business.

Net Earned Premium (NEP) decreased 37.5% from $107.9 million in 1Q17 to $67.4 million in 1Q18. This reflects the $32.3 million impact of the 2017 Earnings Curve Review and lower earned premium from current and prior book years. Excluding the 2017 Earnings Curve Review impact, NEP would have declined 7.6%. The 2017 Earnings Curve Review took effect from 1 October 2017 and has the effect of lengthening the period of time over which premium is earned. It does not however affect the quantum of revenue that will be earned over time. The unearned premium reserve as at 31 March 2018 was $1.2 billion.

The delinquency rate increased slightly from 0.48% in 1Q17 to 0.49% in 1Q18, driven by Western Australia and New South Wales (NSW).

South Australia and Queensland experienced lower delinquency rates, whilst the delinquency rate in Victoria increased marginally. All states experienced a decline in new delinquencies, with the exception, of Western Australia. Delinquencies in mining areas are showing signs of improving. In non-mining regions there are indications of a softening in cure rates, in particular in NSW and Western Australia. These are being closely monitored to ascertain any developing adverse trends.

Net Claims incurred was stable during the quarter at $37.7 million (1Q17: $37.6 million). The loss ratio in 1Q18 was 55.9%, up from 34.8% in 1Q17, reflecting the impact of lower NEP due to the 2017 Earnings Curve Review. Excluding the impact of the 2017 Earnings Curve Review the 1Q18 loss ratio would have been 37.8%.

The expense ratio in 1Q18 was 33.5% compared with 25.2% in 1Q17, reflecting the lower NEP and expenditure on the Strategic Program of Work.
Investment income of $7.8 million in 1Q18 included a pre-tax mark-to-market loss of $16.4 million ($11.5 million after-tax). In the first quarter of 2017, the portfolio was restructured to reduce interest rate risk exposure, resulting in pre-tax realised gains of $29.7 million ($20.8 million after tax). This gain was included in the underlying NPAT reported in 1Q17. As at 31 March 2018 the value of Genworth’s investment portfolio was $3,285.4 million, more than 83% of which is held in cash and highly rated fixed interest securities. The Company had $216.9 million invested in Australian equities as at 31 March 2018. Whilst volatility in equity markets contributed to unrealised losses in 1Q18, the equity portfolio has delivered a return of 8.9% p.a. (pre-tax) since inception in 2016.

They continue to be focused on an optimal capital structure to maintain the Board’s targeted Prescribed Capital Amount (PCA) of 1.32 to 1.44 times. So they announced an on-market share buy-back of up to a value of $100 million, subject to shareholder approval at the Annual General Meeting 10 May 2018.