ANZ 1H 18 Result – Banking On Home Loans

ANZ reported their 1H 18 results today, amid the turmoil of the Royal Commission, its good to get back to real bank results!

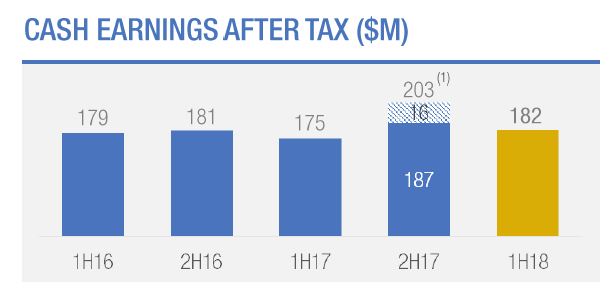
They announced a statutory profit after tax of $3.32 billion, up 14% and a cash profit on a continuing basis of $3.49 billion up 4% on the prior comparable period.  This was a bit below consensus, thanks to lower than expected Institutional results.  But the simplification of the business is paying dividends, provided the home lending markets in Australia and New Zealand continues to fire…

There was some restating of results thanks to the handling of OnePath Life and OnePath Pensions now classed as discontinued operations and shown separately. Inclusive of the $617 million negative impact, the Group cash profit would be $2.88 billion. They expect around 80 basis points of total capital benefit.

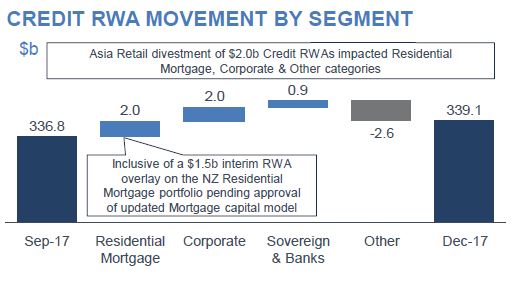
In the half they finalised the sale of six Asian retail and wealth businesses which allows the bank to further strengthen their focus on Institutional, which continues to have a  regional footprint across 15 markets in Asia. Total institutional RWA fell $42 billion, down 20% since FY15. But more significantly, 60% of Group capital is now allocated to Retail and Commercial businesses in Australia and New Zealand, up from 44% in 2015. ANZ is now a very different shaped bank. Much more reliant on the performance of the local economy!

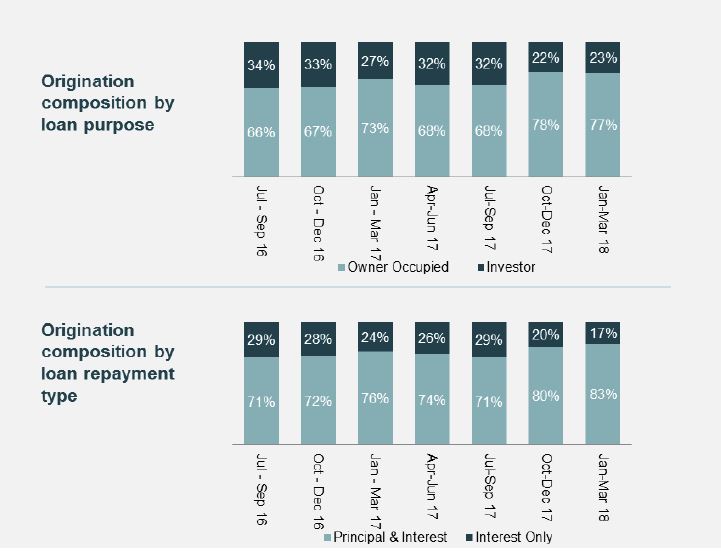
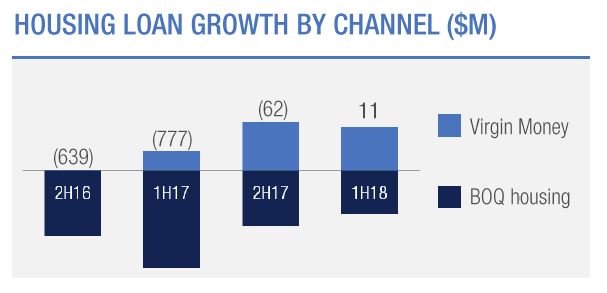
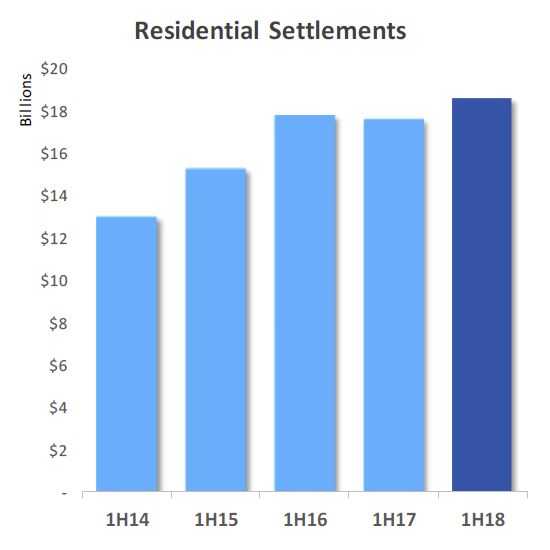
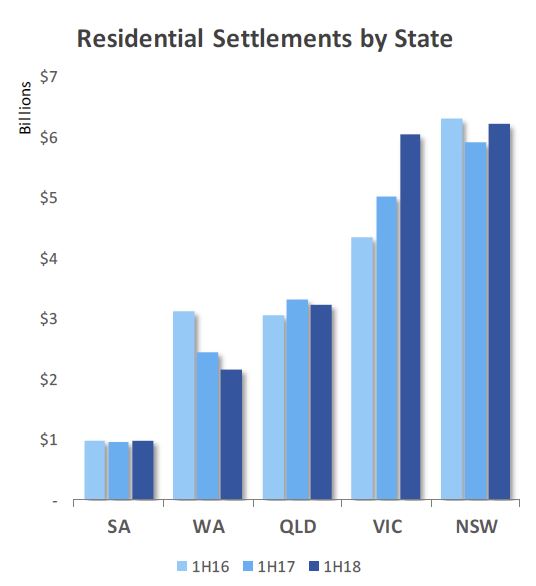
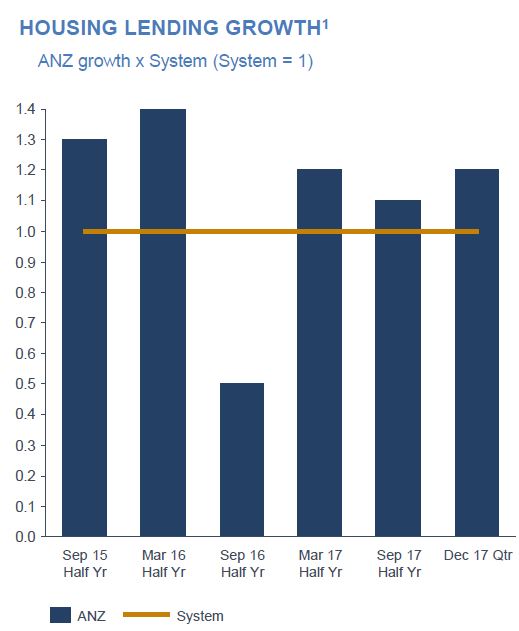
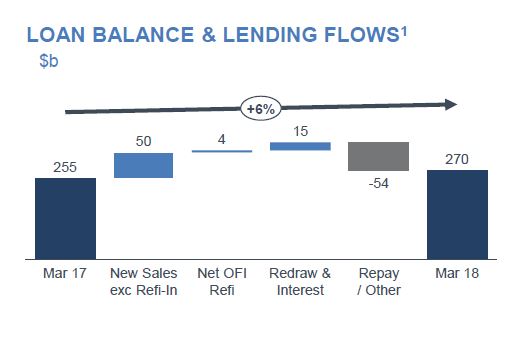
They grew home loans in Australia, by 6%, with a strong focus on owner -occupied (P&I) and 5% in New Zealand.

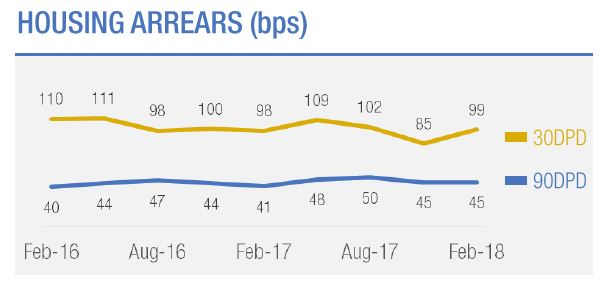
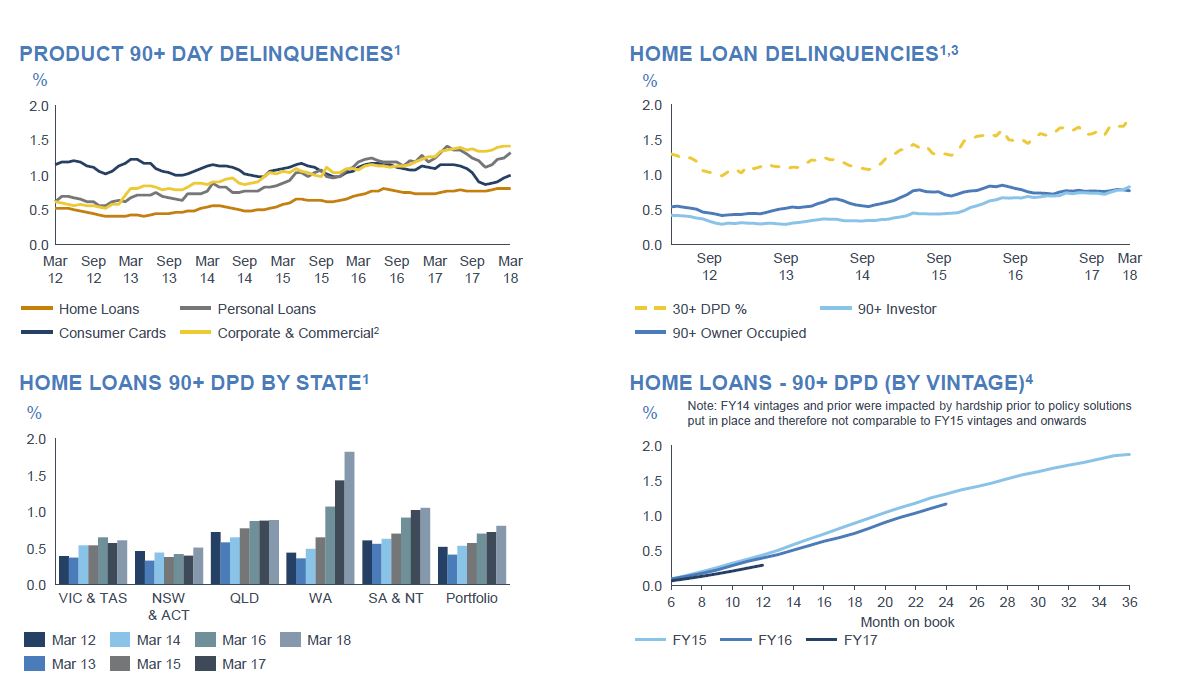
Australian home loan delinquencies were higher, mainly thanks to ongoing issues in WA. WA is 13% of  portfolio but 30% of 90+ and half of portfolio losses.

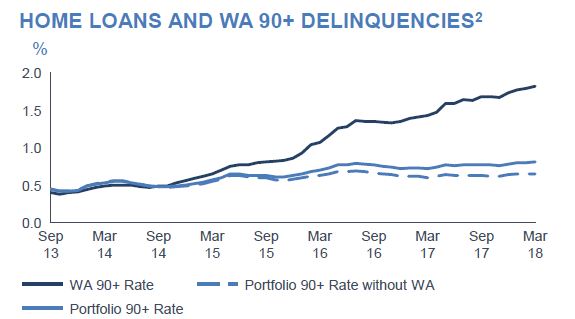
More recent loans (written at higher underwriting standards?) are performing a little better, but there are some issues with older loans.

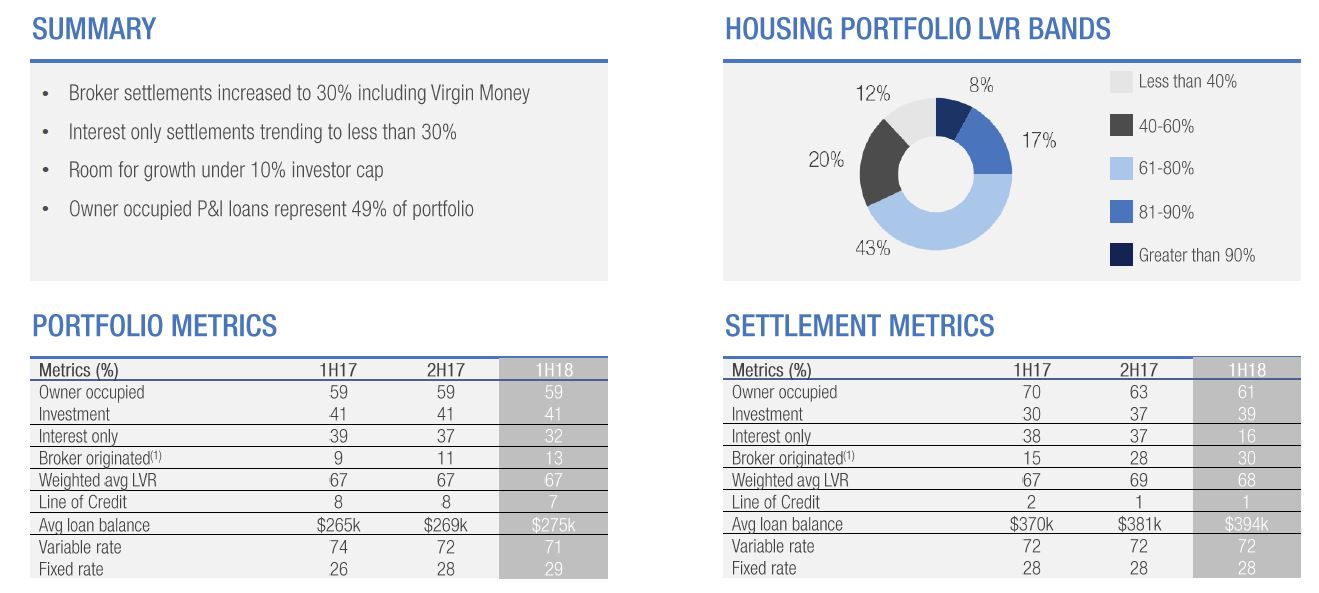
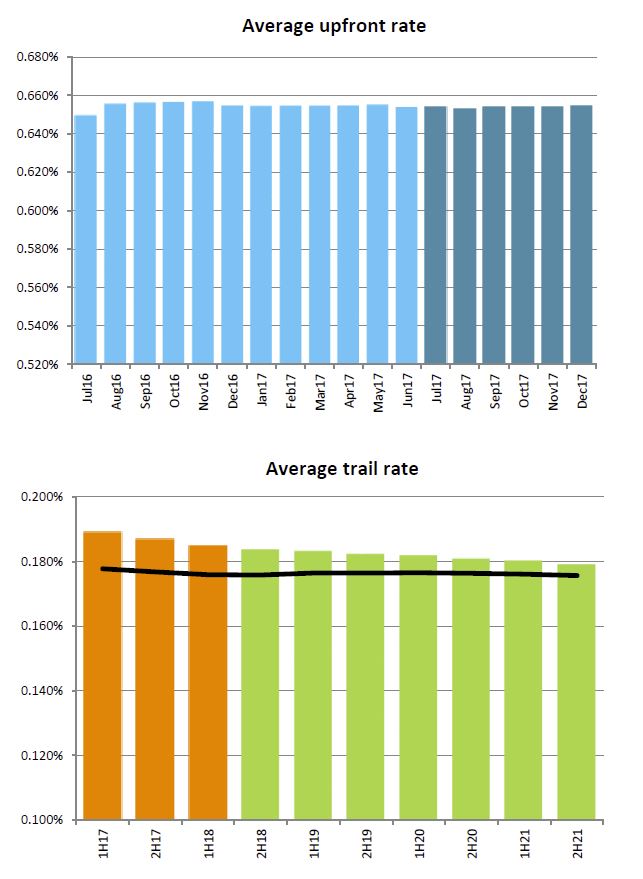
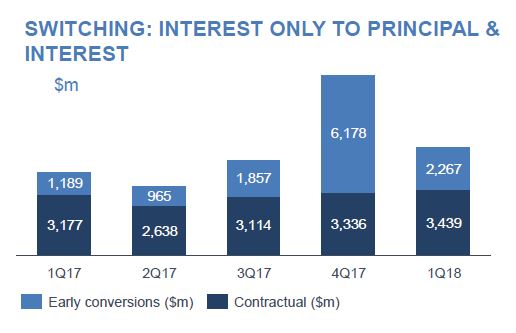
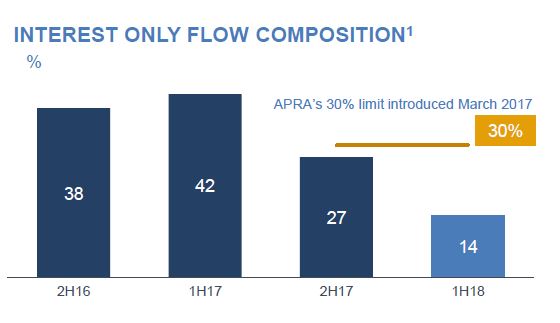
ANZ has throttled back IO loans, and they say serviceability assessment is based on ability to repay principal & interest repayments calculated over the residual term of loan. Serviceability assessment is based on ability to repay principal & interest repayments calculated over the residual term of loan.  Proactive contact strategies are in place to prepare customers for the change in their cash repayments ahead of Interest Only expiry.

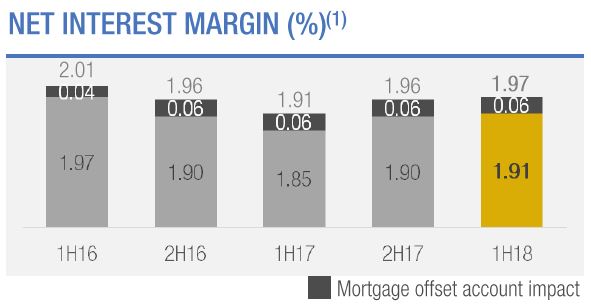
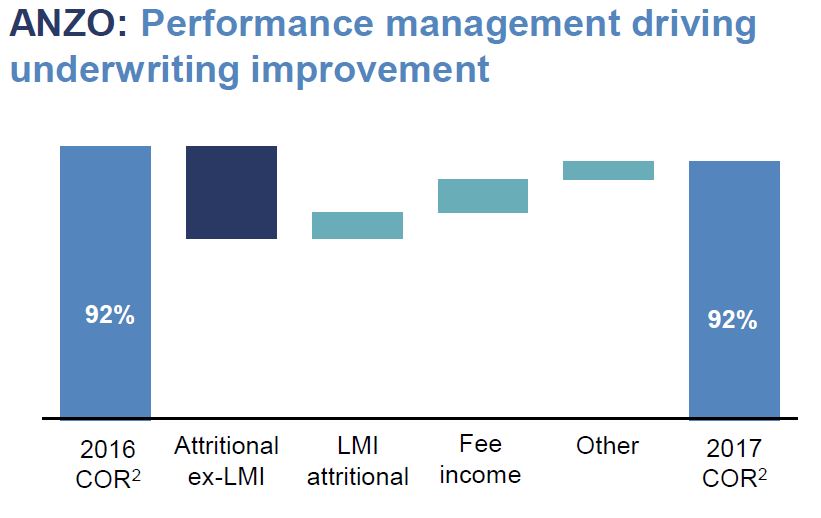
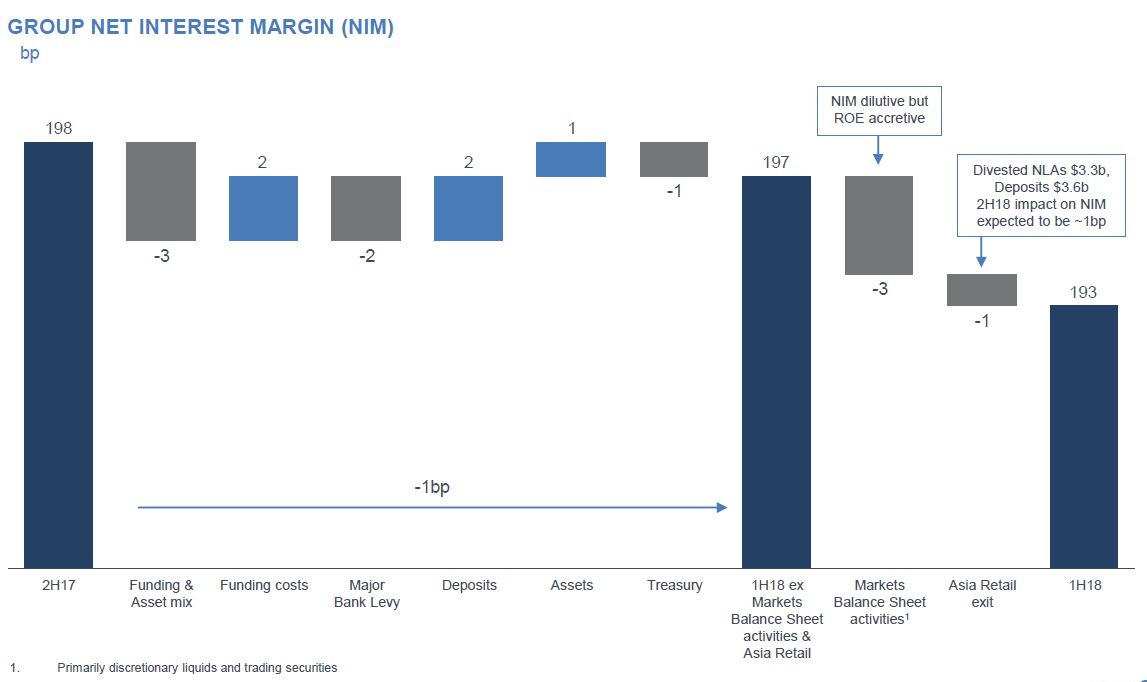
Group Net interest margin fell 5 basis points from 2H17. However, NIM was up in Australia (+5 basis points) and New Zealand (+6 basis points).

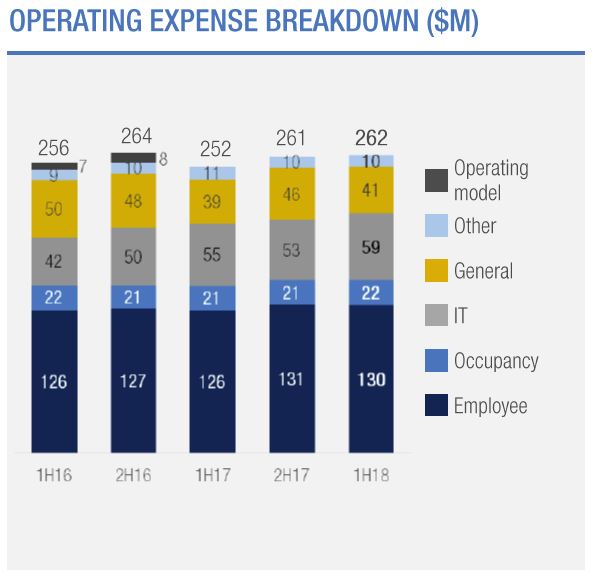
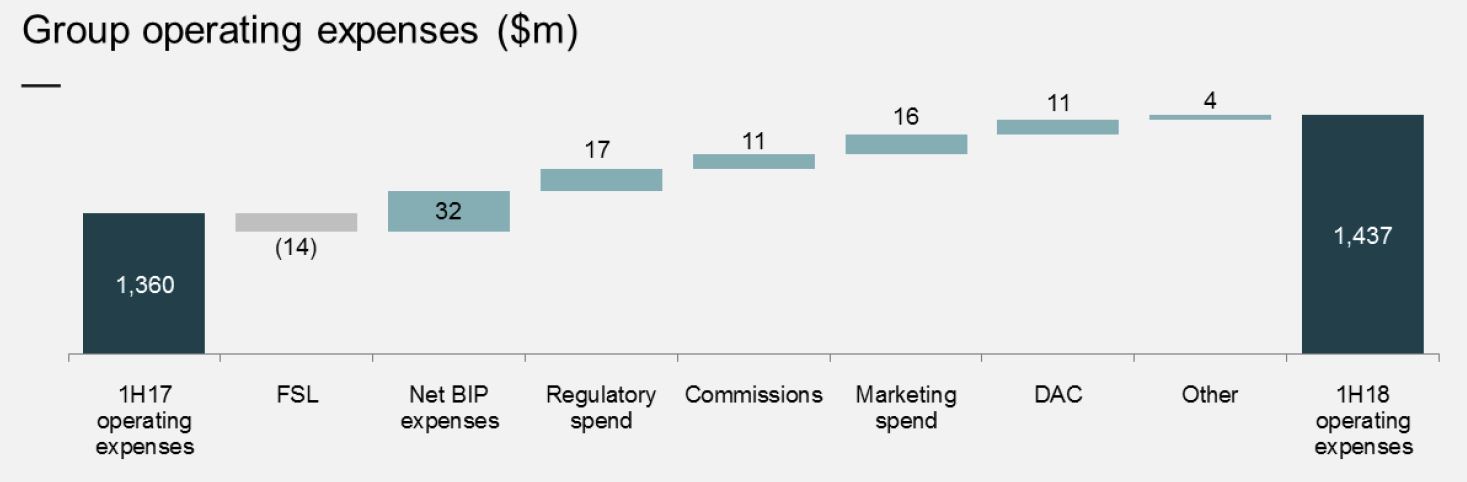
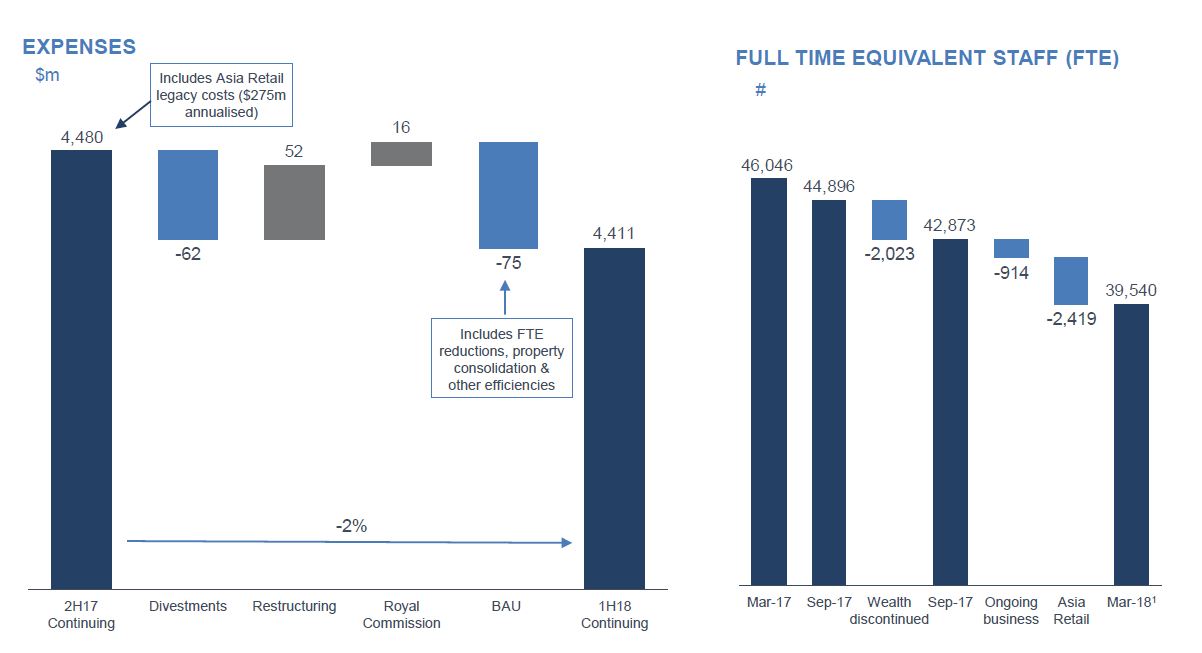
Expenses fell, thanks to a reduction in staff and consolidation.

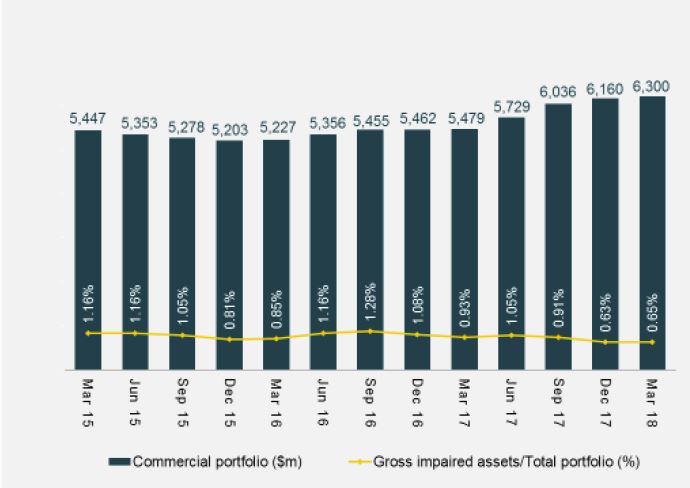
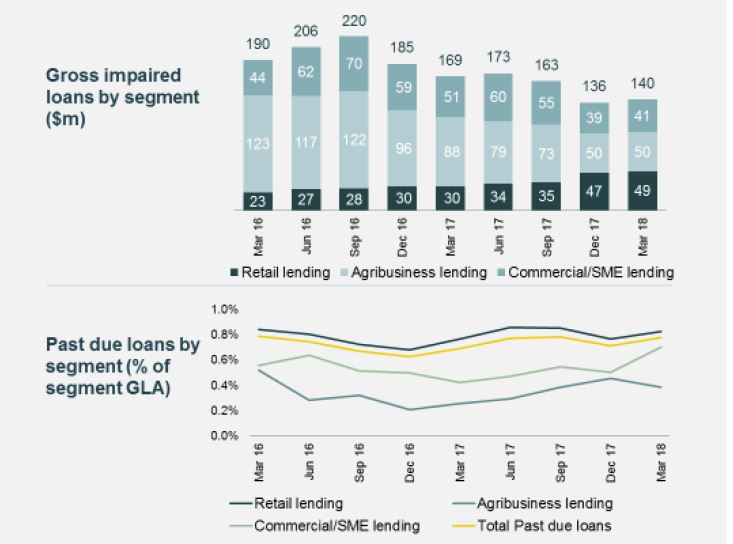
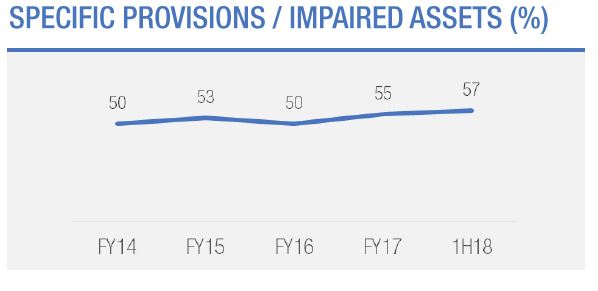
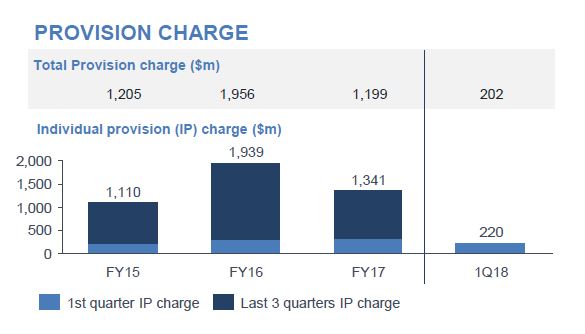
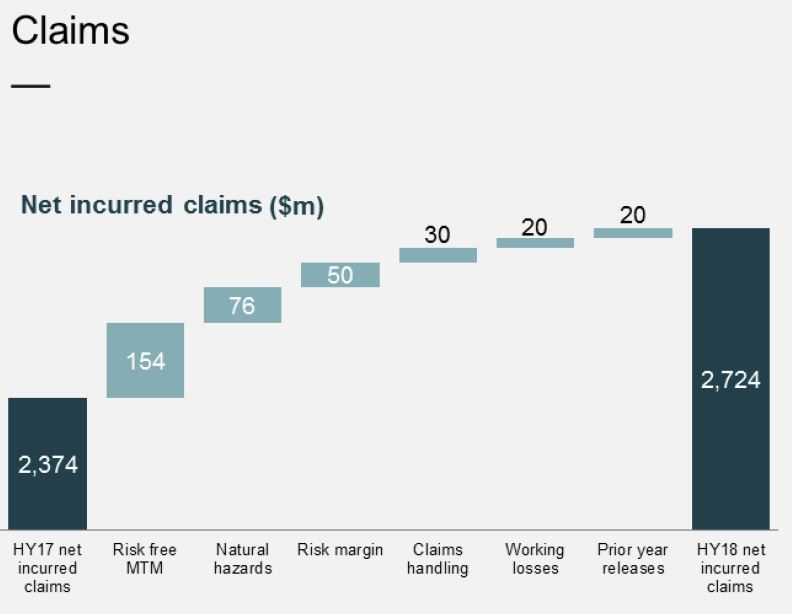
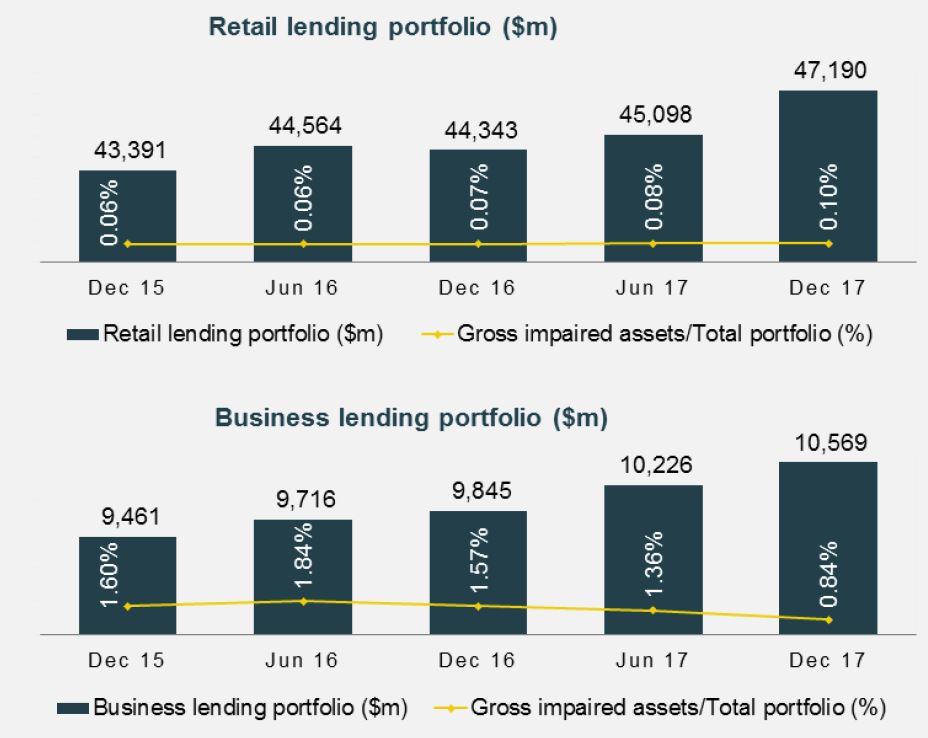
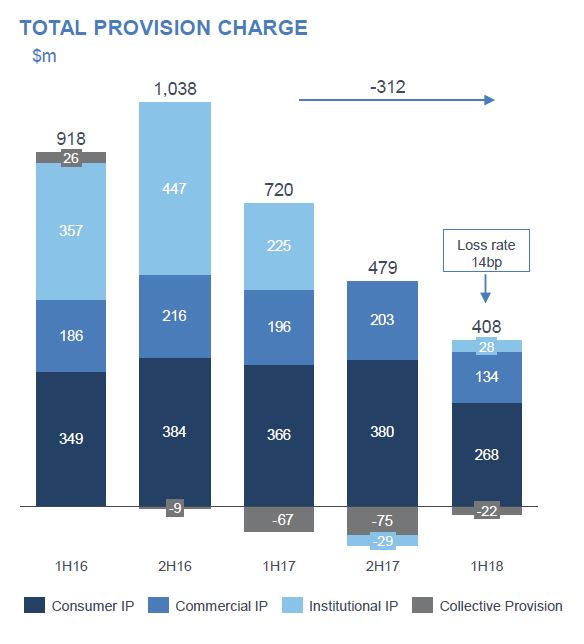
Total provision charge for the half was $408 million, which equates to a loss rate of 14 basis points, down from 21 basis points at the end of FY17. New impaired assets declined 32% over the half, with gross impaired assets down 15% over the same period.

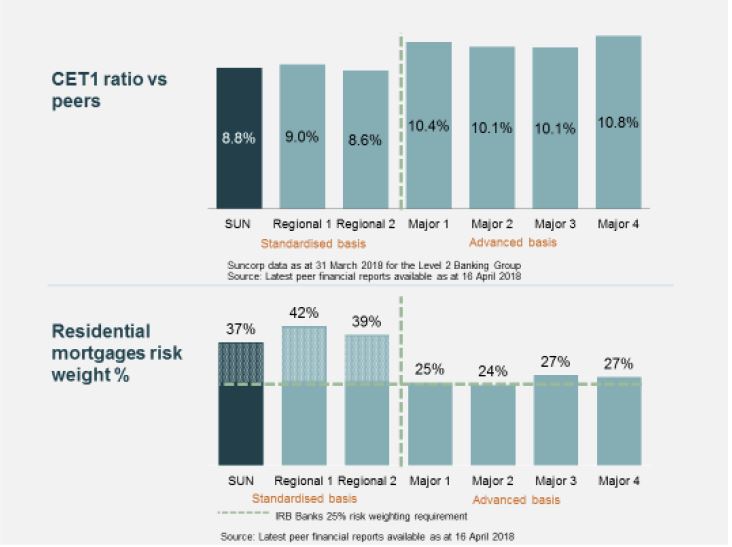
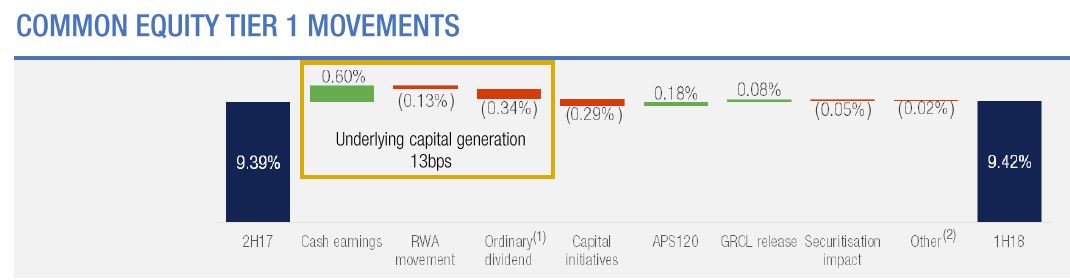
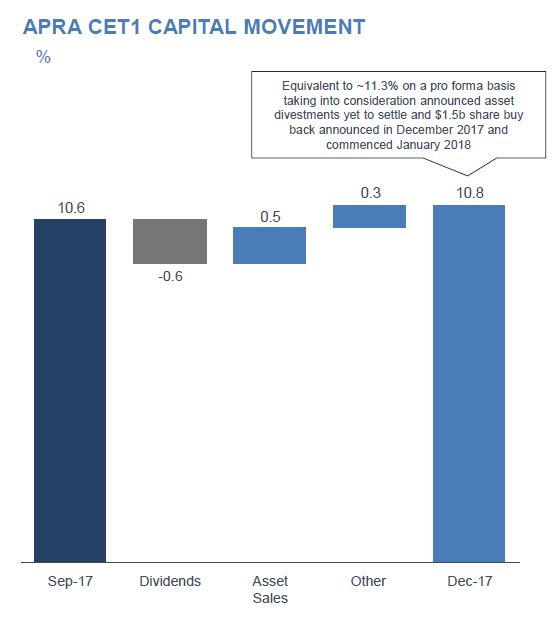
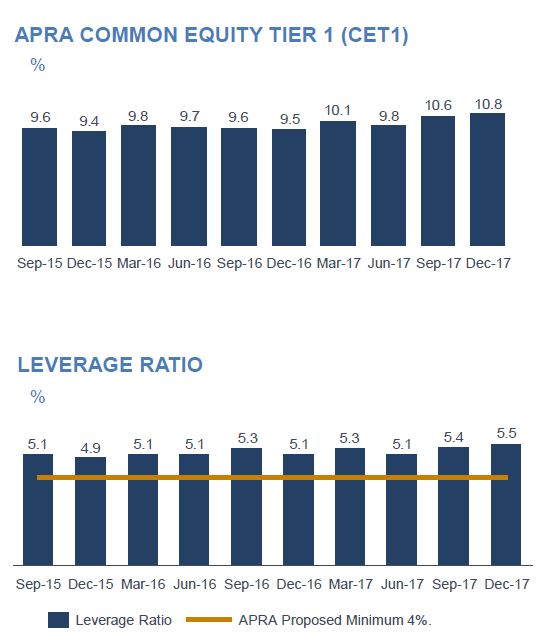
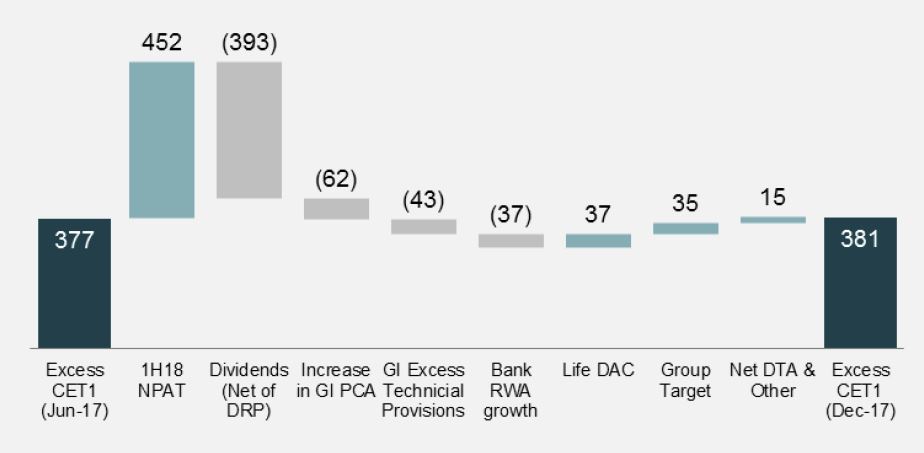
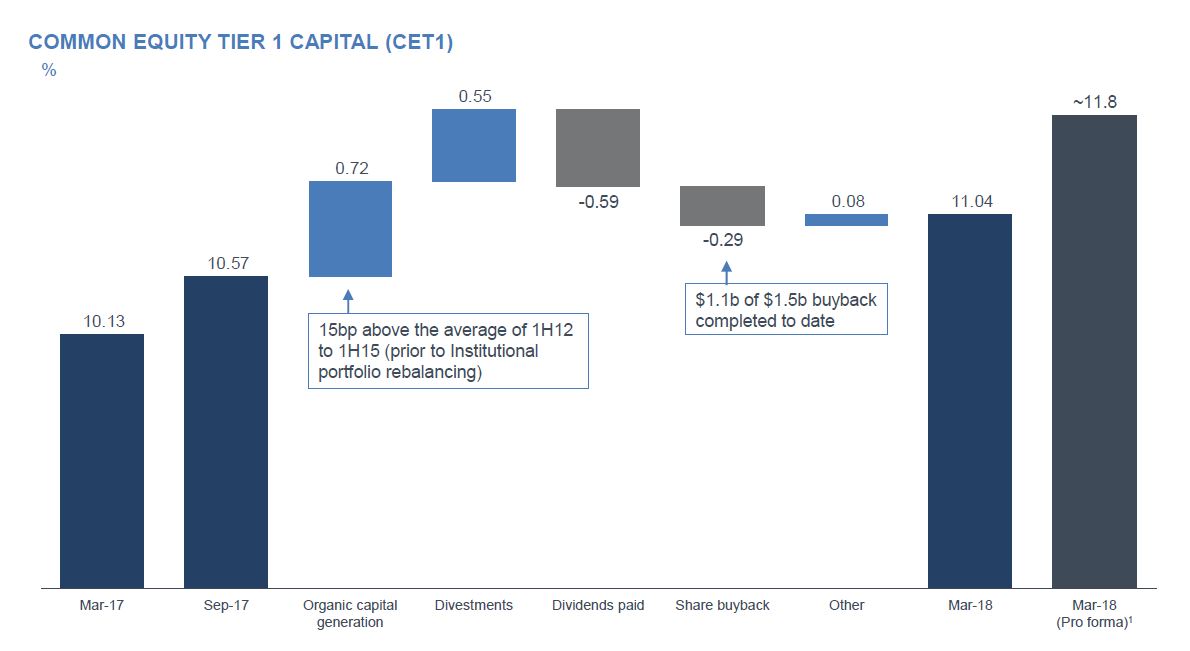
ANZ’s CET1 was 11.0%, up 91 basis points, or 16.3% on an international comparable basis.

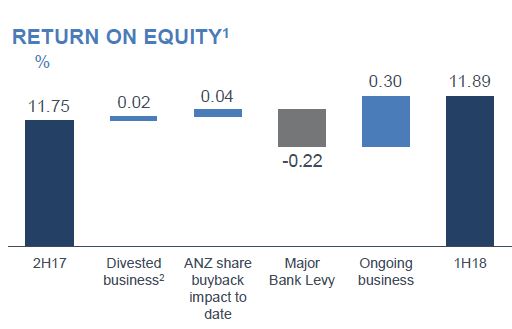
Their return on equity increased 32 basis points to 11.9% with cash earnings per share up 4% 10 119.4 cents.

They announced an interim dividend of 80 cents per share, a payout ratio of 66% of cash profit.

ANZ external legal costs relating to the Royal Commission will be around $50 million for 2018.  They say they cannot predict the outcome of the Inquiry or its impact on either the bank or the broader Industry.


Suncorp March 18 Update

Suncorp gave a quarterly update under Australian Prudential Standard 330.

Total lending grew 0.9%, or 5.4% year to date, slower than the first half.  Total lending assets grew $546 million to $58.3 billion over the quarter. Mortgage growth was 0.8% in the quarter, or $361 million. Investor and interest only loan mix declined.

They also reported some growth in the business portfolio.

Impairment losses for the quarter were 2 million or 1 basis point on gross loans (annualised), well below their 10-20 range through the cycle.

However, the % of loans past due rose.

NSFR was 112% and the CET1 ratio was 8.80.

They executed $4.2 billion in term wholesale issuance over the financial year to date, including both domestic and offshore, with an average weighted term of 3.3 years.

Subsequent to the March quarter they announced a $1.25 billion Residential Mortgage-backed Security transaction, which increased CET1 by around 13 basis points.


Bank of Queensland 1H 18 Results – Meh!

Bank of Queensland (BOQ) has announced cash earnings after tax of $182 million for 1H18, up 4 per cent on 1H17. This is weaker than expected. They continue to bat on a sticky wicket. Being a regional bank is a tough gig! The BOQ Board has maintained a fully franked interim dividend of 38 cents per ordinary share.

Statutory net profit after tax increased by 8 per cent to $174 million.

Net Interest Margin was up 1 basis point on the prior half to 1.97%, helped by loan book growth and deposit repricing, but under pressure thanks to intense new mortgage loan discounting. Growth in overall NIM was lower than expected. Ahead we think the higher BSBW rates will impact NIM adversely alongside discounted attractor rates..

In addition, lower than expected non-interest income hit the result, thanks to an ATM fee impact of $0.6m, banking fees under pressure and a fall in trading income opportunities.

Also higher than expected costs impacted the result. Their Cost to Income ratio was up 20 bps to 47.6%

BOQ also today announced the sale of St Andrew’s Insurance to Freedom Insurance Group. More detail on this transaction is provided in a separate announcement. The CET1 uplift was estimated at 20 basis points after completion, with completion expected in second half of the year.

The Banks says there has been a notable improvement in lending growth, continuing the positive business momentum that returned in the previous half. This was supported by the commercial niche segments, as well as home loan growth through the Virgin Money, BOQ Specialist and BOQ Broker channels. Total lending growth of $671 million in 1H18 represents an uplift of more than $800 million compared to the contraction of $157 million in 1H17.

This has been delivered through 3 per cent annualised housing loan growth (+$382 million) at 0.5x system, together with strong commercial loan growth of 6 per cent annualised (+$292 million), which was 1.6x system.

They show that broker settlements increased to 30%, including via Virgin Money, whilst the proportion of investment loans rose to 39%, compared with 30% a year ago. Interest only loans were 16% of flows, compared with 38% a year ago, and represents 32% of their portfolio.  The average loan balance has risen to $394k and the weighted average LVR on new loans was 68%.

“We moved to adopt enhanced servicing, validation and responsible lending practices much earlier than many of our peers” the bank said.

“Although this has hampered our growth in prior periods, we think it was the most prudent approach to take for the long term,” he said.

Impaired assets as a percentage of gross loans were down to 39 basis points, while loan impairment expense was just 10 basis points of gross loans during the half.

Arrears levels remained benign across all portfolios and there were signs of improvement in the Queensland and Western Australian economies. But they noted an uptick in the most recent quarter in housing …

… and consumer credit.

They also showed potential construction exposure to apartments – at $90m, at 16 developments across 3 states completing 2018 to 2019. They observed this was a well diversified cross-state portfolio.  But $53m is in Victoria.

They also have $100m exposure to the mining sector.

Loan impairment rose, but remained at 10 basis points of GLA. Impaired assets fell a further 10% from 2H17 and new impaired asset volumes also reduced to the lowest level since pre-2012.

Specific provisions were increased to 57%.

They say total provisions remain strong and provisional coverage compares favorably with peers.

BOQ’s capital position has been maintained. The CET1 ratio was up 3 basis points over the half to 9.42 per cent.

The bank said that the recent Basel and APRA papers suggest BOQ’s current CET1 ratio positions it well for the changes that are coming.

Ahead, they said that the industry was facing a number of headwinds, but BOQ remains well placed.

“The industry faces challenges of low credit growth, low interest rates, regulatory uncertainty, increasing consumer expectations and increased scrutiny of conduct and culture.

“In this environment, our long term strategy remains the right one; we are building out our business bank in higher growth sectors of the economy and opening up new retail channels.

“We also remain focused on our customers, investing in a number of initiatives across the group that will improve our digital offering, bring us closer to our customers and enable us to provide them with a differentiated service offering.

“Our very strong capital position provides us with flexibility to consider options that will deliver the best value to our shareholders,”

QBE’s Cyclical Deterioration In LMI

QBE Insurance reported their full year 2017 results today and  reported a statutory 2017 net loss after tax of $1,249 million, which compares with a net profit after tax of $844 million in the prior year.

This is a diverse and complex group, which is now seeking a path to rationalisation.  They declared their Asia Pacific result “unacceptable” and said the strategy was to “narrow the focus and simplify back to core” with a focus on the reduction in poor performing segments.

This begs the question. What is the status of their Lenders Mortgage Insurance (LMI) business? They reported a higher combined operating ratio consistent with a cyclical slowdown in the Australian mortgage insurance industry, higher claims and a lower cure rate. Very little detail was included in the results, but this aligns with similar experience at Genworth who reported a 26% drop in profit, the listed monoline and provides greater insight into the mortgage sector.

Both LMI’s are experiencing similar stresses, with lower premium income, and higher claims. And this before the property market really slows, or interest rates rise!  Begs the question, how secure are the external LMI’s?

QBE LMI reported a combined operating ratio of 50.7%, up from 34.9% in the prior year, largely reflecting an increase in the net claims ratio to 33.0% from 21.2% previously. The net claims ratio deteriorated due to a moderate increase in arrears rates, primarily related to properties located in mining towns in Western Australia and Queensland, coupled with an increase in the propensity for claims in arrears to generate claims (a reduced “cure” rate) and an increase in average claims severity. The commission ratio increased to 4.5% from 1.8% in the prior year, reflecting a lower exchange commission following the non-renewal of our external quota share reinsurance treaty. Note that QBE LMI (is required to) has their own reinsurance protection.

Notwithstanding reduced LMI earnings, Australian & New Zealand Operations’ combined operating ratio improved to 92.0%  from 92.4%  in the prior period, underpinned by a 1.8% improvement in the attritional claims ratio or 2.5% excluding LMI.

The overall results for the group includes the significant non-cash impairment of goodwill ($700 million) and write down of the deferred tax asset following the reduction in the US corporate tax rate ($230 million) in our North American Operations.

Overall, the results reflect the record cost of catastrophes in the second half of 2017 together with deterioration emerging markets businesses and two significant non-cash items. Notwithstanding comprehensive reinsurance protections, the net cost of catastrophes for QBE (after reinsurance) was $1,227 million in 2017 compared with $439 million in 2016.

Yellow Brick Road Benefits From Digital Strategy

Yellow Brick Road, the full service wealth management company that offers products and services for home loans, financial planning, insurance, superannuation, and investments, released their H1 FY18 results and reported an 85% increase in profitability with Net Profit Before Tax up to $0.53m (H1 FY17: $0.29m). This is the Company’s third successive profitable half. Higher revenue (up by 5%) and lower costs (down by 4%), have driven the improved result, together with an investment in digital, and a reduction in branch outlets. This though  contributed to a short-term decline in origination revenue – Lending down 6%, and Wealth down 12%.

Revenue growth included:

  • Strong increase in sustainable, recurring revenue streams, up by 17% to $47.8m (H1 FY17: $41.0m)
  • High-margin scale income grew by 22% to $1.8m (H1 FY17: $1.5m)
  • Increased recurring revenue helped Wealth revenue grow by 7% to $6.5m (H1 FY17: $6.1m)
  • New revenue stream of $0.5m in Training and Support recognised as part of ‘Other Income’. The introduction of the YBR Professional Development Platform is expected to drive future organic growth and new opportunities.

Underlying Loan Book, and Underlying Funds Under Management (FUM) have increased substantially, contributing to the 17% increase in recurring revenue (Wealth and Lending combined).

Key fundamentals underlying the Company’s financial performance for the 6 months to 31 December 2017 were:

  • 56% increase in underlying Funds under Management (FUM) to $1,446m
  • 20% increase in Premiums under Management (PUM) to $17.6m
  • 2% decrease in settlement volume to $7.74b
  • 14% increase in Underlying Loan Book, drawn value, to $46.1b

The small decline in Lending settlement volumes has been offset by improvements in high margin, scale income.

In H1 the Company invested $1.9m in technology to develop and enhance operational platforms. These strategic initiatives support future growth in profitability across the Company’s distribution networks. These include:

  • Money Manager Platform. Released to the network in Q2 FY18, this financial fitness digital tool will enhance the depth and extent of adviser client engagement and increase acquisition and retention.
  • Vow Lending Platform (Vownet): Industry-leading functionality to establish a significant point of difference for the Vow network.
  • Professional Development Platform: Intended to provide a new source of revenue and improve quality, consistency and risk and compliance assurance throughout the Company’s distribution network.
  • Business Reporting Platform: Automated reporting platform to enhance business agility and efficiency.

The YBR branch network has been rationalised to create a higher quality network. As a result, there has been a reduction in branch network numbers and a related decline in Lending and Wealth volumes. This contributed to a short-term decline in origination revenue – Lending down 6%, and Wealth down 12%.


Global Dividends Were Higher in 2017 (Australia Up 9.7%)

A strengthening world economy and rising corporate confidence pushed global dividends to a new high in 2017, according to the latest Janus Henderson Global Dividend Index. They rose 7.7% on a headline basis, the fastest rate of growth since 2014, and reached a total of $1.252 trillion.

Underlying growth, which adjusts for movements in exchange rates, one-off special dividends and other factors, was an impressive 6.8%, and showed less divergence than in previous years across the different regions of the world, reflecting the broadly based global economic recovery.

Every region of the world and almost every industry saw an increase. Moreover, records were broken in 11 of the index’s 41 countries, among them the United States, Japan, Switzerland, Hong Kong, Taiwan, and the Netherlands.

In Australia, dividends rose to $53.3bn, an increase of 9.7% on an underlying basis. The big story was the return of the mining companies, following rapid improvements in their profits and balance sheet. Between them, BHP and Rio Tinto added $2.9bn, accounting for two-thirds of all Australia’s dividend growth.

Among the banks, which pay more than half of all Australian dividends, and which have very high payout ratios, only Commonwealth Bank increased slightly year-on-year. Even so, no Australian company in our index cut its dividend, though QBE Insurance further reduced the tax credit it was able to provide, meaning that investors received less year-on-year after tax.

In 2017, CBA was the world’s 13th dividend payer (down from 12th the previous year), the only Australian firm in the top 20 according to the JH research.

2017 was a record year for Asia Pacific ex Japan. The total paid
jumped 18.8% to $139.9bn, boosted by exceptionally large special dividends in Hong Kong, of which the biggest by far was from China Mobile. Even allowing for these, and other factors elsewhere in the region, underlying growth was impressive at 8.6%. The jump in dividends paid in the region was just enough to push it ahead of North America as the fastest growing region since 2009.

They say that strong earnings growth around the world in 2018 will support continued dividend increases, with 6.1% underlying growth, with every region seeing an increase, plus a weaker dollar means expected headline growth of 7.7%, bringing total global dividends of $1.348 trillion in 2018.

Methodology.

Each year Janus Henderson analyses dividends paid by the 1,200 largest firms by market capitalisation (as at 31/12 before the start of each year). Dividends are included in the model on the date they are paid. Dividends are calculated gross, using the share count prevailing on the pay-date (this is an approximation because companies in practice fix the exchange rate a little before the pay date), and converted to USD using the prevailing exchange rate.


AFG 1H18 Results up 11%

Australian Finance Group (AFG) has today released half yearly results for 2018 with underlying NPAT in H1 FY2018 of $14.4m, up 11% on H1 FY2017, and a reported NPAT in H1 FY2018 of $16.7m.

Residential settlements were up 6% to $18.6b (interesting compared with Mortgage Choice’s 6% fall!) and their combined residential and commercial loan book is $140.8 billion with growth of 11% over H1 FY2017.

Settlements were strongest in NSW, then VIC. But growth in VIC was significantly stronger and it may overtake NSW ahead.  AFG Home Loans (AFGHL) continued to deliver positive financial growth and settlements grew 31% to $1.62 billion.  Lodgements were up 7%, servicing more than 17,000 customers.

The AFGHL loan book has reached $6.5 billion, an increase of 40% on the same period last year. AFGHL now represents 8.7% of overall AFG Residential settlements – up from 7.8% in FY17

Strong organic growth and cash flow generation of the business has allowed AFG to pay a Special Dividend of 12 cents per share.

AFG Securities completed a successful $350m Residential Mortgage Backed Securities (RMBS) issue in October 2017, which underlined the performance of the AFG Securities business.

AFG’s commercial business experienced loan book growth in all states despite softer settlements.

The overall commercial loan book grew by 14% to $7.2 billion. This growth has been driven by a 6% increase in sub-$5m commercial mortgage settlements and a 26% increase in asset finance.

Settlements slipped in NSW, but grew in VIC.

AFG Business has a current panel of five core lenders aimed at the small to medium enterprise (SME) market. Further business lending lines will be added as the platform is rolled out to more brokers looking to diversify their offering.

AFG had over 2,900 active brokers at 31 December 2017, further extending AFG’s national distribution network providing quality lending solutions and service to consumers. Growth continues to be strong in NSW and Victoria, offset by weaker conditions in other states.

The return on equity was 33% and they announced an interim dividend of 4.7c per share fully franked plus a special dividend of 12c per share fully franked

Mortgage Choice Profit Up As Home Lending Settlement Volumes Dip

Mortgage Choice reported their FY18 1H results yesterday and gave us a good snapshot of their diversification from just a mortgage provider to a broader financial service provider, across car loans, personal loans, credit cards, commercial loans, asset finance, deposit bonds, and risk and general insurance.

On one hand profit was up 7% on a cash basis reached $12.5 million, up from $11.7 million in 1H17. Net profit after tax was $11.4 million, consistent with the result in 1H17. They grew their total loan book $54.0 billion, up 3.2% from $52.4 billion in 1H17, but they settled $6.0 billion in home loans 1H18, down 6% from $6.4 billion in 1H17. All states except Vic/Tas saw a fall. with the largest drop in WA (24%).

Then again, financial planning Funds Under Advice climbed 49.9% from 1H17 to $634.2 million in 1H18.

Broking accounted for 88.2% of the company’s gross revenues in the first half of FY18, down from 90.2% in the same period of FY17, while the proportion of gross revenue from non-residential lending went up to 11.8%.

While the company’s number of broking franchises went up to 452 from 449 in the six months to June 2017, its number of brokers or credit representatives was slightly down to 649 by end-December, from 654 six months ago.

Origination and trail commissions received fell by 3.0% to $84.64m on a cash basis from $87.23m in the first half of FY17. The average upfront rate was 0.6538%.  Reduced expected run-offs has lifted trail projections.

(The black line represents the average rate of new settlements post GFC changing commissions)

Gross revenue growth from financial planning and diversified products, up 15.3% and 12.7% respectively, helped offset the decline in revenue from broking commissions, proving the merit of its diversification strategy.

“Home settlements are down slightly half on half due to changing market conditions, in particular, tightening lending policies, which can impact conversion from approval to settlement,” chief executive John Flavell told Australian Broker.

To increase broker productivity, it launched a new website in January and is launching a new broker platform in phases starting this month. Bolstering its brand presence involves growing the number of its retail shopfronts and launching a new advertising


ANZ Capital Update 1Q18

ANZ Banking Group released their 1Q update today.  Overall capital ratios are up, with their Common Equity Tier 1 (CET1) ratio at 10.82% at Dec-17, 25bp increase from Sep-17. Dec-17. CET1 ratio includes the proceeds of the sale of Shanghai Rural Commercial Bank stake and a small benefit from the sale of the Asian retail and wealth businesses (Taiwan & Vietnam settlements in the December quarter).

Funding and liquidity position remains strong with LCR 131% (Dec-17
quarter avg) and NSFR 114% (as at 31-Dec-17).
Total Risk Weighted Assets (RWA) increased $2.4b, including a $2.3b increase in Credit RWA, with growth in Residential Mortgages, Corporate and Bank Pillar 3 categories.

Home lending portfolio grew at 1.2 times system in the December quarter, with Owner Occupied growth of 10% annualised (1.4 times system), Investor growth of 2% annualised.Interest only new business in the December quarter (1Q18) represented 14.3% of total new business flows. $5.7b of interest only loans switched to principal and interest in 1Q18, compared with $9.5b in 4Q17 and $4.3b per quarter on average across 1Q17 to 3Q17.Total provision charge of $202m in 1Q18 with individual provision charge of $220m.

Residential Mortgage 90+ day past due loans (as a % of Residential Mortgage EAD) increased by 1bp.

Suncorp HY18 Profit Down 15%

Suncorp released their Hy18 results today. Reported net profit before tax was $452 million, down 15.8% on pcp.  They explain this fall in terms of the impact of the damaging Victorian hailstorm that occurred just prior to the balance date, as well as the significant investment in their two major programs.

The management are doing the right things to get the business onto a stronger revenue and profit generating position, but still have risks relating to the future share of home lending, and ongoing natural hazards. Their digital strategy is beginning to pay dividends, but there is more to do. APRA’s recent announcements on capital ratios means the advanced capital approach will likely be less beneficial.

The result included the Business Improvement Program investment of $50 million, Marketplace spend of $36 million, with Natural Hazards $65 million unfavourable to allowance, driven primarily by the Victorian hail storm. Natural hazards were $395 million overall.

The Group’s top line growth was 2.5% driven by strong momentum in both Consumer General Insurance and Banking: Australian Home and Motor Insurance Gross Written Premium (GWP) up 3.9%; Bank lending growth 8.7%, well above system; Australian Life Insurance underlying profit after tax increased to $39 million, up 56% and New Zealand General Insurance achieved GWP growth of 7.6%

Total operating expenses increased 3.3 per cent, excluding the Business Improvement Program, and 5.7 per cent when including the net investment in the program.

Their $2.7 billion Business Improvement Program will reset the cost base and they foresee stronger growth ahead (presumably large insurance claims permitting!). The net benefits this year will be $10 million but that grows quickly to an expected $195 million next year, and $329 million in FY20.

Digital interactions are up 19% since this time last year. This has contributed to a 10% reduction in complaints.

In FY19, they are committing to a $2.7 billion cost base despite expected volume growth, and inflation.

The interim dividend was 33 cents, reflecting a payout ratio of 90%.

Looking across the divisions:

Insurance (Australia) – NPAT of $264 million was down 28.5 per cent as solid growth in net earned premiums was offset by higher natural hazard costs and the impact of investment in the Business Improvement Program.
GWP growth for Home and Motor Insurance was 3.9 per cent, driven by unit growth and price increases, while GWP growth in Commercial lines was 1.5 per cent for HY18. CTP premium growth was impacted by scheme reform in NSW and Queensland.

Net incurred claims costs were up 14.7 per cent, reflecting higher natural hazard costs.

Investment income on the insurance funds was $120 million. The headline result was supported by mark-to-market gains from narrowing credit spreads and the outperformance of inflation-linked bonds. This was offset by mark-to-market losses from an increase in risk-free rates. The underlying portfolio yield was $106 million, or 2.3% annualised, which is slightly below our expectation of around 80 basis points above the risk-free rate.

Australian Life Insurance underlying profit after tax was $39 million, up 56 per cent for the half, reflecting benefits of repricing and the ongoing focus of the optimisation program.

Banking & Wealth– delivered an NPAT of $197 million for the half, down 5.3 per cent on HY17, with good top line growth, offset by investment in the Business Improvement Program. Lending growth of 8.7 per cent reflected strong consumer and commercial lending momentum within Suncorp’s risk appetite.

Net interest margin (NIM) of 1.86 per cent remained strong supported by asset repricing and efficient funding.

Business credit quality was strong over the period. Impairment losses of $13 million, representing 4 basis points, remain well below the long‐run range

New Zealand – achieved a profit after tax of NZ$67 million (A$61 million) for the half year, an improvement of 81 per cent over the prior corresponding period. GWP growth was 7.6 per cent (in NZ dollar terms), with good performance across all channels (on a like for like basis, excluding the impact of the sale of Autosure in FY17, GWP increased 10.4%). Strong new business and retention rates delivered in‐force premium growth of 5 per cent (in NZ dollar terms).

After payment of the dividend, the franking account balance will be $158 million. The Group is well capitalised with $381 million in CET1 capital held above its operating targets.

Suncorp remains committed to returning excess capital to shareholders.

With regards to advanced capital management (IRB) they said:

While the pathway to advanced status has been more protracted than we had originally anticipated, we continue to work constructively with the Regulator to clarify the next steps in this process and the associated Basel 3 and ‘unquestionably strong’ capital requirements.