The Housing Boom Is “Officially” Over – The Property Imperative 07 Apr 2018

Welcome to the Property Imperative Weekly to 07 April 2018.

Watch the video, or read the transcript.

In this week’s digest of finance and property news, we start with Paul Keating’s (he of the recession we had to have fame), comment that the housing boom is really over at the recent AFR conference.

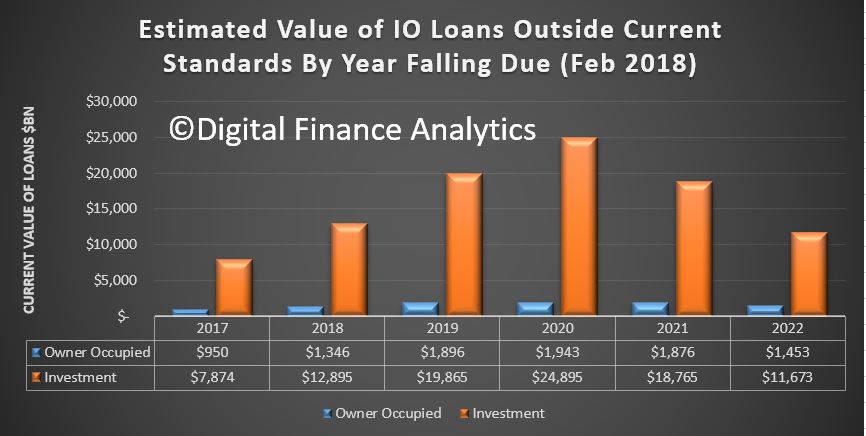
He said that the banks were facing tighter controls as a result of the Basel rules on capital adequacy, while financial regulators had had a “gutful” of them. This was likely to lead to changes that would restrict the banks’ ability to lend. He cited APRA’s recent interventions in interest only loans as one example, as they restrict their growth. Keating also said the royal commission into misconduct in the banking and financial services sector would also “make life harder” for the banks and pointed out that banks did not really want to lend to business these days and would “rather just do housing loans”. Finally, he spoke of the “misincentives” within the big banks to grow their business by writing new mortgages, including having a high proportion of interest-only lending.

Anna Bligh speaking at the AFR event, marked last Tuesday her first year as CEO of the Australian Banking Association (ABA) – but said she feels “like 500 years” have already passed. Commenting on the Royal Commission she warned that credit could become tighter ahead. The was she said an opportunity for a major reset, not only in how we do banking but how we think about it, its place in our lives, its role in our economy and, most of all, it’s trustworthiness”.

At the same conference, Rod Simms the Chair of the ACCC speech “Synchronised swimming versus competition in banking” He discussed the results of their recent investigation into mortgage pricing, and also discussed the broader issues of competition versus financial stability in banking. He warned that the industry should be aware of, and respond to, the fact that the drive for consumers to get a better deal out of banking is shared by many beyond the ACCC. Every household in Australia is watching.  You can watch our video blog on this for more details.

He specifically called out a lack of vigorous mortgage price competition between the five big Banks, hence “synchronised swimming”. Indeed, he says discounting is not synonymous with vigorous price competition. They saw evidence of communications “referring to the need to avoid disrupting mutually beneficial pricing outcomes”.

He also said residential mortgages and personal banking more generally make one of the strongest cases for data portability and data access by customers to overcome the inertia of changing lenders.

Finally, on competition. he says if we continue to insulate our major banks from the consequences of their poor decisions, we risk stifling the cultural change many say is needed within our major banks to put the needs of their customers first. Vigorous competition is a powerful mechanism for driving improved efficiency, and also for driving improved price and service offerings to customers. It can in fact lead to better stability outcomes.

This puts the ACCC at odds with APRA who recent again stated their preference for financial stability over competition – yet in fact these two elements are not necessarily polar opposites!

Then there was the report from the good people at UBS has published further analysis of the mortgage market, arguing that the Royal Commission outcomes are likely to drive a further material tightening in mortgage underwriting. As a result, they think households “borrowing power” could drop by ~35%, mainly thanks to changes to analysis of expenses, as the HEM benchmark, so much critised in the Inquiry, is revised. Their starting point assumes a family of four has living expenses equal to the HEM ‘Basic’ benchmark of $32,400 p.a. (ie less than the Old Age Pension). This is broadly consistent with the Major banks’ lending practices through 2017. As a result, the borrowing limits provided by the banks’ home loan calculators fell by ~35% (Loan-to-Income ratio fell from ~5-6x to ~3-4x). This leads to a reduction in housing credit and a further potential fall in home prices.

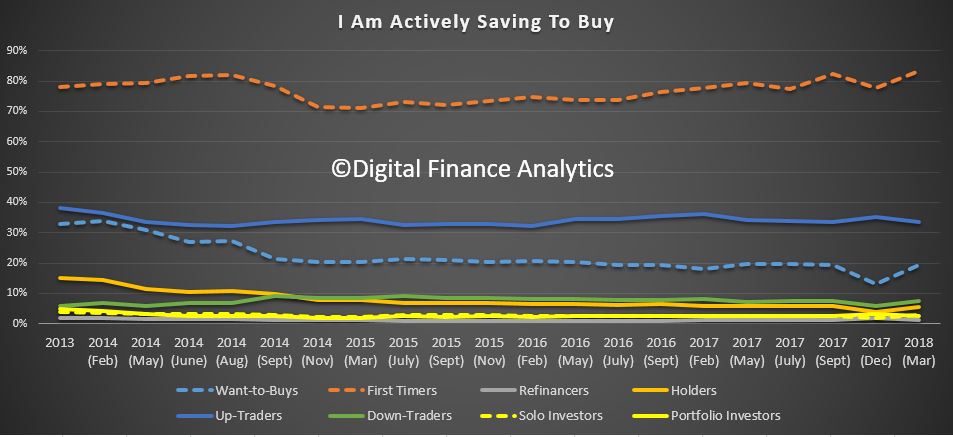
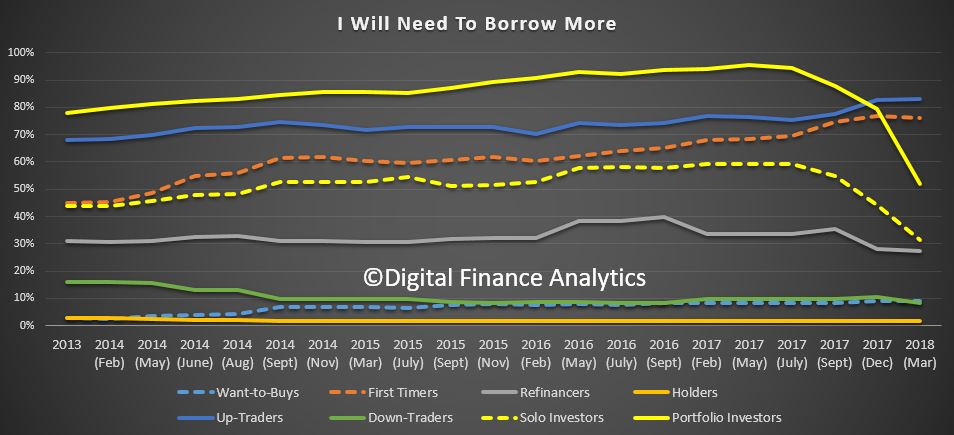
Our latest mortgage stress data, which was picked by Channel Nine and 2GB, thanks to Ross Greenwood, Across Australia, more than 956,000 households are estimated to be now in mortgage stress (last month 924,500). This equates to 30.0% of households. In addition, more than 21,000 of these are in severe stress, no change from last month. We estimate that more than 55,000 households risk 30-day default in the next 12 months. We expect bank portfolio losses to be around 2.8 basis points, though with losses in WA are higher at 4.9 basis points.  Flat wages growth, rising living costs and higher real mortgage rates are all adding to the burden. This is not sustainable and we are expecting lending growth to continue to moderate in the months ahead as underwriting standards are tightened and home prices fall further”. The latest household debt to income ratio is now at a record 188.6. You can watch our separate video blog on this important topic.

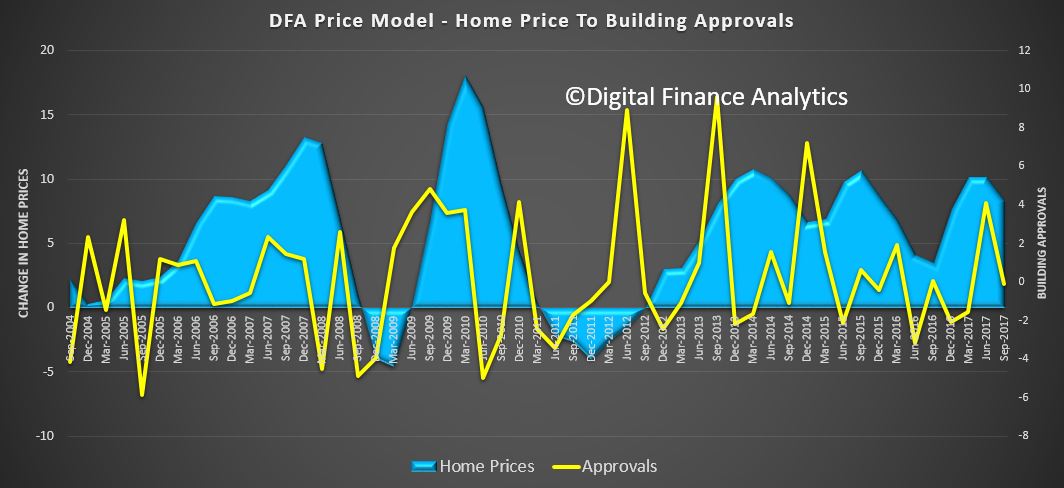
ABS data this week showed The number of dwellings approved in Australia fell for the fifth straight month in February 2018 in trend terms with a 0.1 per cent decline. Approvals for private sector houses have remained stable at around 10,000 for a number of months. But unit approvals have fallen for five months. Overall, building activity continues to slow from its record high in 2016. And the sizeable fall in the number of apartments and high density dwellings being approved comes at a time when a near record volume are currently under construction. If you assume 18-24 months between approval and completion, then we still have 150,000 or more units, mainly in the eastern urban centres to come on stream. More downward pressure on home prices. This helps to explain the rise in 100% loans on offer via some developers plus additional incentives to try to shift already built, or under construction property.

CoreLogic reported  last week’s Easter period slowdown saw 670 homes taken to auction across the combined capital cities, down significantly on the week prior when a record number of auctions were held (3,990). The lower volumes last week returned a higher final clearance rate, with 64.8 per cent of homes selling, increasing on the 62.7 per cent the previous week.  Both clearance rate and auctions volumes fell across Melbourne last week, with only 152 held and 65.5 per cent clearing, down on the week prior when 2,071 auctions were held across the city returning a slightly higher 65.8 per cent success rate.

Sydney had the highest volume of auctions of all the capital city auction markets last week, with 394 held and a clearance rate of 67.9 per cent, increasing on the previous week’s 61.1 per cent across a higher 1,383 auctions.

Across the smaller capital cities, clearance rates improved week-on-week in Canberra, Perth and Tasmania; however, volumes were significantly lower across each market last week compared to the week prior.

Across the non-capital city auction markets, the Geelong region recorded the strongest clearance rate last week with 100 per cent of the 20 auction results reporting as successful.

The number of homes scheduled to go to auction this week will increase across the combined capital cities with 1,679 currently being tracked by CoreLogic, up from last week when only 670 auctions were held over the Easter period slowdown.

Melbourne is expected to see the most significant increase in volumes this, with 669 properties scheduled for auction, up from 152 auctions held last week. In Sydney, 725 homes are set to go to auction this week, increasing on the 394 held last week.

Outside of Sydney and Melbourne, each of the remaining capital cities will see a higher number of auctions this week compared to last week.

Overall auction activity is set to be lower than one year ago, when 3,517 were held over what was the pre-Easter week last year.

Finally, with local news all looking quite negative, let’s look across to the USA as the most powerful banker in the world, JPMorgan Chase CEO Jamie Dimon, just released his annual letter to shareholders.  Given his bank’s massive size (it earned $24.4 billion on $103.6 billion in revenue last year) and reach (it’s a giant in consumer/commercial banking, investment banking and wealth management), Dimon has his figure on the financial pulse.

He says that’s while the US economy seems healthy today and he’s bullish for the “next year or so” he admits that the US is facing some serious economic headwinds.

For one, he’s concerned the unwinding of quantitative easing (QE) could have unintended consequences. Remember- QE is just a fancy name for the trillions of dollars that the Federal Reserve conjured out of thin air.

He said – Since QE has never been done on this scale and we don’t completely know the myriad effects it has had on asset prices, confidence, capital expenditures and other factors, we cannot possibly know all of the effects of its reversal.

We have to deal with the possibility that at one point, the Federal Reserve and other central banks may have to take more drastic action than they currently anticipate – reacting to the markets, not guiding the markets.

And of course the DOW finished the week on a down trend, down 2.34%, and wiping out all the value gained this year, and volatility is way up. Here is a plot of the DOW.

This extreme volatility does suggest the bull market is nearing its end… if it hasn’t ended already. Dimon seems pretty sure we’re in for more volatility and higher interest rates. One scenario that would require higher rates from the Fed is higher inflation:

If growth in America is accelerating, which it seems to be, and any remaining slack in the labor markets is disappearing – and wages start going up, as do commodity prices – then it is not an unreasonable possibility that inflation could go higher than people might expect.

As a result, the Federal Reserve will also need to raise rates faster and higher than people might expect. In this case, markets will get more volatile as all asset prices adjust to a new and maybe not-so-positive environment.

Now– here’s the important part. For the past ten years, the largest buyer of US government debt was the Federal Reserve. But now that QE has ended, the US government just lost its biggest lender.

Dimon thinks other major buyers, including foreign central banks, the Chinese, etc. could also reduce their purchases of US government debt. That, coupled with the US government’s ongoing trade deficits (which will be funded by issuing debt), could also lead to higher rates…

So we could be going into a situation where the Fed will have to raise rates faster and/ or sell more securities, which certainly could lead to more uncertainty and market volatility. Whether this would lead to a recession or not, we don’t know.

We’ll leave you with one final point from Jamie Dimon. He acknowledges markets have a mind of their own, regardless of what the fundamentals say. And he sees a real risk “that volatile and declining markets can lead to a market panic.”

Financial markets have a life of their own and are sometimes barely connected to the real economy (most people don’t pay much attention to the financial markets nor do the markets affect them very much). Volatile markets and/or declining markets generally have been a reaction to the economic environment. Most of the major downturns in the market since the Great Depression reflect negative future expectations due to a potential or real recession. In almost all of these cases, stock markets fell, credit losses increased and credit spreads rose, among other disruptions. The biggest negative effect of volatile markets is that it can create market panic, which could start to slow the growth of the real economy. Because the experience of 2009 is so recent, there is always a chance that people may overreact.

Dimon cautioned investors that interest rates could rise much sooner than they expect. If inflation suddenly comes roaring back. Indeed, it’s entirely possible the 10-year could break above 4% in the near future as inflation returns to 2% and the Fed shrinks its balance sheet.

Dimon also cast a wary eye toward exchange-traded funds, which have seen their popularity multiply since the financial crisis. There are now many ETF products that are considerably more liquid than their underlying assets. In fact far more money than before (about $9 trillion of assets, which represents about 30% of total mutual fund long-term assets) is managed passively in index funds or ETFs (both of which are very easy to get out of). Some of these funds provide far more liquidity to the customer than the underlying assets in the fund, and it is reasonable to worry about what would happen if these funds went into large liquidation.

And Finally America’s net debt currently stands at 77% of GDP (this is already historically high but not unprecedented). The chart below also shows the Congressional Budget Office’s estimate of the total U.S. debt to GDP, assuming a 2% real GDP growth rate. Hopefully, with the right policies they can grow faster than 2%. But more debt does seem on the cards.

And to add to that perspective, we spoke about the recent Brookings report which highlighted the rise in non conforming housing debt in the USA. debt as lending standards are once again being loosened, and risks to mortgage services are rising.

The authors quote former Ginnie Mae president Ted Tozer concerning the stress between Ginnie Mae and their nonbank counterparties.

… Today almost two thirds of Ginnie Mae guaranteed securities are issued by independent mortgage banks. And independent mortgage bankers are using some of the most sophisticated financial engineering that this industry has ever seen. We are also seeing greater dependence on credit lines, securitization involving multiple players, and more frequent trading of servicing rights and all of these things have created a new and challenging environment for Ginnie Mae. . . . In other words, the risk is a lot higher and business models of our issuers are a lot more complex. Add in sharply higher annual volumes, and these risks are amplified many times over. . . . Also, we have depended on sheer luck. Luck that the economy does not fall into recession and increase mortgage delinquencies. Luck that our independent mortgage bankers remain able to access their lines of credit. And luck that nothing critical falls through the cracks…

They say that goldfish have the shortest memory in the Animal Kingdom… something like 3-seconds. But not even a decade after these loans nearly brought down the entire global economy, SUBPRIME IS BACK. In fact it’s one of the fastest growing investments among banks in the United States. Over the last twelve months the subprime volume among US banks doubled, and it’s already on pace to double again this year.

What could possibly go wrong?

March Home Prices On The Slide (Some Regional Areas Excepted)

CoreLogic has released their March Index results. Their hedonic home value index showed national dwelling values were unchanged in March, with the steady month on month reading comprised of a 0.2% fall in capital city dwelling values while the combined regional markets saw values rise by 0.4%.

Trends across the March quarter showed that capital city home values were 0.9% lower over the March quarter, while values across the regional markets have tracked 1.1% higher. Focusing on the capital cities, six of the eight capital cities have recorded a fall in values over the first quarter of 2018, ranging from a 1.8% drop in Sydney values to a 0.1% fall in Darwin.

Sydney unit values are up 1.9% over the past twelve months, while house values are down 3.8%. Similarly in Melbourne, unit values are 6.6% higher over the past twelve months while house values  are up just 4.9%.

Movements were stronger in some regional centers, with Geelong the strongest over the past year, and Outback Queensland the weakest.

The Property Imperative Weekly – 31 March 2018

Welcome to the Property Imperative Weekly to 31st March 2018.

Watch the video or read the transcript.

In this week’s review of property and finance news we start with the latest CoreLogic data on home price movements.

Looking at their weekly index, after last week’s brief lift, values fell 0.17% in the past week and as a result Sydney home values have now declined by a cumulative 4.2% over the past 29-weeks, with values also down 4.1% over the past 34 weeks. Sydney’s quarterly growth rate remains firmly negative, down 1.8% according to CoreLogic and annual growth is also down 2.2%.

More granular analysis shows the most significant falls in higher value property, and also in high-rise apartments. Our own analysis, and feedback from our followers is that asking prices are falling quite consistently now, and the same trend is to be see in Brisbane and Melbourne, our largest markets. This despite continued strong migration. We see two trends emerging, more people getting desperate to sell, so putting their property on the market, and having to accept a deeper discount to close a sale.

As we showed this week in our separate videos on the latest results from our surveys, down traders in particular are seeking to release capital now, and there are more than 1 million who want to transact. On the other hand investors are fleeing, though some are now also being forced to sell thanks to the switch from interest only to more expensive principal and interest loans.

This is all consistent with the latest auction results, which Corelogic also reported. They said that volumes last week broke a new record with 3,990 homes taken to auction across the combined capital cities in the lead up to Easter, which exceeded the previous high of 3,908 over the week ending 30th November 2014. The preliminary clearance rate was reported at 65.5%, but the final auction clearance rate fell to 62.7 per cent last week, down from 66.0 per cent across 3,136 auctions the previous week. Over the same week last year, 3,171 auctions were held, returning a significantly stronger clearance rate (74.5 per cent).

CoreLogic said that Melbourne’s clearance rate last week was 65.8 per cent across 2,071 auctions, making it the busiest week on record for the city. In comparison, there were 1,653 auctions held across the city over the previous week, returning a clearance rate of 68.7 per cent. This time last year, 1,607 homes were taken to auction, and a clearance rate of 78.9 per cent was recorded. Sydney was host to 1,383 auctions last week, the most auctions held across the city since the week leading up to Easter 2017 (1,436), while over the previous week, 1,093 auctions were held. The clearance rate for Sydney fell to 61.1 per cent, down from 64.8 per cent over the previous week, while this time last year, Sydney’s clearance rate was a stronger 75.8 per cent.

Across the smaller auction markets, auction volumes increased week-on-week, however looking at clearance rates, Adelaide (64.6 per cent) and Canberra (69.1 per cent) were the only cities to see a slight rise in the clearance rate over the week.

The Gold Coast region was the busiest non-capital city region last week with 87 homes taken to auction, while Geelong recorded the highest clearance rate at 79.7 per cent across 75 auctions.

Given the upcoming Easter long weekend, auction volumes are much lower this week with only 540 capital city auctions scheduled; significantly lower than last week when 3,990 auctions were held across the combined capital cities.

The next question to consider is the growth in credit. As we discussed in a separate blog, credit for housing, especially owner occupied mortgages is still running hot.  The smoothed 12 months trends from the RBA, out last Thursday, shows annualised owner occupied growth registering 8.1%, up from last month, investor lending falling again down to 2.8% annualised, and business credit at just 3.6%

Looking at the relative value of lending, in seasonally adjusted terms, owner occupied credit rose 0.71% to $1.15 trillion, up $8.08 billion, while investment lending rose 0.12% to $588.3 billion, up just 0.69 billion. Business lending rose 0.17% to $905 billion, up 1.55 billion and personal credit fell 0.15%, down 0.22 billion to $152.2 billion.

Note that the proportion of investment loans fell again down to 33.9%, and the proportion of business lending to all lending remained at 32.4%, and continues to fall from last year. In other words, it is owner occupied housing which is driving credit growth higher – if this reverses, there is a real risk total credit grow will run into reverse. Again, we see the regulators wishing to continue to drive credit higher, to support growth and GDP, yet also piling on more risks, when households are already terribly exposed. They keep hoping business investment and growth will kick in, but their forward projections look “courageous”. Remember it was housing consumption and Government spending on infrastructure which supported the last GDP numbers, not business investment.

Now, let’s compare the total housing lending from the RBA of $1.74 trillion, which includes the non-banks (though delayed, and partial data), with the APRA $1.61 trillion. The gap, $130 billion shows the non-bank sector is growing, as historically, the gap has been closer to $110 billion. This confirms the non-bank sector is active, filling the gap left by banks tightening. Non-banks have weaker controls on their lending, despite the new APRA supervision responsibilities. This is an emerging area of additional risk, as some non-banks are ready and willing to write interest only and non-conforming loans, supported by both new patterns of securitisation (up 13% in recent times) and substantial investment funds from a range of local and international investors and hedge funds.

Once again, we see the regulators late to the party.  This continues the US 2005-6 playbook where non-conforming loans also rose prior to the crash. We are no different.

The ABS released more census data this week, and focussed on the relative advantage and disadvantage across the country. Ku-ring-gai on Sydney’s upper north shore is Australia’s most advantaged Local Government Area (LGA). Another Sydney LGA, Mosman, which includes the affluent suburbs of Balmoral, Beauty Point and Clifton Gardens, has also been ranked among the most advantaged. In fact, SEIFA data shows the 10 most advantaged LGAs in Australia are all located around the Northern and Eastern areas of Sydney Harbour and in coastal Perth.

The most disadvantaged LGA is Cherbourg, approximately 250 kilometres north-west of Brisbane (QLD), followed by West Daly (NT). The 10 most disadvantaged LGAs in Australia can be found in Queensland and the Northern Territory.

The latest data has found that more than 30 per cent of people born in China, South Africa and Malaysia live in advantaged areas and less than 10 per cent reside in disadvantaged areas. Meanwhile, 40 per cent of Vietnamese-born live in disadvantaged areas and only a small proportion (11 per cent) live in advantaged areas.

People of Aboriginal and/or Torres Strait Islander origin are more likely to live in the most disadvantaged areas with 48 per cent living in the bottom fifth most disadvantaged LGAs, compared to 18 per cent of non-Indigenous people. Overall, only 5.4 per cent of Aboriginal and/or Torres Strait Islander people live in areas of high relative advantage compared with 22 per cent of non-Indigenous people.

What the ABS did not show is that there is a strong correlation of those defined as advantaged to valuable real estate – home price rises have both catalysed the economic disparities across the country, and of course show the venerability that more wealthy areas have should home prices fall further. The paper value of property is largely illusory, and of course only crystallises when sold.

The HIA reported that new home sales declined for the second consecutive month during February 2018 overall, but the markets were patchy, based on results contained in the latest edition of their New Home Sales report – a monthly survey of the largest volume home builders in the five largest states.

Despite the fact that the overall volume of sales declined during February, reductions only occurred in two of the five states covered by the HIA New Home Sales Report – the magnitude of these reductions outweighed the increases which took place elsewhere. The largest fall was in Queensland (-16.3 per cent) with a 9.9 per cent contraction recorded in WA. The largest increase in sales was in NSW (+11.7 per cent), followed by SA (+10.3 per cent) and Victoria (+4.8 per cent).

Finally, we walked through our survey results in a series of separate videos, but in summary, the latest release of the Digital Finance Analytics Household Survey to end March 2018, helps to explain why we think home prices are set to fall further by drawing on our 52,000 sample, from across Australia.

This chart, which looks across our property segments, shows that both portfolio property investors (who hold multiple properties) and solo investors (who hold one, or perhaps two) intentions to transact are tanking, down 8% since December 2017. This is because credit is less available, capital growth has stalled, and in fact only the tax breaks remain as an incentive! This decline started in 2015, but is accelerating.  Remember that around one thirrd of mortgages are for investment purposes, so as this demand dissipates, the floor on prices starts to shatter.

Whilst there are offsetting rises from down traders (who are seeking to release capital before prices fall further) and first time buyers (who are being “bribed” by first owner grants) there is a significant net fall in demand. This pattern is seen across the country, but is most prevalent in our two biggest markets of Sydney and Melbourne.

Refinancing is up a little, thanks to the attractive discounts being offered by many lenders, and the prime driver is to reduce monthly repayments, as currently household finances are under pressure. We release the latest mortgage stress analysis in a few days.

And if you want to think about the consequences of all this, then watch our commentary on the Four Scenarios which portrays how the property and finance sector may play out, and compare the comments from APRA with those in Ireland in 2007 in our latest video blog – they are eerily similar, and we all know what happened there!

The outlook for finance and property in Australia in decidedly uncertain.

What governments can learn from Perth’s property market

From The Conversation

Governments can encourage more affordable housing by targeting first home buyer subsidies to specific locations and housing types, a new report finds. It also suggests incentivising developers and builders to create smaller houses with more cost-efficient designs.

The report is based on the housing market in Perth, Western Australia, and shows that historically building single houses as opposed to units or town houses is a more effective way of delivering affordable housing on the city fringes.

The report examined housing affordability through individual transaction records over a six year sample period. It compared prices between established and new housing, showing that new land and building developments play important roles in supplying affordable housing options.

New dwellings comprise 13% of single house transactions and 33% for dwellings such as apartment or townhouses. Although new dwellings like apartments provided some affordable housing options, in general they are selling at a premium over existing houses.

Australia’s largest cities, like Perth, are stretched to the limit of land supply and infrastructure for affordable housing. The most infrastructure exists in city centres where houses are expensive.

Over the past two decades Perth has grown rapidly. Between 2001 and 2016 the population increased by 46.7%, the largest proportional increase of any Australian capital city. The make-up of the housing market is similar to other capitals: 68% of the housing stock is single houses, 20% other dwellings and 11% vacant.

Levels of home ownership are generally consistent with the national pattern: 62% of housing is owned outright or mortgaged, and 24% rented.

House prices have grown rapidly. From 1999 to 2016 house prices grew at an average annual rate of 8.4%; other dwellings grew 9%. Both sectors report the highest annual increases for all Australian capital cities over this period.

How can governments help?

The challenge in Australia’s housing market is supplying an adequate range of affordable new dwelling types within a range of suitable locations – both inner city and outer suburban choices.

Clusters of cheaper housing on the urban fringe and more expensive inner-city development suggest new building activity is confined to specific locations. These are defined by the price the constructor or buyer is willing to pay.

Housing policy in Australia has relied on market outcomes to determine aesthetic and economic characteristics of housing in our cities. Government intervention has mainly been through zoning, predominantly at local levels. More recently there’s also been stimulus at state and federal levels for first home buyers through various deposit subsidy schemes.

Subsidy schemes have been important in helping first home buyers bridge the deposit gap. Incentives have included cash payments and stamp duty relief.

In some states additional payments have been made for new building and for purchases in specific locations. But the Perth study indicates that some of these subsidies are becoming ineffective.

Standard “one type fits all” subsidies are limiting first home buyers’ choices of location and housing type.

The solution to this problem is to make subsidy schemes more flexible to nudge first home buyers towards affordable locations. This would even out the supply of affordable houses from areas where housing is densely clustered in certain locations.

Policy would also need to take into account the needs of different demographics in certain locations. Housing requirements of young singles are obviously different than for young families.

Effective policy would also need to take into account the types of housing finance available for first home buyers. One example is the WA government’s Keystart loans which help eligible people to buy their own homes through low deposit loans and shared equity schemes.

These types of schemes include shared ownership with the government owned housing authorities and include existing and newly built homes in a variety of locations.

But it’s not all up to state governments. The problems of lack of land supply and infrastructure are the same in all Australian capital cities. The federal government could play a more prominent role through infrastructure grant funding in changing the location choice of buyers and variation of affordable housing types at a national level.

Author:  Greg Costello, Associate Professor, Curtin University

Latest Survey – Why Home Prices Will Fall Further

The latest release of the Digital Finance Analytics Household Survey to end March 2018, helps to explain why we think home prices are set to fall further. We discussed four housing and property scenarios in a recent video blog.

But drawing on our 52,000 sample, from across Australia, today we will walk through the top-level survey findings, before later drilling into the segment specific data in later posts. You can read about our household segmentation models here.  This analysis of course then feeds into our Property Imperative Report, which we publish twice each year as a summary of our research and analysis. The last edition – volume 9 – from 2017 is still available on request.

Read the transcript. or watch the video.

The first chart, which looks across our property segments, shows that both portfolio property investors (who hold multiple properties) and solo investors (who hold one, or perhaps two) intentions to transact are tanking, down 8% since December 2017. As we will see later, this is because credit is less available, capital growth has stalled, and in fact only the tax breaks remain as an incentive! This decline started in 2015, but is accelerating.  Remember that 35% of mortgages are for investment purposes, so as this demand dissipates, the floor on prices starts to shatter.

Whilst there are offsetting rises from  down traders (who are seeking to release capital before prices fall further) and first time buyers (who are being “bribed” by first owner grants) there is a significant net fall in demand. This pattern is seen across the country, but is most prevalent in our two biggest markets of Sydney and Melbourne.

Refinancing is up a little, thanks to the attractive discounts being offered by many lenders, and as we will see the prime driver is to reduce monthly repayments, as currently household finances are under pressure. We release the latest mortgage stress analysis in a few days.

First time buyers and those wanting to buy, are saving a little more in an attempt to access the market, and those planning to trade up are also still putting some funds aside, otherwise, there is little evidence of concerted attempts to save cash for property transactions.

Turning for demand for credit, we see is crashing, especially in the investment segments. There was a 12% fall in the solo property investor group and an amazing 27% fall in the portfolio investor segment.  One of the clearest messages from the survey is how much lending standards just got tighter, with an average 20% drop in “borrowing power” compared with a few months ago. As a result many first time buyers and investors simply cannot get credit, because they cannot meet the tighter requirements. The outfall from the Royal Commission will simply exacerbate the situation. There is a strong link between home prices and credit supply, so this will put further downward pressure on property values.

Refinancing households are tending not now to seek to release additional capital from their properties, as part of a refinance deal.  We also note a rise in those being forced to refinance from interest only loans to principal and interest loans, and our latest modelling still is tracking an estimated $100 billion problem.

We find that ever fewer households are expecting home prices to rise, this registered across the board – but the trajectory down is strongest among investors. No segment is more bullish on prices compared with last year. This falling trend is strongest in Sydney, but Melbourne appears to be following about 6 months later. Households in Perth and Hobart are more bullish, but only slightly, and this was not enough to prevent the general decline. Remember WA has seen prices slide in recent years.

Households use of mortgage brokers appears pretty consistent (even if the volume of transactions is falling). Those seeking to refinance are most likely to approach a broker, followed by first time buyers.

Next time we will look in more detail at the underlying drivers by segments. But current home prices appear to have no visible means of support – they are going to fall further.


Mortgage Expenses In The Spotlight

The Royal Commission into Financial Services Misconduct, yesterday spent time with ANZ, and examined their expenses validation and verification processes, especially when applications were made via the broker channel.

Astonishingly, it appears that the bank may ignore the expense data from the broker as submitted (so the Commission asked why they capture the data at all!). Household Expenditure Measure (HEMs) figured in the discussion, as a test which was used by the bank in the assessment process. It will be interesting to see if the Commission views this approach is compliant with their responsible lending obligations.

It begs the question more broadly, are mortgages held by the banks supported by appropriate expense calculations? Some are saying that up to 40% of loans on book may have issues.

We also note that the “mortgage power” type calculators available on bank web sites to give an indication of a borrowers ability to get a mortgage, on average now gives a mortgage figure some 20% lower than a couple of years back.

So, many borrowers would not now get the mortgage they did then. Think about the implications for existing borrowers seeking to refinance, or to move from interest only loans to principal and interest loans!

There was also more data on lower auction clearance rates. Plus predicted falls in home prices, from Moody’s.

When you overlay the Commission findings, with the sales trends (deep discounts are now a feature of current sales, see above), it seems to me home prices are set for more falls in the months ahead.

We discussed this in our latest video blog.

More broadly, the Commission shows the massive repair job the banks have to do on their reputations and culture. No wonder their share prices are down.  Of more significance are the structural risks to the economy, as households continue to struggle with over-committed budgets thanks to lax lending.  This is unlikely to end well.

The purpose of the Commission was to remove uncertainty from the banking sector, but as it goes about its business, in fact the levels of concern are rising. It has royally back-fired!

But there is a good chance that customer outcomes will be enhanced as the consequences  are digested. This would be an excellent outcome. But not an intended one.

NSW Property Prices To “Correct” ~10% – Moody’s

As reported in the Business Insider, Moody’s Investor Services thinks there will be further declines to come, suggesting that Sydney prices will suffer a “correction” in the year ahead.

“Incomes in NSW have increased faster than the national average and underpin some of the recent gains in home values,” Moody’s says, pointing to the chart below. “However, housing values have risen even faster and are overvalued relative to equilibrium value. Therefore, Moody’s Analytics expects a correction across NSW.”

The Property Cracks Widen

Sydney home price falls are now featuring in the main stream media.  Of course average price falls may not fully tell the story, as more expensive property is dropping faster, whilst demand for cheaper  options remains strong.

Nine News ran a segment last night.

The cracks are beginning to show in the Sydney property market, with the inflated prices from six months ago dissipating.

In some suburbs, prices have fallen as much as 30 percent, as the median house price copped its largest knock since August 2008.

In the three months to December, the harbour city’s median house price fell 1.3 percent, tumbling a further 2.5 percent in the following three months to March, CoreLogic data shows.

It’s the steepest drop in a decade, with the average price of a home now priced at $880,743.

CoreLogic’s Kevin Brogan said the tide was slowly turning.

“I don’t think there’s any cause for panic,” he said.

“At the moment it’s trending towards being a buyer’s market, but I think what we’re seeing is quite a gradual adjustment to the market.”

Experts say a crackdown on investor loans, increased stock and the curbing of tax benefits has contributed.

Over the past fortnight, the auction clearance rate dropped to just 56.1 percent.

Compare that to this time last year, when 78 percent of homes were selling.

Yesterdays Daily Telegraph newspapers also painted a picture of gloom:

Affordable housing policy failure still being fuelled by flawed analysis

From The Conversation.

Australia has a housing affordability problem. There’s no doubt about that. Unfortunately, one of the reasons the problem has become so entrenched is that the policy conversation appears increasingly confused. It’s time to debunk some policy clichés that keep re-emerging.

Is ‘zoning’ to blame?

It can be tempting to frame the housing affordability problem as all about inadequate new supply. According to this argument, the “demand side” drivers – such as low interest rates and tax incentives for property investment – have combined with population growth in the capital cities to fuel house prices, and new housing construction simply hasn’t kept up.

“Zoning” is often blamed. There is little hard evidence, though, to show systematic regulatory constraint.

Supply is at record highs, and in the right places

Australia’s new housing supply per capita is actually very strong by international standards. Over the past decade, supply of new units and apartments has been flowing in job-rich metropolitan areas with dense populations, which are also higher-value locations.

According to the cliché, this supply response should have cooled prices. Yet dwelling price inflation has surged even in metropolitan areas where new housing supply has exceeded population growth.

The fallacies of ‘filtering’

One of the great hopes underpinning the supply cliché is that new housing stock improves affordability even if these homes are not affordable for lower-income groups. This faith is based on a theory called “filtering” whereby older housing moves down to the affordable end of the market over time.

The empirical data on filtering are thin. Indeed, the academic literature has historically cast doubt on the theory. However, some commentators continue to claim that American rental housing markets provide evidence that “filtering” can occur in practice.

But whatever might happen in the US, in Australia there’s still no evidence to suggest new housing supply has filtered across the housing stock to expand affordable housing opportunities for low-income Australians, or that it will do so any time soon.

Prominent economists continue to produce data that suggest the potential impact of new supply on price is minimal. The shortage of affordable housing opportunities for low-income households in Australia remains persistent. And the evidence indicates that low-income working households in our cities consistently face housing costs well above accepted affordability levels regardless of the quality of the housing they live in.

Sustaining supply in a cooling market?

Some commentators cite cooling house prices as evidence that the supply response is taking effect. Whether or not that is so (above and beyond demand-side factors like higher interest rates for investor loans), expect the pipeline to start slowing down. Private sector development is driven by profit and risk and, as we have seen over many years, is characterised by speculative booms and busts.

Developers can turn off the new supply tap much more quickly than they can turn it on. Falling prices, weak consumer sentiment and economic uncertainty mean many developers will not follow through on building approvals until the market recovers.

This means that high levels of supply output are rarely sustained. Recent housing data in Western Australia provide a case in point. WA recorded rising completions in 2014, 2015 and 2016. But 2017 completion figures are expected to show a drop of around a third as prices have shaded off since the end of the mining boom.

Put simply, the market on its own will never solve Australia’s housing affordability problem. Expecting developers to keep building in order to reduce house prices is pure fantasy.

Planning reform is not an affordable housing strategy

We’ve written before about the political appeal of calling for planning reform instead of real solutions to housing affordability pressures. In fact, Australian states have embarked on more than a decade of planning reforms.

They have aimed to: standardise and simplify planning rules; promote mixed use and higher-density housing near train stations; and overcome local political opposition to development through the use of independent expert panels.

Housing targets for both urban infill and new greenfield areas have been a feature of metropolitan plans to drive dwelling approval rates since at least 2000.

These reforms have been effective in overcoming regulatory constraints. The scale of the recent supply response shows clearly that zoning and development assessment processes are not inhibiting residential development approvals in cities like Sydney and Melbourne.

But trying to accommodate Australia’s population growth in towers around railway stations will fail as an affordable housing strategy – even if “zoning” and height rules were completely scrapped.

Rather than narrow deregulation agendas, bigger picture reforms are needed. Aligning infrastructure funding with metropolitan and regional decentralisation is a critical long-term strategy. Reforms to deliver affordable housing in communities supported by new infrastructure are long overdue.

A bigger affordable housing sector is needed

Australia needs a more realistic assessment of the housing problem. We can clearly generate significant dwelling approvals and dwellings in the right economic circumstances. Yet there is little evidence this new supply improves affordability for lower-income households. Three years after the peak of the WA housing boom, these households are no better off in terms of affordability.

In part, this may reflect that fact that significant numbers of new homes appear not to house anyone at all. A recent CBA report estimated that 17% of dwellings built in the four years to 2016 remained unoccupied.

If we are serious about delivering greater affordability for lower-income Australians, then policy needs to deliver housing supply directly to such households. This will include more affordable supply in the private rental sector, ideally through investment driven by large institutions such as super funds. And for those who cannot afford to rent in this sector, investment in the community housing sector is needed.

In capital city markets, new housing built for sale to either home buyers or landlords is simply not going to deliver affordable housing options unless a portion is reserved for those on low or moderate incomes.

Authors: Nicole Gurran, Professor of Urban and Regional Planning, University of Sydney; Bill Randolph, Director, City Futures Research Centre, Faculty of the Built Environment, UNSW; Peter Phibbs, Director, Henry Halloran Trust, University of Sydney; Rachel Ong, Professor of Economics, School of Economics and Finance, Curtin University; Steven Rowley, Director, Australian Housing and Urban Research Institute, Curtin Research Centre, Curtin University

Popping The Housing Affordability Myth

Home prices are horribly high in Australia. I think we can all agree on that point. But what is really driving this?  “Classic” economic theory is that supply and demand of property drives prices, so factors such a number of builds, population and migration, and planning controls are all to blame. Indeed, a recent paper from the RBA peddled the line, as does the property and real estate sector. State and Federal Governments also talk this up.

But, there is another factor which is, according to our simulations, is much more directly impacting home prices and affordability. That is availability of credit. And this  is contentious, because classic economists (including those residing in most central banks) tend to argue that credit growth is a zero sum gain, in that if there is a loan on one side of the ledger, there is a creditor on the other side of the fence, so the net impact is zero.

Worse still, classic theory suggests that banks are limited in what they can lend by the availability of deposits. Neither of these statements is true, and it fundamentally changes the banking and banking supervision game.

Back in 2014 I discussed this, based on an insight from the Bank of England.  Their Quarterly Bulletin (2014 Q1), was revolutionary and has the potential to rewrite economics. “Money Creation in the Modern Economy” turns things on their head, because rather than the normal assumption that money starts with deposits to banks, who lend them on at a turn, they argue that money is created mainly by commercial banks making loans; the demand for deposits follows. Rather than banks receiving deposits when households save and then lending them out, bank lending creates deposits.

More recently the Bank of Norway confirmed this, and said “The bank does not transfer the money from someone else’s bank account or from a vault full of money. The money lent to you by the bank has been created by the bank itself – out of nothing: fiat – let it become.”.

And even the arch conservative German Bundesbank said in 2017 recently “this means that banks can create book money just by making an accounting entry: according to the Bundesbank’s economists, “this refutes a popular misconception that banks act simply as intermediaries at the time of lending – ie that banks can only grant credit using funds placed with them previously as deposits by other customers“.

Therefore the only limit on the amount of credit is peoples ability to service the loans – eventually.

With that in mind, we have built a scenario model, based on our core market model, which allows us to test the relationship between home prices, and a series of drivers, including population, migration, planning restrictions, the cash rate, income, tax incentives and credit. We are looking at national averages here, and we have smoothed the data from RBA and ABS to bring the trends out.

So first, lets walk through some of the relativity mapping. First we look at home prices relative to income growth. The blue area tracks changes in home prices since 2004, and the yellow line is the change in income.  Most striking is that income growth and home prices are running in opposite directions, and have been especially since 2013. So income growth is not correlated to home price growth.

Next we look at home prices relative to migration and once again there is little alignment between home price growth and migration rates, this despite up to two thirds of population growth being fed from migration in recent years.

The relationship between overall population growth and home prices is equally disconnected. For example the rate of growth slowed from 2012 onward when we have had a large run up in home prices.

We then turned to building approvals, and even adjusting for the delay between approvals and commencements, there is little correlation.

Up next is the RBA cash rate. Here we see an inverse linkage, in that as interest rates are cut, home prices expand. This also suggests that should rates rise, home prices will fall.

And here is the reason. The correlation between home prices and credit availability are clear to see. As credit rose from 2012 onward, home prices did too. It also suggests that if credit availability is tightened, we should expect prices to fall – take note, given the current tighter underwriting standards now in force. This is why I predict ongoing falls in property prices.

And more specifically, credit for property investment is even more strongly correlated. As we know investors are attracted by the capital growth, and also the capital gains and negative gearing tax breaks available.

So then, we rolled all these factors into our overall model, and examined the relative influence of each on home prices. The four most powerful levers in terms of home prices is first overall growth in personal credit, including mortgages and other loans at 27% of total impact. Investment lending contributed a further  18%, followed by tax policy for investment property at 17% and the cash rate at 14%. The other factors, the ones which are spoken about the most, property supply, population growth, planning restrictions and migration, together make up just 22% of total impact. Or in other words, without addressing the credit elephant in the room, tax policy and interest rates, the chances of taming prices is low.

So now I can quote the recent Grattan report again, but with renewed vigour. “…much of the debate has focused on policies that are unlikely to make a real difference. Unless governments own up to the real problems, and start explaining the policy changes that will make a real difference, Australia’s housing affordability woes are likely to get worse”.

And the greatest of these is credit policy, which has for years allowed banks to magic money from thin air, to lend to borrowers, to drive up home prices, to inflate the banks balance sheet, to lend more to drive prices higher  – repeat ad nauseam! Totally unproductive, and in fact it sucks the air out of the real economy and money directly out of punters wages, but make bankers and their shareholders richer.

One final point the GDP calculation we use in Australia is flattered by housing growth (triggered by credit growth). The second driver of GDP growth is population growth.  But in real terms neither of these are really creating true economic growth.

To solve the property equation, and the economic future of the country, we have to address credit. But then again, I refer to the fact that most economists still think credit is unimportant in macroeconomic terms!

The alternative is to continue to let credit grow well above wages, and lift the already heavy debt burden even higher. Current settings are doing just that, as more households have come to believe the only way is to borrow ever more. But, that is, ultimately unsustainable, and why there will be an economic correction in Australia, and quite soon.