How Much Market Power Do The “Big Four” Hold?

The Productivity Commission Report into Competition in The Australian Financial System looked specifically at the role and function of the big four banks. Today we look at some of the evidence which they presented, in the light of the Green’s recently released policy on “Breaking Up the Banks”.

Whilst the market dominance of the big four, Westpac, CBA NAB and ANZ does not necessarily in itself mean the market is not competitive, the Productivity Commission suggests that such dominance may allow them to stifle competition by maintaining prices at artificially high levels or limiting innovation without losing any market share.

In many banking systems globally, larger institutions have more market power, and Australia is no exception. Their sheer size allows the major banks to spread their fixed costs (such as investment in new IT systems) across a broader asset base. They are also able to grow more quickly, as they have greater capacity to respond to an increase in demand. At the same time, size can create challenges — for example, changes are more difficult to implement in very large systems. There is a tipping point beyond which large organisations are no longer efficient and they operate at declining returns to scale.

The clearest and most powerful advantage that larger banks have over smaller ADIs, and one that gives them substantial market power, is their ability to raise funds at lower costs. Larger banks have better credit ratings, and as a result, investors and depositors are willing to lend them funds at lower rates. In part, these credit ratings can reflect the ability of larger banks to hold more diversified lending portfolios. However, these ratings also benefit from explicit and implicit government guarantees, such as being considered ‘too big to fail’. Their lower costs of funding enable the bigger banks to maintain their profits and offset some of the increases in their costs resulting from regulatory change, which may prove more difficult for smaller institutions.

Larger operators also benefit, to an extent, from integration, which gives them the ability to exert additional control over some markets. Vertical integration allows larger institutions to have more control over the costs of their inputs, while smaller entities rely on third parties to access funding markets and other types of services. In effect, small ADIs compete against the major banks, but also depend on them to access the funds that allow them to continue competing. Cross-product (conglomerate) integration gives the larger institutions the opportunity to cross subsidise some of their products, and also offer consumers an integrated bundle of services, which may help to lock customers into the provider and raise customer switching costs.

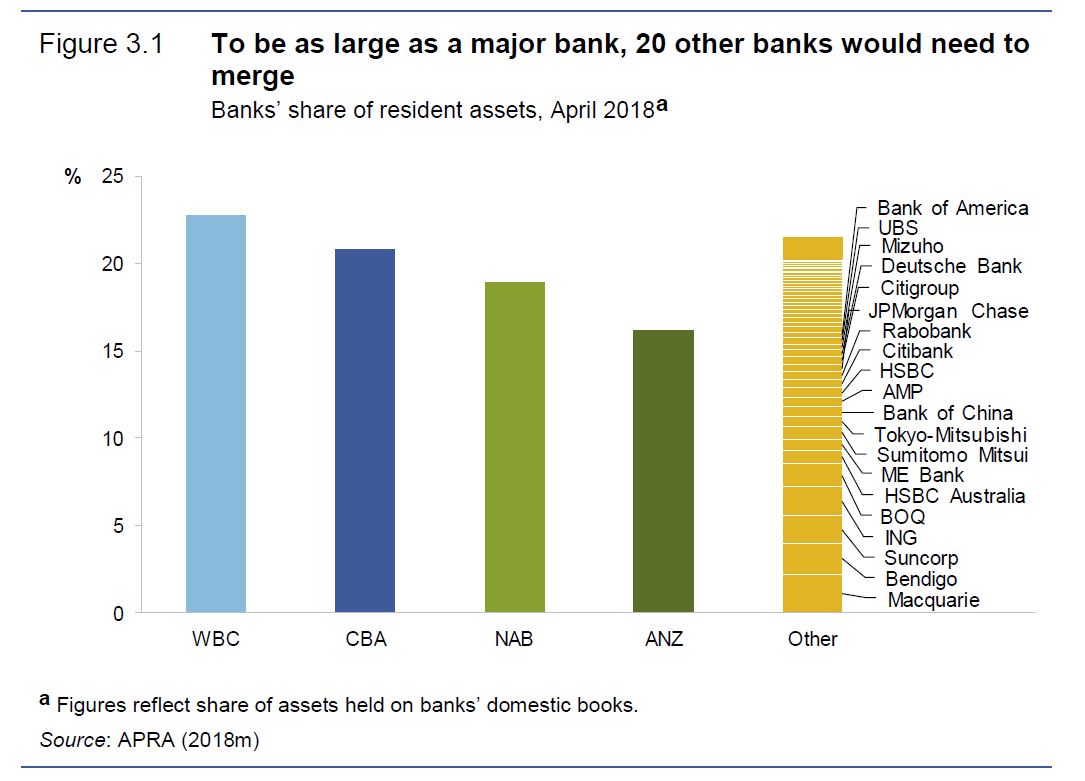
Despite the consolidation of some smaller players, the major banks still maintain substantial market power — because the difference in size between them and the other providers in the market is exceptional. Based on the value of their assets in April 2018, ANZ (the smallest of the majors) was seven times bigger than Macquarie, the next bank by size of assets. Twenty banks (ranking 5th to 24th by size of assets) would need to merge in order to match ANZ. Only if all banks in Australia, other than the big four, merged would they be able to rival the biggest two — Westpac and the CBA.

An important aspect of banks’ size is their geographical reach, either through branches or other distribution networks. In 2017, there were about 5300 bank branches, over 390 credit union branches and 74 building society branches. The major banks accounted for 60% of all branches, and only two other ADIs (Bendigo and Adelaide Bank and Bank of Queensland) had branches in every state and territory.  Major banks are also strongly represented in other distribution networks, such as mortgage brokers.

At the same time, customer satisfaction levels reported by individual banks, including the major banks, remains high. While consumers may be disillusioned with the banking system, it seems they are satisfied with their chosen institution. Of course, consumers may not always be aware of the alternative services and prices available from other institutions — or even their own institution — that may be more suitable for their circumstances.

Australia’s major banks have some of the strongest business brands in our economy. Industry estimates put the value of their brands between $6 and $8 billion, with CBA having the highest brand value. Their public image has been affected by a series of scandals and the continued community perception that they do not operate in their customers’ best interests

The major banks benefit from the perception that they are safe, stable institutions, and that the government will step in to help them if needed. This supports their existing market power, and in some cases increases it further — during the global financial crisis (GFC), consumers transferred some of their savings to the major banks, as they were perceived as safer. Even when no financial crisis looms, small institutions may find it difficult to attract consumers from rivals that are perceived as safer. This is despite the fact that retail deposits benefit from the same government guarantee, regardless of ADI size.

Consumer behaviour may also contribute to market power; the low levels of consumer switching and a general disengagement from financial services help ADIs maintain their position in the market, and make it harder for new competitors to gain any significant market share.

The major banks benefit from a substantial asset base and stable market shares, which give them the ability to cope more easily with regulatory change, while also investing and innovating — which in turn can contribute further to their market power.  Small institutions argue that their regulatory burden is disproportionately large. For some, the pace and extent of regulatory change has left them limited resources to increase market share.

Measures introduced by the Australian Government and APRA are intended, in part, to offset the cost advantages of large banks — examples include the major bank levy and potentially the specific prudential regulation imposed on domestically significant banks, which applies to the big four banks. It has been argued by Government that when such regulations raise the costs of the major banks, they may help smaller competitors.

But the PC says the objective of competition policy is not to assist some competitors by adding burdens to others, but rather to have the least necessary intervention that is consistent with allowing choice and innovation to meet consumer interests in an efficient manner. Viewed simply, to raise the cost of businesses that have market power — while doing nothing to address adverse use of that market power — risks seeing those costs imposed on customers.

They conclude that the major banks benefit from advantages of scale, scope and branding which give them substantial market power and the ability to remain broadly insulated from competitive threats posed by smaller incumbents or new entrants. They concluded that this balance of power gives the major banks the ability to pass on cost increases and set prices that maintain high levels of profitability — without losing market share.

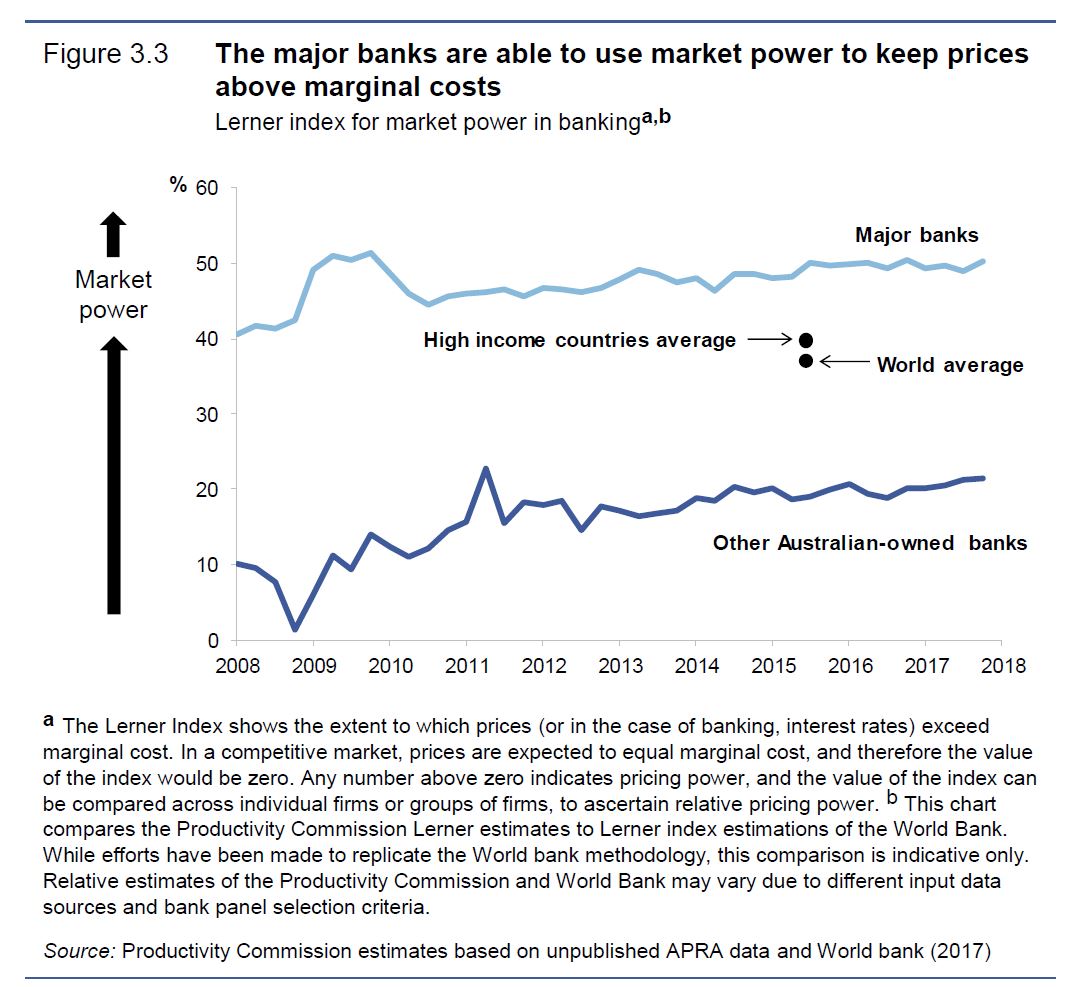
While high concentration on its own is not necessarily indicative of market power resulting in inefficient pricing or (tacitly collusive) oligopolistic behaviour and the major banks have all argued that vigorous competition in the banking system is evident in a number of market outcomes, their analysis shows that major banks are the dominant force in the market. As a result, they are able to charge higher premiums above their marginal costs, compared with other institutions. Approximately half of the loan price that major banks charge is a premium over the marginal cost — double the margin that other Australian-owned banks have.

In fact, they say, over the past five years, changes to prudential regulations have increased the cost of funding for the major banks. However, and as has been anticipated by regulators, they have been able to recoup these higher costs by increasing interest rates for borrowers.  According to the ACCC, the big four banks tend to disregard the pricing decisions of smaller lenders — rather, they focus on the expected reactions of the other majors and any changes they may make to interest rates. As a result, each of the banks examined by the ACCC ‘generally aim to set their headline variable rates to broadly align with the big four banks’ . The major banks view this behaviour as an attempt to compete and maximise their profits — but the end result from a consumer point of view is non-competitive pricing. The lack of price competition is reinforced by obfuscation. The prices that ADIs advertise are often not indicative of what consumers actually pay, as we discussed the other day.

The PC concludes that oligopoly behaviour and the ability to use market power adversely are evident Indeed, the major banks themselves are unable to identify competitive threats in the domestic markets, and they focus on large technology companies overseas as their future potential competitors. Such threats have yet to eventuate, and will in any event need to exist in the regulated environment that consciously limits rivalrous behaviour.  Whilst the ‘tail’ of smaller providers aims primarily to match the major banks in their pricing, they are subject to similar or, at times, more costly regulation and do not benefit from the funding or efficiency advantages of the major banks, so they are often unable to offer prices that are substantially lower. Some of the smaller banks, in particular foreign institutions, operate in niche markets (such as agribusiness) where they can potentially benefit from specialisation and set prices that reflect their capacity to price discriminate. Others, such as credit unions and other mutually owned institutions, are consolidating in order to benefit from economies of scale. But in the market for retail banking services, it is the major banks that dominate, and other players follow their lead.

So, standing back, the Big Four are dominant, exert structural market power to the detriment of their customers and the broader society. We are paying through the nose to bolster their profitability. Something needs to change. I will share my own thoughts in a subsequent post.

How have your family’s fortunes changed?

From The Conversation.

Do you feel that, overall, you’re “better off” than you were in the past? Or that things are getting worse, or have plateaued?

We now have the data to get us a pretty good answer to that question, right down to the detail by “family types”, as categorised by the Household, Income and Labour Dynamics in Australia (HILDA) Survey. Starting in 2001, this longitudinal survey now tracks more than 17,500 people in 9,500 households.

The interactive below lets you drag and drop your family members into the house to see what the HILDA data reveal.

One measure we’re showing is what economists call “equivalised income”. That’s different to your total household income; here’s how the HILDA report explains it:

Overall, median equivalised incomes have gone up since 2001 for all family types, but some have fared better than others, as this chart from the full HILDA report shows:

For the purposes of interpreting the HILDA data, you might need to be a bit flexible when deciding which “family type” applies to you. For example, a household with two single, adult sisters living together will be classified as two single-person “families”, even though they might see themselves as a family unit.

And it’s worth remembering, as the HILDA report notes:

… some households will contain multiple “families”. For example, a household containing a non-elderly couple living with a non-dependent son will contain a non-elderly couple family and a non-elderly single male. Both of these families will, of course, have the same household equivalised income. Also note that, to be classified as having dependent children, the children must live with the parent or guardian at least 50% of the time. Consequently, individuals with dependent children who reside with them less than 50% of the time will not be classified as having resident dependent children.


Hayne rejects NAB’s efforts to conceal documents

From Investor Daily.

Yesterday’s royal commission hearings began with a ruling by commissioner Kenneth Hayne on NAB’s application to prevent seven documents from being published.

The ruling came after a fiery exchange on Wednesday afternoon in which an angry commissioner Hayne warned NAB counsel Neil Young not to “direct” NAB witness Nicole Smith.

One of the seven documents ruled on yesterday was a document from ASIC entitled ‘Outline of Suspected Offending by the NAB Group’.

“The parts of the document for which the direction is sought concern ascertaining the extent of the charging of fees for no service and what approach should be adopted for compensating those who have been charged,” said the commissioner.

Mr Hayne said he would need to weigh up the “balance” between the interest of an individual, the public interest, and NAB’s legitimate desire to protect private commercial interests.

“In attempting to strike the balance that is to be drawn between those competing elements, it is to be noted that it would be in the interests of NAB to pay the least sum available by way of remediation,” Commissioner Hayne said.

“It would be in the interests of persons charged fees, in circumstances where no service has been provided, to be provided with adequate compensation.

“It is in the public interest that there be an open and transparent inquiry about how both the regulator and the regulated deal with the issue of remediation,” he said.

For those reasons, said the commissioner, “the application for non-publication is refused”.

Counsel assisting Michael Hodge then stood up at the bench to reject comments by Mr Young on Wednesday afternoon that “might be taken to be an implicit criticism of the staff of the royal commission”.

“You were also told, commissioner, in relation to the outline of contraventions from ASIC that I was taking Ms Smith to, that the National Australia Bank had not been notified that this document would be the subject of publication. That is incorrect,” Mr Hodge said.

“There was no fault on the part of the staff of the commission or the solicitors assisting the commission, and that everything has occurred in accordance with the practice guidelines that have been published by you in February of this year,” he said.

Mr Hodge went on to describe the tardiness with which NAB had supplied documents requested by the royal commission.

NAB produced 31 documents on 9 July 2018 following a request by the commission for documents relating to NULIS and ‘fees for no service’, said Mr Hodge.

“After that date, the National Australia Bank produced in excess of three and a half thousand documents regarding the ‘fees for no service’ issue, of which in excess of 3000 were produced to the commission last week,” he said.

In respect of the seven ASIC documents commissioner Hayne ruled on yesterday morning, four were produced to the royal commission on the afternoon of 3 August 2018 and three were never produced by NAB, said Mr Hodge.

“It may be that, unfortunately, that particular manner of responding to your compulsory notice has contributed to some of the difficulties that the National Australia Bank has faced in dealing with these confidentiality claims,” Mr Hodge said.

Mr Hodge uncovered at least 100 instances of potentially criminal breaches by NAB in his subsequent examination of the seven ASIC documents and his questioning of Ms Smith.

NAB chief executive Andrew Thorburn made a public apology for NAB’s “failure to act with honour” via a video posted on Twitter late on Thursday afternoon.

Estimating Future Home Lending Growth

One of my clients asked me to share my thoughts on the trajectory of future home loan growth, in the light of the current market dynamics. We run a series on this in our Core Market Model, and it is updated each time we get data from our surveys, APRA, ABS or RBA.

So I included the data from the ABS in terms of lending flows, factored in deep discounting and rate cuts from some lenders (like ANZ) and the ability of some lenders, like Macquarie, HSBC and some Credit Unions, to fly higher than the APRA imposed cap on investor loan growth.

In fact we run three scenarios, a base case, which we will discuss in a moment, an aggressive growth case, and a lower bounds case. We have assumed no move in the RBA cash rate over the next 18 months, a continued fall in the pressure on the BBSW rate, and some continued momentum from first time buyers.  We also factored in the ongoing shift from interest only loans to principal and interest loans, and appetite for finance from some household sectors, especially those seeking to refinance, including those seeking to assist their offspring to buy via the banks of Mum and Dad.  Our model has been tracking close to the RBA data in recent months, so we are pretty confident about the trends.  But it is only a projection, and it will be wrong!

The first chart shows the overall value of housing loan portfolios, split between owner occupied and investor loans. The astonishing momentum in investor lending up until mid 2017, when APRA’s new regulations kicked in, eases back, and the current growth in investor loans portfolios is pretty flat. In fact we expect a small rise in the months ahead, as some non-bank lenders have to compete harder with the APRA “approved” lenders who can go above the cap.  Remember though lenders still have tighter underwriting standards than before, so there is not going to be a massive resurgence in my view, at least until the Royal Commission reports.  Owner occupied loans will continue to lift, as first time buyers are still active, and attracted by the lower property prices.

Refinancing of existing loans does continue, though some are having difficulty finding a loan, as we discussed yesterday.

Turning to the percentage change, our base case is for a slow rise in investor lending and a slow fall in owner occupied loans, with an overall growth still well above inflation at between 5-6%.

This suggests that the lenders will need to compete hard for business which is available, continue with more rigorous loan assessments and manage tighter margins as a result.

As a result, we think property prices will continue to go lower through 2019, but does not as yet signal a crash.

This could all change if funding costs go higher, or the banks get slugged with more costs relating to poor practice, or even face criminal cases relating to charging fees for no service, or making unsuitable loans to borrowers.

As a result there is significantly more downside risk than upside gain at the moment.  Our worst case scenario actually sees the overall lending portfolio shrink. If this were to happen, then all bets are off, and we must expect significantly more property price falls through 2019. Actually we do not think, as some are saying, that the worst is over. Rather its just the end of the beginning!


It’s time to break up the banks: Greens

Leader of the Australian Greens Dr Richard Di Natale and Treasury Spokesperson Sen. Peter Whish-Wilson have unveiled a proposal for a sweeping overhaul of our banking and financial services sector, as well as the regulatory and governance system underpinning it. Simply put: it’s time to break up the banks.


“The Hayne Royal Commission has proven that the foundations of our banking and financial system are rotted through. It’s past time we stopped letting these huge corporations get away with fraud, bribery and other systemic abuses of the customers they are supposed to serve,” Di Natale said.

“The Greens led the charge to establish a Royal Commission into the banking sector and we are the only party with a real, simple solution to the abuses it has uncovered: break up the banks.”

“It’s time that banks became banks again. Australians are sick and tired of these massive financial institutions getting away with murder because they can throw stacks of money at the two old political parties. Our banks should be working for us, not against us and this policy will make sure that happens.

Under the Greens proposal:

  • Banks will no longer be able to own wealth management businesses that both create financial products and spruik them to unsuspecting customers.
  • Consumers will be able to easily distinguish between the simple and essential products and services that the vast majority of Australians use—deposits and loans, superannuation and insurance—and the more complex and selective activity that is the domain of big business, the wealthy, and the adventurous.
  • By removing hidden conflicts of interest, Australians will be able to trust that the advice they’re getting from their banker is designed to line their own pocket, not the other way round.
  • The watchogs have failed. We would strip ASIC of its responsibility for overseeing consumer protection and competition within the essential services of basic banking, insurance and superannuation and return them to the ACCC.

“I have been grilling the banks and ASIC in Senate Inquiries for five years and have come to the conclusion that fiddling around the edges isn’t going to change things. ASIC is just too close to the banks and is more interested in keeping the financial sector happy than it is in protecting consumers,” Whish Wilson said.

“This policy is about putting consumer welfare back in as a primary objective of how we regulate our banks.  The Howard and Keating deregulation agenda put the banks first and these reforms are about putting the people first.

“We need to break up the banks so they are no longer too big to regulate. We have to strip consumer protection powers over the banks from ASIC and APRA and give them to the ACCC. We need to have a regulator that is interested in policing the banks and pursuing justice when wrongdoing occurs, not one that issues speeding fines for highway robbery.

Suncorp Full Year Profit Falls

Suncorp has announced a net profit after tax (NPAT) of $1,059 million, a 34 per cent uplift on the first half of 2018.

However, this is 1.5% lower than the FY17 result, which they say was driven by the accelerated investment in the strategy. Actually, given the complexity of the market, and their business, I think they are doing rather well!

The Board has declared a final ordinary dividend of 40 cents per share and a special dividend of 8 cents per share. This brings the total dividend for 2017-18 to 81 cents per share, fully franked. Total dividend to investors in FY18 is up 11 per cent on the prior year.

Suncorp said the result was driven by stronger second half performance, reflecting the early benefits of the strategy.  The Business Improvement Program exceeded target by $30m. Digitisation of the business continues apace.

Key numbers

Insurance (Australia) delivered NPAT of $739 million. Motor and Home portfolios have performed strongly with GWP growth of 4.7 per cent, and claims performance at better than industry levels.

Banking & Wealth delivered NPAT of $389 million, with above system growth in lending (1.2x system or 6.2%)  and deposits (up 4.7%). A strong profit increase in Wealth was driven by improved investment income and reduced project costs.

New Zealand achieved NPAT of A$135 million, reflecting premium growth, unit growth, good claims management and expense control.

The Group NIM was 1.84 in FY18, but fell in the second half, from 1.86 to 1.82, reflecting the funding costs mix.  They suggest BBSW rates will “moderate”.

Overall provisions fell.

But past due on the home loans portfolio rose, consistent with other lenders.

Sale of Australian Life insurance business

Following the completion of a strategic review, Suncorp has entered into a non-binding Heads of Agreement with TAL Dai-ichi Life Australia to sell the Australian Life insurance business.

As part of the proposed transaction, Suncorp will enter into a 20-year strategic alliance agreement with TAL to provide life insurance products through Suncorp’s direct channels, including its digital channels, contact centres and store network. Completion of the transaction is expected to occur by the end of 2018, subject to regulatory approvals and conditions.

Capital

What Suncorp said

Suncorp CEO & Managing Director Michael Cameron said that the strong performance in the second half is driving momentum for FY19.

“Six months ago, we committed to a stronger second half, as the benefits of our strategy begin to flow through, and I’m pleased to report a 34 per cent uplift on NPAT on the first half. This result is a direct outcome of the repositioning programs we have implemented over the past two years. We are now beginning to see momentum, to deliver a further uplift in shareholder returns in FY19,” he said.

CBA is Less Focused On Brokers

In the CBA’s full-year 2018 (FY19) financial results, released yesterday, the share of new home loans originated by brokers dropped from 43 per cent  in FY17 to 41 per cent in FY18, as they focus on “their core market”.

CBA’s net profit after tax (NPAT) also took a hit over FY18, falling by 4.8 per cent to $9.23 billion, the first profit decline in 9 years. NIM was lower in the second half.

They warned of higher home loan defaults “as some households experienced difficulties with rising essential costs and limited income, leading to some pockets of stress”.

CEO Matt Comyn attributed the decline in profit growth to “one-off” payments, which included CBA’s $700 million AUSTRAC penalty, the $20 million settlement paid to ASIC for alleged bank bill swap rate (BBSW) rigging, and $155 million in regulatory costs incurred from the Royal Commission into Misconduct in the Banking, Superannuation and Financial Services Industry.

“There has been a number of one-off items that have impacted the result, including a couple of large penalties that we have resolved. If you strip some of those out, actually the result looks more from an underlying perspective up 3.7 per cent,” Mr Comyn said.

We discussed the results in our latest video.

More from Australian Broker.

The number of broker-originated loans as a proportion of all new business settled by the major bank has dropped alongside a fall in residential lending.

Over the same period, the total number of home loans settled by CBA also dropped from $49 billion in FY17 to $45 billion in FY18.

The bank’s overall mortgage portfolio now totals $451 billion, with the share of broker-originated loans slipping from 46 per cent in FY17 to 45 per cent in FY18.

In its presentation notes, CBA made specific reference to the bank’s focus on its “core market” of owner-occupied lending through its propriety channel, with the number of loans settled through its direct channel rising from 57 per cent to 59 per cent in FY18, and the share of new owner-occupied mortgages also growing from 67 per cent to 70 per cent.

The share of investor loans settled by CBA over FY18 declined from 33 per cent to 29 per cent, now making up 32 per cent of the major bank’s mortgage portfolio.

Interest-only lending fell sharply over FY18, falling by 18 per cent from 41 per cent of new loans settled in FY17 to 23 per cent in FY18.

The proportion of new loans settled with variable rates increased in FY18, from 85 per cent to 86 per cent (81 per cent of CBA’s portfolio).

CBA CEO Matt Comyn attributed the fall in the bank’s home lending to risk and pricing adjustments introduced by the lender over the financial year.

“[We] have been prepared to make some choices from both a risk and pricing perspective, which has seen us grow below system in home lending,” the CEO said.

“We will continue to make the right choices from volume and margin as we think about our home lending business. But overall, the core franchise of the retail bank has continued to perform well.”

Mr Comyn also claimed that despite slowing credit and housing conditions, he expects the bank to generate 4 per cent credit growth in FY19 and noted that CBA would not be looking to make any further changes to its lending policy.

“Consistent with the remarks from the chair of APRA, we see that the majority of the tightening work has been done, certainly at the margin, and there’s certainly some potential in the application of those policy changes,” the CEO continued.

“[We] certainly don’t see any big policy adjustments on the horizon. We feel like that 4 per cent credit growth, given what we’re seeing at the moment in the system, is about right, and of course, it’ll be a function of our performance against that system.”


Responsible Investments hit Major Milestone

Responsible investment in Australia has hit a major milestone, with a new report finding over half of all professionally managed investments in Australia are now invested as responsible investments. Environmental, social, corporate governance and ethics considerations now sit alongside financial as critical components informing the investment decisions of the majority of Australia’s professional investors.

The 17th annual Australian Responsible Investment Benchmark Report 2018 (KPMG), the most comprehensive review of the responsible investment sector in Australia, reveals the industry hitting new heights with $866 billion now managed as responsible investments, representing 55 per cent of all professionally managed assets in Australia, up from $622 billion in 2016 (growth of 39% year on year).

“This is a major milestone to reach with a majority of funds invested in Australia now being invested under commitments to responsible investment,” said Simon O’Connor, CEO of RIAA. “We are now at a stage whereby issues such as climate change, human rights, corporate culture, diversity and a whole range of other important sustainability issues are right at the forefront of consideration by Australia’s finance community.”

O’Connor explained the uplift in assets was largely due to mainstream investment funds making a switch to incorporate responsible investment, such as incorporating negative screening, systematically assessing environmental, social and governance (ESG) factors as well as engaging directly on these issues to influence corporate Australia.

“Nearly two decades of progress in responsible investment has this year reached an important tipping point, which we believe will only gain further momentum in light of growing calls for transparency and accountability across finance along with a growing consumer demand for investments that align with their values,” said O’Connor.

Broad Responsible Investment

RIAA and KPMG research reviewed Broad Responsible Investment strategies of 112 asset managers in Australia, finding 24 managers could demonstrate a leading approach to ESG integration, constituting $679.3 billion AUM, up by 22% year on year

Asset managers cited ESG factors positively impacting portfolio performance as now the greatest driver of growth in responsible investment (up by 20 per cent year on year)

Core Responsible Investment

Core Responsible Investments using negative or positive screening, sustainability themed investments, impact investing and community finance have also reached a record level of $186.7 billion representing 12% of all professionally managed assets, more than tripling between 2015 and 2017.

This growth in absolute and relative terms reflects both a surging demand for ethical, sustainable and impact investments as well as a further embedding of negative screens across mainstream financial products and mandates – particularly across tobacco and controversial weapons
Core responsible investment Australian share funds outperformed their benchmark over three, five and ten years

Responsibly invested international share funds outperformed the benchmark in the one and three-year time horizons, with comparable performance over ten years; and responsibly invested balanced portfolios outperformed their benchmark over the three, five and ten year periods
“Our research continues to show us Australians don’t want to build their retirement savings and other investments off the back of harmful activities without compromise to financial performance. The investment industry is responding, by providing more investment opportunities that align with these values, but also building these considerations into the bulk of the market.

“While it’s hugely positive to see responsible investment now with the lion’s share, our aspiration is to see this number grow as the understanding of ESG factors on positive portfolio performance increases,” said O’Connor.

FactCheck: GetUp! on the impact of US corporate tax cuts on wages

From The Conversation.

Debate continues over the Turnbull government’s proposal to cut the corporate tax rate from 30% to 25% for businesses with turnover of more than A$50 million.

One major point of contention is the possible effect of the tax cuts on Australian wages.

A social media post shared by lobby group GetUp! Australia argued against the tax cuts, suggesting that US real wages fell after the Trump administration cut corporate tax rates from 35% to 21%.

Let’s take a closer look.

Checking the source

The Conversation requested sources and comment from GetUp! to support the data used in the graph, and the suggestion that there had been a causal relationship between the enactment of corporate tax cuts in the US and a reduction in real wages.

We first found the graph in Bloomberg in this article by economics blogger and former Assistant Professor of Finance at Stony Brook University, Noah Smith.

The underlying data comes from the Payscale Real Wage Index – adjusted for inflation. We noted that percentage change since 2006 is an unorthodox Y axis for a wages graph, but that’s what the Payscale Index tracks.

We added the marker of the corporate tax rate being cut in the United States, which while passed in Q4 [the fourth quarter] of 2017, came into effect in Q1 [the first quarter] of 2018.

Note that in the Instagram image, we attributed Payrole.com as the source, instead of Payscale.com. This was a drafting error on our part.

Proponents of corporate tax cuts both in the US and Australia have asserted that there is a causal relationship between a lower corporate tax rate and higher wages (see US example and Australian example). The graph we posted in Instagram demonstrates that, in the US experience, that has not been the case.

This suggests that there is no causal relationship between a lower corporate tax rate and higher wages, and that cutting the corporate tax rate based on an expected flow on effect to wages would be a mistake.


Verdict

The social media post shared by GetUp! Australia, which could be read by many as suggesting that US corporate tax cuts caused wages to fall, is problematic and potentially misleading for two reasons.

Firstly: charts constructed with data from the US Bureau of Labor Statistics suggest that the chart used by GetUp! overestimates the drop in wage growth in the US between the first and second quarters of 2018.

According to the Bureau of Labor Statistics data, wage growth over that period declined slightly (rather than significantly), or was moderately positive, depending on the measure used.

Secondly, and most importantly: the chart used by GetUp! can’t conclusively establish any causal relationship between the enactment of US corporate tax cuts in January 2018 and any drop in wage growth.

While the chart does not support the argument that corporate tax cuts cause higher wages, it also cannot conclusively reject it.


What does the GetUp! chart show and suggest?

The social media post shared by GetUp! has the title: “This is what happened to wages when Donald Trump cut corporate tax in America.”

It shows a line chart with the heading: “United States real wages.” The reference to “real wages” means the index has been adjusted for inflation. A note below the chart says the wage changes are relative to 2006 levels.

The line chart depicts US real wages rising from minus 8.50% of 2006 levels in Q2 2016, to minus 7.70% in Q1 2018. A vertical line marks the point in Q1 2018 when the tax cuts were enacted. The line then shows a drop to minus 9.30% of 2006 levels in Q2 2018.

A reader could quite easily interpret the chart as meaning the enactment of corporate tax cuts in the US had an immediate and negative effect on real wage growth.

The subtitle reads: “Let’s not make the same mistake here.”

Are the data used in the chart appropriate?

As noted by GetUp! in their response to The Conversation, the source for the data used in the chart is Payscale, not payrole.com, as stated in the post.

Payscale is a US commercial company that provides information about salaries. The company publishes a quarterly wage index based on its own data, which it says is based on more than 300,000 employee profiles in each quarter, capturing the total cash compensation of full time employees in private industry and education professionals in the US.

Given the commercial nature of Payscale data, I don’t have access to their primary dataset, and can only rely on the description of the methodology reported on their website. I have no reason to doubt the validity of the data and/or the methodology.

I do, however, suggest that presenting the data in the form of percentage changes from 2006 is not ideal for an assessment of wage dynamics around the time of the enactment of corporate tax cuts.

In their response to The Conversation, GetUp! did acknowledge that “percentage change since 2006 is an unorthodox Y axis for a wages graph”.

It would be more informative to present the data as percentage changes between one quarter and the same quarter of the previous year, or between two consecutive quarters. I have done this in the two charts below, using the data publicly available from Payscale.

The story is qualitatively similar to that shown in the chart presented by GetUp!. Therefore, we can say that – based on the Payscale data – real wages seem to have dropped between the first and second quarters of 2018.

Is Payscale the best source for this kind of analysis?

While there is no reason to believe that the Payscale data are incorrect, it is worth considering a more standard statistical source.

Earnings data for the US are available from a variety of institutions. The difficulty, in this case, is that there are many different statistical definitions of earnings and wages depending on which sectors, geographical areas, and types of employees are observed.

One of the most commonly used definitions is the “average hourly earnings of production and non-supervisory employees on private payrolls”, with monthly data supplied by the US Bureau of Labor Statistics.

Using these data, I have recomputed changes in real wages (adjusted for inflation) between one quarter to the same quarter of the previous year and between two consecutive quarters.

These two charts based on US Bureau of Labor Statistics data tell a different story from the charts based on the Payscale data.

In particular, the change in wages between the first and second quarters of 2018 is moderately positive (+0.4%) rather than significantly negative (minus 1.7% based on the Payscale data).

The drop in wages between the second quarter of 2017 and the second quarter of 2018 is also less sharp (minus 0.11%, compared to minus 1.4% from the Payscale data).

These differences may be determined by the different coverage and/or statistical definitions used by Payscale and the US Bureau of Labor Statistics to measure wages and compensation.

The story the GetUp! chart suggests: is it correct?

The combination of the words and the image could suggest to some that there was a causal relationship between the enactment of corporate tax cuts and a drop in real wages in the US.

But the chart used in the post isn’t suited to provide any evidence on causality.

That’s because changes in real wages can be determined by a variety of economic factors, such as changes in the makeup of the labour force and business cycle fluctuations. A chart like the one published by GetUp! can’t possibly isolate the impact of just one factor.

The observation that wage growth dropped around the time of the enactment of the corporate tax cuts doesn’t automatically imply that this drop was caused by the tax cuts. At best, a correlation between the two events can be established, not a causal effect.

We also need to keep in mind that the relationship between tax cuts and wages is likely to involve time lags. The effect of corporate tax cuts on wages, or any other economic variable, takes time to feed through the economic system and to show up in the data. This reinforces the argument that the chart demonstrates correlation, rather than causality.

Having said that, while the data used cannot provide evidence for the argument that corporate tax cuts lead to lower wages, it cannot conclusively reject the argument, either. – Fabrizio Carmignani


Blind review

The GetUp! chart is captioned: “This is what happened when Donald Trump cut corporate tax in America.” Strictly speaking, GetUp! don’t actually claim that the corporate tax cut caused the wage to fall, but it is certainly what the reader is led to believe.

The author has identified the key problem with the GetUp! chart, which is that there is no evidence that the fall in real wages was caused by the enactment of corporate tax cuts. In fact, the chart provides no evidence to either support or reject the premise that a corporate tax cut would have any effect on wages.

The alternative data sourced by the author from the US Bureau of Labor Statistics cast some doubt on the accuracy of the data used by GetUp!, yet this is a distraction from the main argument that neither chart proves causality between corporate tax cuts and wage growth.

As the author says, there are many factors that influence real wage growth. Some examples include changes in the skills and experience of the working population, changes in government expenditure, and of course, changes to tax policy. It would be a mistake to attribute the recent decline in US wages to any single factor, such as the cut to the corporate tax rate.

This is why economic modelling is so powerful. In a “laboratory”, economic modellers can build two versions of the world: one with a tax cut and one without. With all other things held equal, the only differences between these two worlds must be a consequence of the tax cut.

Economic modelling produced by Victoria University’s Centre of Policy Studies (and of which I was an author) finds that despite stimulating growth in pre-tax real wages, a company tax cut would cause a fall in the average incomes of the Australian population.

So while this FactCheck shows that the wage chart from GetUp! is inconclusive, my view (based on the Victoria University modelling) is that company tax cuts could be a “mistake” where wages are concerned. – Janine Dixon

Author: Fabrizio Carmignani Professor, Griffith Business School, Griffith University; Reviewer: Janine Dixon Economist at Centre of Policy Studies, Victoria University

June Home Lending Flows Take A Dive

The ABS released their Housing Finance data to June 2018 today.

They reported that the trend estimate for the total value of dwelling finance commitments excluding alterations and additions fell 0.7%. Owner occupied housing commitments fell 0.2% and investment housing commitments fell 1.8%. In seasonally adjusted terms, the total value of dwelling finance commitments excluding alterations and additions fell 1.6%.

The proportion of loans for investment purposes, excluding refinance, was 41.4%, down from 53% in 2015. The proportion of refinanced owner occupied loans was 19.7%, similar to the past couple of months.

Looking at the changes month on month, owner occupied purchase of new dwellings fell 0.3%, while owner occupied purchase of established dwellings rose 0.1%, or $14,2 million.  Investment construction  lending rose 1.3%, or $14 million, borrowing for investment purposes by individuals fell 1.8%, down $154 million and investment by other entities fell 5.1% of $45.7 million. Refinance of owner occupied loans fell 0.9% or $53 million.

Overall around $31 billion of loan flows were written, down 0.7% in trend terms.

In original terms, the number of first home buyer commitments as a percentage of total owner occupied housing finance commitments rose to 18.1% in June 2018 from 17.6% in May 2018.

The number of loans fell 762 compared to last month, to 9,541. Within that we still some rises in NSW and VIC compared with a year ago, thanks to the recent FTB grants.  The proportion of loans written at fixed rates fell again.

Out First Time Buyer Tracker, which includes an estimate of first time buyers going direct to the investment sector continued at a low level, compared with a year ago.

Two final slides, first the original data showing the portfolio of loans outstanding at the banks registered an overall rise of $8 billion, and a fall in the proportion of loans for investment purposes to 33.7%, the lowest level for several years.

And the mix across states of owner occupied loans shows the strongest growth in Tasmania and Queensland, and falls in loan volumes most announced in ACT and Western Australia.

So the tighter lending conditions continue to bit, with investors less likely to get a loan. Some of this relates to demand (or lack of it) but also is being driven by the tighter lending requirements.

This is clearly seen in our surveys, where the number of rejected applications have risen significantly. This is especially true for those seeking to refinance an existing loan, including interest only loans.

The net portfolio growth, of around $9 billion, or 0.5% in the month in original terms, so overall lending remains quite strong, despite the weaker flows.