RBA supports best interests duty for brokers

From The Adviser.

The Reserve Bank of Australia has revealed that it believes all brokers should be required to act in a consumer’s “best interests”.

In its response to the Productivity Commission’s draft report into competition in the Australian financial system, the RBA came out in support of several of the commission’s draft recommendations.

Notably, the central bank revealed that it was in support of the draft recommendation that the Australian Securities and Investments Commission impose on lender-owned mortgage aggregators (and the brokers that operate under them) a “clear legal duty” to act in the consumer’s best interests.

Further, the RBA called for such a duty to be extended to all brokers, not just those operating under lender-owned aggregators.

The bank’s submission reads: “The bank supports the draft recommendation to require lender-owned aggregators and the brokers who operate through them to act in consumers’ best interests… We would support extending this to all brokers.

“While there may be some benefit in enhancing mortgage broker disclosure requirements to consumers to improve transparency, it is important to recognise that some consumers may nonetheless still not fully understand the information provided (given its complexity and the backdrop of consumers not taking out a mortgage frequently).

“Steps to address the underlying conflicts of interest and misaligned incentives are therefore crucial to improving consumer outcomes.”

Further to this, the RBA pulled on several findings from ASIC’s remuneration review, highlighting a number of other factors that it believes “inhibit the effectiveness of competition through mortgage brokers”.

These included:

  • Smaller lenders find it harder to get onto aggregator panels due to fixed costs
  • Brokers need to be accredited with a particular lender to sell their loans and they have incentives — “partly due to variations in commissions and the burden of seeking accreditation” — to concentrate their recommendations on a small number of lenders rather than the whole panel of potential lenders
  • Lenders “may compete on their incentives to brokers, rather than on the quality of their loan products, creating competitive barriers for smaller lenders who find it too costly to offer such incentives”
  • Higher commissions for brokers “may also drive up costs for consumers”

The RBA said that it is therefore in support of “enhancing” the transparency of mortgage interest rates paid by borrowers.

It suggested that possible ways of doing this could include “asking the banks to publish these rates directly” or “conducting a survey of the largest mortgage brokers to obtain representative rates”.

The RBA made several other statements in its submission, including:

  • The bank agrees that, when formulating prudential regulatory measures, it is important that any potential effects on competition be considered
  • It did not believe that the setting of the cash rate either constrains competition or substantially facilitates price co-ordination (as had been suggested by the PC)
  • The bank supports the commission’s draft recommendation to make risk weights “more sensitive to risk”
  • It did not recommend excluding warehouse loans to non-ADIs from the scope of Prudential Standard APS 120 as it “opens the possibility of regulatory arbitrage by treating loans of identical risk differently depending on who the ultimate lender is”
  • The RBA agrees that a review of the regulation of Purchased Payment Facilities “would be desirable” and that a tiered prudential regime is “likely to be appropriate”
  • It agrees with the commission’s draft recommendation that merchants should be provided with the ability to determine the default network for contactless transactions using dual-network cards

Charting The Financial Services Revolution

I caught up with Glenn Hodgeman, the brains behind the upcoming AltFi Australasia Summit  2018 to be held in Sydney on the 16th April at Doltone House Jones Bay Wharf.

This is the third annual event and is designed to bring various industry players, private equity, venture capital, innovators and regulators together to share insights at the inflection point of the fintech revolution as it moves “from marginal into the mainstream”.

The revolution underway is partly being driven by new innovative players and platform providers who can move quickly, without legacy, whilst larger more established players wrestle with legacy systems and culture, yet some are now beginning to see the potential. The potential opportunity is significant, not just paving the cowpaths, but to create totally new business models and new customer value propositions.

Glenn believes the large incumbents will increasing be focussing on “big corporate” borrowers, which creates space for small fleet of foot players to address in particular lending in the consumer and small business sectors.  Of course there are also a myriad of cashed up investors seeking to get footholds into the opportunity stack

AltFi have strong connections with London, and they believe Australia is currently perhaps 4-5 years behind the leading edge there. This creates opportunity to learn from events overseas, as well as from New Zealand, Israel and local success stories.

Glenn was keen to underscore the fact that the conference is not a “scatter gun” of concepts, from the alphabet soup which is Fintech, but rather he wants to drill into a small number of high potential critical areas, from lending, payments and robo advice.

Topics scheduled include global case studies in alternative finance, the thought leaders in the Australian Banking and Finance Industry, Digital Mortgage lending, Microfinance, alternative SME lending and point of sale credit.

This is rich menu, and the event is likely to be well frequented.

You can get 20% off the conference price by using this link, and the promotional code DigitalFinanceAnalytics.

I get nothing from this, but it does offer some additional benefit to DFA Blog readers! I may see you there.

Courting co-owners to buy a house online may be riskier than it looks

From The Conversation.

Digital platforms are offering people who couldn’t afford a house on their own, the opportunity to divvy up the costs with others. But co-ownership of real estate can be a risky and potentially costly business.

In an environment of high residential prices where families are becoming a smaller proportion of households, and permanent relationships are giving way to transient and more distant connections, digital platforms for co-ownership are filling an emerging need.

Co-ownership permits a whole range of sharing options. For example, it allows an occupant to be a part owner in their own home even if they cannot afford to buy the whole thing. It also permits an investor to take a smaller position as a promise of a better relationship with the tenant.

However, buying or selling a property involves legal, financial, statutory and agency costs that mean that even moving across the road can cost about half a year’s income. This means that you need to be sure of what you are doing and reasonably confident that you will not be changing your mind about your investment too quickly.

Digital platforms like Kohab are using the legal relationship known as “tenancy in common” to facilitate co-ownership. It permits the separate parties to have a defined share of the house and to transfer their interests independently.

But this still presents considerable practical risks. Someone wanting to sell their share of a house is likely to find a limited market of other people willing to take over the part ownership, and they are likely to have a weaker negotiating position in selling.

The remaining co-owners of a house also have no control over who the incoming partner will be. This may limit their preferences in relation to how the property should be managed. It can make remaining with the investment uncomfortable and lead to even more turnover of ownership and the prospects of sale at a discount.

How co-ownership has changed over the years

Shared real estate ownership has been evolving for some time. The strata title system was introduced over 50 years ago when it became necessary for single buildings to be owned by multiple people.

Company title co-ownership was unpopular because the co-owners did not always agree on how to manage their property. It was also unpopular because sale of part-interests was difficult and often settled at a discount to true value.

However, it overcame the problems of management and resale that dogged the earlier company title. This approach used company shares to split ownership of a property between several investors.

Australia was later an innovator in the development of property trusts that applied the company model, but with someone to manage the the shared ownership of complex properties.

These property trusts have blossomed as an investment and are now commonly known by their US name – real estate investment trusts. These trusts usually focus on commercial buildings where they provide a vehicle for small investors to access property investment in major real estate assets.

Where digital platforms come in

Online applications such as DomaCom or BrickX have brought the trust model online and applied it to smaller properties that are not usually the target of these traditional trusts. BrickX for example divides its selected investment properties into 10,000 “bricks” and allows investors to buy bricks.

This permits up to 10,000 owners for an individual property. It also allows small investors to spread their funds across multiple properties to control their risks. DomaCom follows a different strategy to achieve the same goal of allowing a large number of investors to be involved in individual managed investment properties.

Then there’s new apps like Kohab. Its point of difference is that it operates on a smaller and perhaps more intimate scale.

It does not rely on a crowdfunding approach, but uses its online platform to connect owner/occupiers and investors for the purpose of co-ownership. It does not produce real estate investment trusts, but does facilitate the co-ownership of individual dwellings by more than one owner.

In capital cities it is getting harder for individuals and families to afford properties. Co-ownership with others, either as shared occupants, or distant investors, is one way to cross the rent/buy gap. But it’s not without risk

Author: Garrick Small, Associate Professor, CQUniversity Australia

Latest Household Debt Figures A Worry

The RBA updated their E2 – Selected Household Ratios today to the end of December 2017.

This series used data from the Australian Bureau of Statistics (which were recently adjusted to remove the impact of  superannuation on the data), plus some RBA supplied data. The series is updated each quarter.

We will walk though these charts, as they highlight some of main and concerning dynamics around household finances.

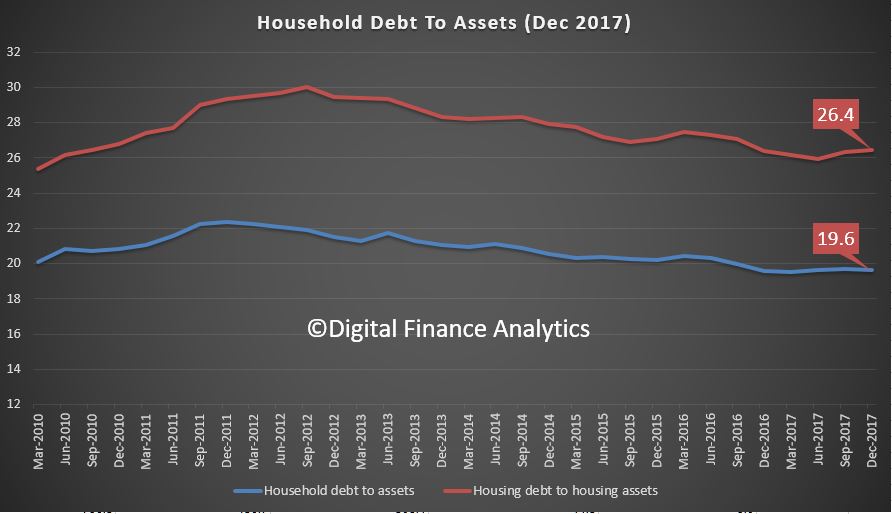
First, here is the plot of Ratio of household debt to household assets, and the Ratio of housing debt to housing assets. Both are moving up a little, reflecting stronger loan growth, relative to asset prices and home prices.

Corelogics home price index to end March also out today showed prices in most of the main centes are slipping. They said:

Trends across the March quarter showed that capital city home values were 0.9% lower over the March quarter, while values across the regional markets have tracked 1.1% higher. Focusing on the capital cities, six of the eight capital cities have recorded a fall in values over the first quarter of 2018, ranging from a 1.8% drop in Sydney values to a 0.1% fall in Darwin.

Sydney unit values are up 1.9% over the past twelve months, while house values are down 3.8%. Similarly in Melbourne, unit values are 6.6% higher over the past twelve months while house values  are up just 4.9%.

So this means that ahead, we expect prices to slide relative to the debt outstanding, thus, these ratios will go higher.  Household with property have had their balance sheets flattered by the appreciating capital growth, but these same balance sheets will now fall under greater pressure.

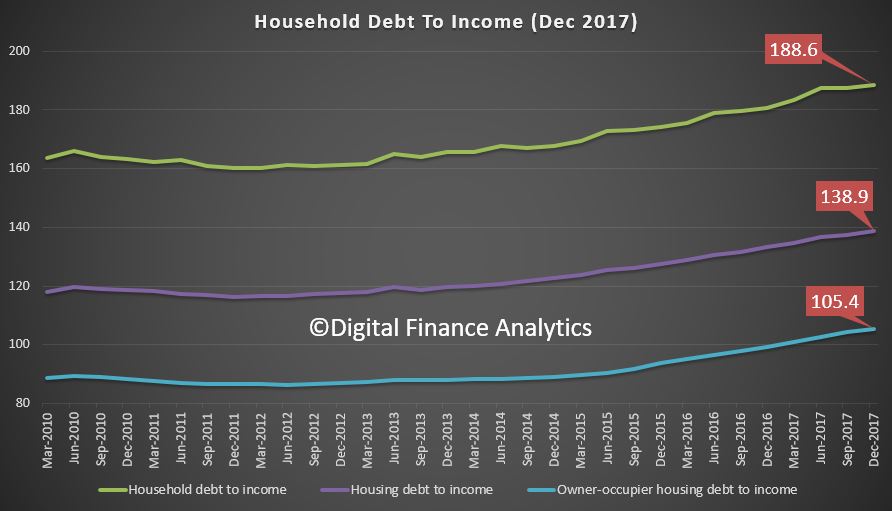
The second chart shows the household debt to income ratios, including Ratio of housing debt to housing assets, Ratio of housing debt to annualised household disposable income and Ratio of owner-occupier housing debt to annualised household disposable income. All these are rising, and have been since 2012. During that time, lending to households has been very strong, whilst incomes have been stalling, and in real terms falling into reverse. To me this is a very concerning metric because it shows that greater leverage households have and so the exposure to rising rates.

The RBA, in their statement today when  they left the cash rate unchanged – said:

The housing markets in Sydney and Melbourne have slowed. Nationwide measures of housing prices are little changed over the past six months, with prices having recorded falls in some areas. In the eastern capital cities, a considerable additional supply of apartments is scheduled to come on stream over the next couple of years. APRA’s supervisory measures and tighter credit standards have been helpful in containing the build-up of risk in household balance sheets, although the level of household debt remains high.

So, they are aware of the high debt, but APRA’s moves will only help new loans, now being written, they will not assist the many households with loans written on the earlier looser standards. This is the real pinch point, and we estimate that now 950,000 households are in mortgage stress to end March, a new record – watch out for our detailed analysis of mortgage stress in a few days.

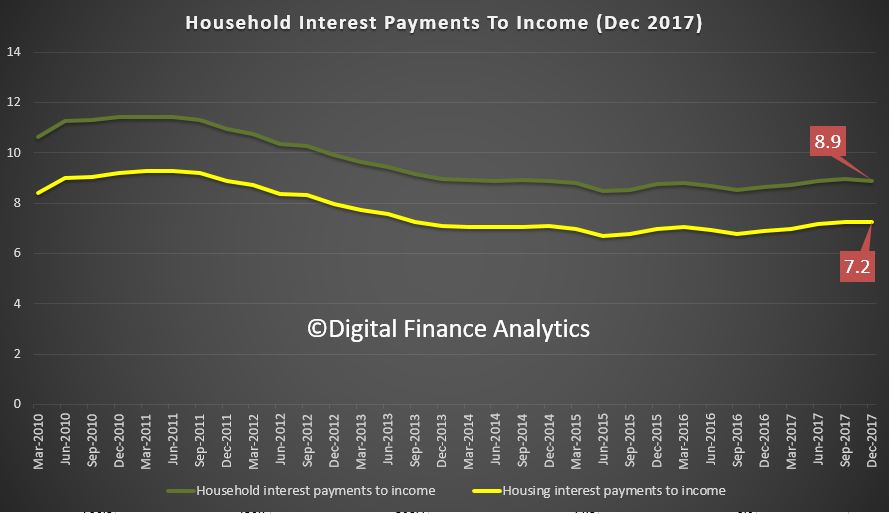
Finally, here are two ratios from the RBA, Ratio of interest payments on housing and other personal debt to quarterly household disposable income AND Ratio of interest payments on housing debt to quarterly household disposable income. So far I have not been able to find out how these are calculated by the way.

The standard RBA argument is that the low interest rates mean the proportion of income, on average required to service a loan is lower than in 2011, thanks to the very low interest rates.

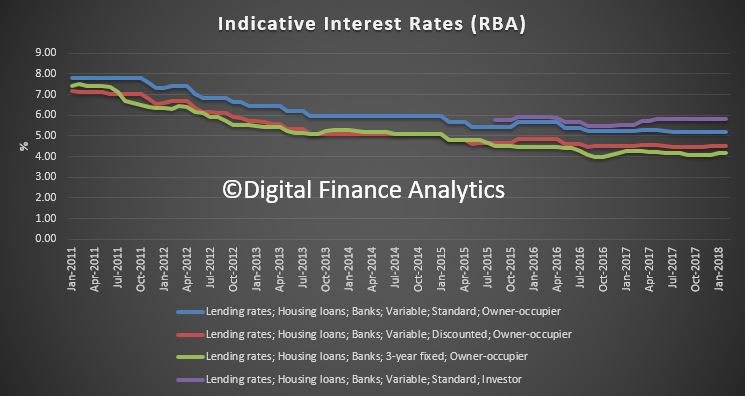
Compare the chart above with the next one. Here are the indicative interest rates from the RBA, (F5) from 2011 onward.

The fall in rates is significant – for example the variable discounted rate in 2011 was 7.05%, now it is 4.45%, so down 2.6%, according to the RBA data.

But the housing interest payment ratio in contrast is 7.2 compared with 9.2 in 2011, so  down just 2%. But translate these to percentage changes and whilst interest rates have dropped by 58.4%, repayments dropped by only 27% over the same period because the average loan is now larger so payments are relatively larger relative to income. So again, we see the impact of large loans on household balance sheets. This is a massive difference.

And of course the final piece of the puzzle is the impact of rates rising from here. Our sensitivity analysis suggests that 1% rate rise would tip well more than one million households into difficulty, and the impact on the interest payment to income ratio would therefore be significant.

Households are leveraged to the hilt. We may have tighter controls on lending now (some would say this is debatable given the active non-bank sector). But the die is cast for people with large existing mortgages, flat incomes, rising rates and household expenses growing.

Combined these charts tell a sorry tale.

RBA Hold Once Again (No Surprise)

At its meeting today, the Board decided to leave the cash rate unchanged at 1.50 per cent. They mentioned that the level of household debt remains high, and inflation may rise ahead, from its current low base. They are projecting stronger growth ahead (but we will see!)

The global economy has strengthened over the past year. A number of advanced economies are growing at an above-trend rate and unemployment rates are low. The Chinese economy continues to grow solidly, with the authorities paying increased attention to the risks in the financial sector and the sustainability of growth. Globally, inflation remains low, although it has increased in some economies and further increases are expected given the tight labour markets. As conditions have improved in the global economy, a number of central banks have withdrawn some monetary stimulus and further steps in this direction are expected.

Long-term bond yields have risen over the past six months, but are still low. Equity market volatility has increased from the very low levels of last year, partly because of concerns about the direction of international trade policy in the United States. Credit spreads have also widened a little, but remain low. Financial conditions generally remain expansionary. There has, however, been some tightening of conditions in US dollar short-term money markets, with US dollar short-term interest rates increasing for reasons other than the increase in the federal funds rate. This has flowed through to higher short-term interest rates in a few other countries, including Australia.

The prices of a number of Australia’s commodity exports have fallen recently, but remain within the ranges seen over the past year or so. Australia’s terms of trade are expected to decline over the next few years, but remain at a relatively high level.

The Australian economy grew by 2.4 per cent over 2017. The Bank’s central forecast remains for faster growth in 2018. Business conditions are positive and non-mining business investment is increasing. Higher levels of public infrastructure investment are also supporting the economy. Stronger growth in exports is expected after temporary weakness at the end of 2017. One continuing source of uncertainty is the outlook for household consumption, although consumption growth picked up in late 2017. Household income has been growing slowly and debt levels are high.

Employment has grown strongly over the past year, with employment rising in all states. The strong growth in employment has been accompanied by a significant rise in labour force participation, particularly by women and older Australians. The unemployment rate has declined over the past year, but has been steady at around 5½ per cent over the past six months. The various forward-looking indicators continue to point to solid growth in employment in the period ahead, with a further gradual reduction in the unemployment rate expected. Notwithstanding the improving labour market, wages growth remains low. This is likely to continue for a while yet, although the stronger economy should see some lift in wages growth over time. Consistent with this, the rate of wages growth appears to have troughed and there are reports that some employers are finding it more difficult to hire workers with the necessary skills.

Inflation remains low, with both CPI and underlying inflation running a little below 2 per cent. Inflation is likely to remain low for some time, reflecting low growth in labour costs and strong competition in retailing. A gradual pick-up in inflation is, however, expected as the economy strengthens. The central forecast is for CPI inflation to be a bit above 2 per cent in 2018.

On a trade-weighted basis, the Australian dollar remains within the range that it has been in over the past two years. An appreciating exchange rate would be expected to result in a slower pick-up in economic activity and inflation than currently forecast.

The housing markets in Sydney and Melbourne have slowed. Nationwide measures of housing prices are little changed over the past six months, with prices having recorded falls in some areas. In the eastern capital cities, a considerable additional supply of apartments is scheduled to come on stream over the next couple of years. APRA’s supervisory measures and tighter credit standards have been helpful in containing the build-up of risk in household balance sheets, although the level of household debt remains high.

The low level of interest rates is continuing to support the Australian economy. Further progress in reducing unemployment and having inflation return to target is expected, although this progress is likely to be gradual. Taking account of the available information, the Board judged that holding the stance of monetary policy unchanged at this meeting would be consistent with sustainable growth in the economy and achieving the inflation target over time.

March Home Prices On The Slide (Some Regional Areas Excepted)

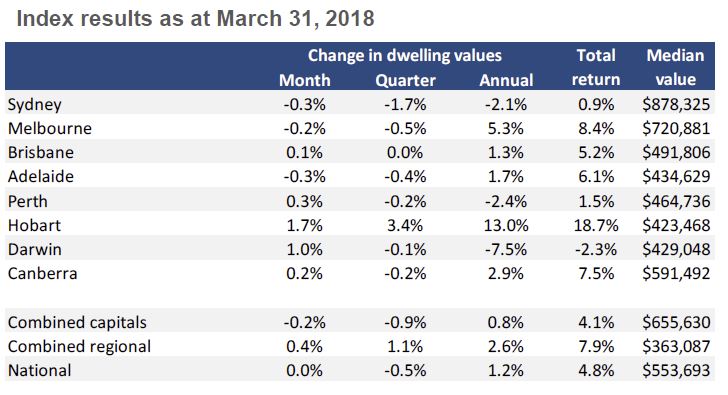
CoreLogic has released their March Index results. Their hedonic home value index showed national dwelling values were unchanged in March, with the steady month on month reading comprised of a 0.2% fall in capital city dwelling values while the combined regional markets saw values rise by 0.4%.

Trends across the March quarter showed that capital city home values were 0.9% lower over the March quarter, while values across the regional markets have tracked 1.1% higher. Focusing on the capital cities, six of the eight capital cities have recorded a fall in values over the first quarter of 2018, ranging from a 1.8% drop in Sydney values to a 0.1% fall in Darwin.

Sydney unit values are up 1.9% over the past twelve months, while house values are down 3.8%. Similarly in Melbourne, unit values are 6.6% higher over the past twelve months while house values  are up just 4.9%.

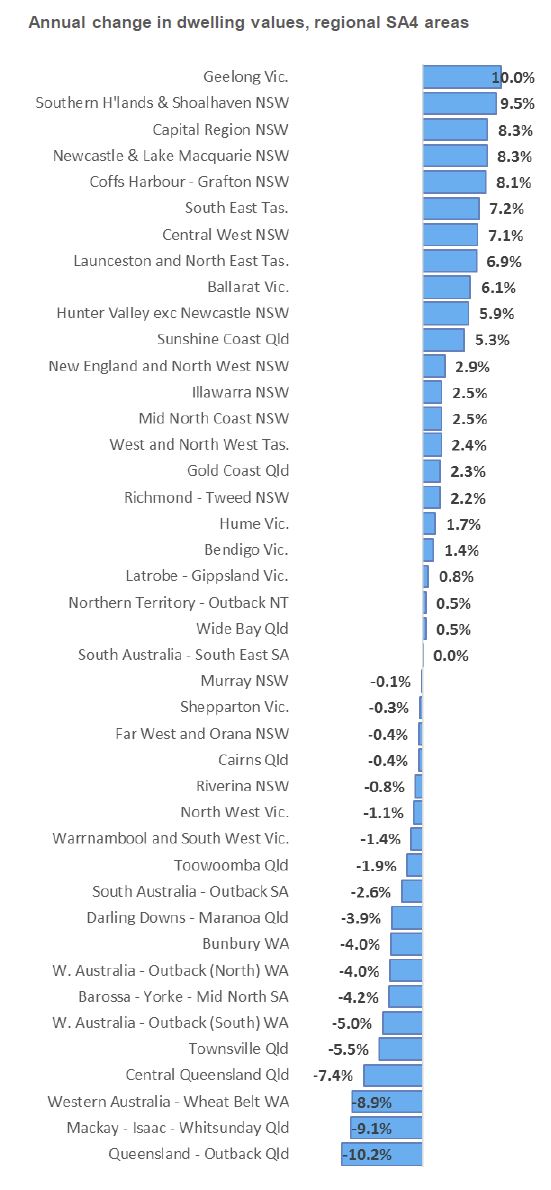
Movements were stronger in some regional centers, with Geelong the strongest over the past year, and Outback Queensland the weakest.

ANZ Job Ads Flat In March

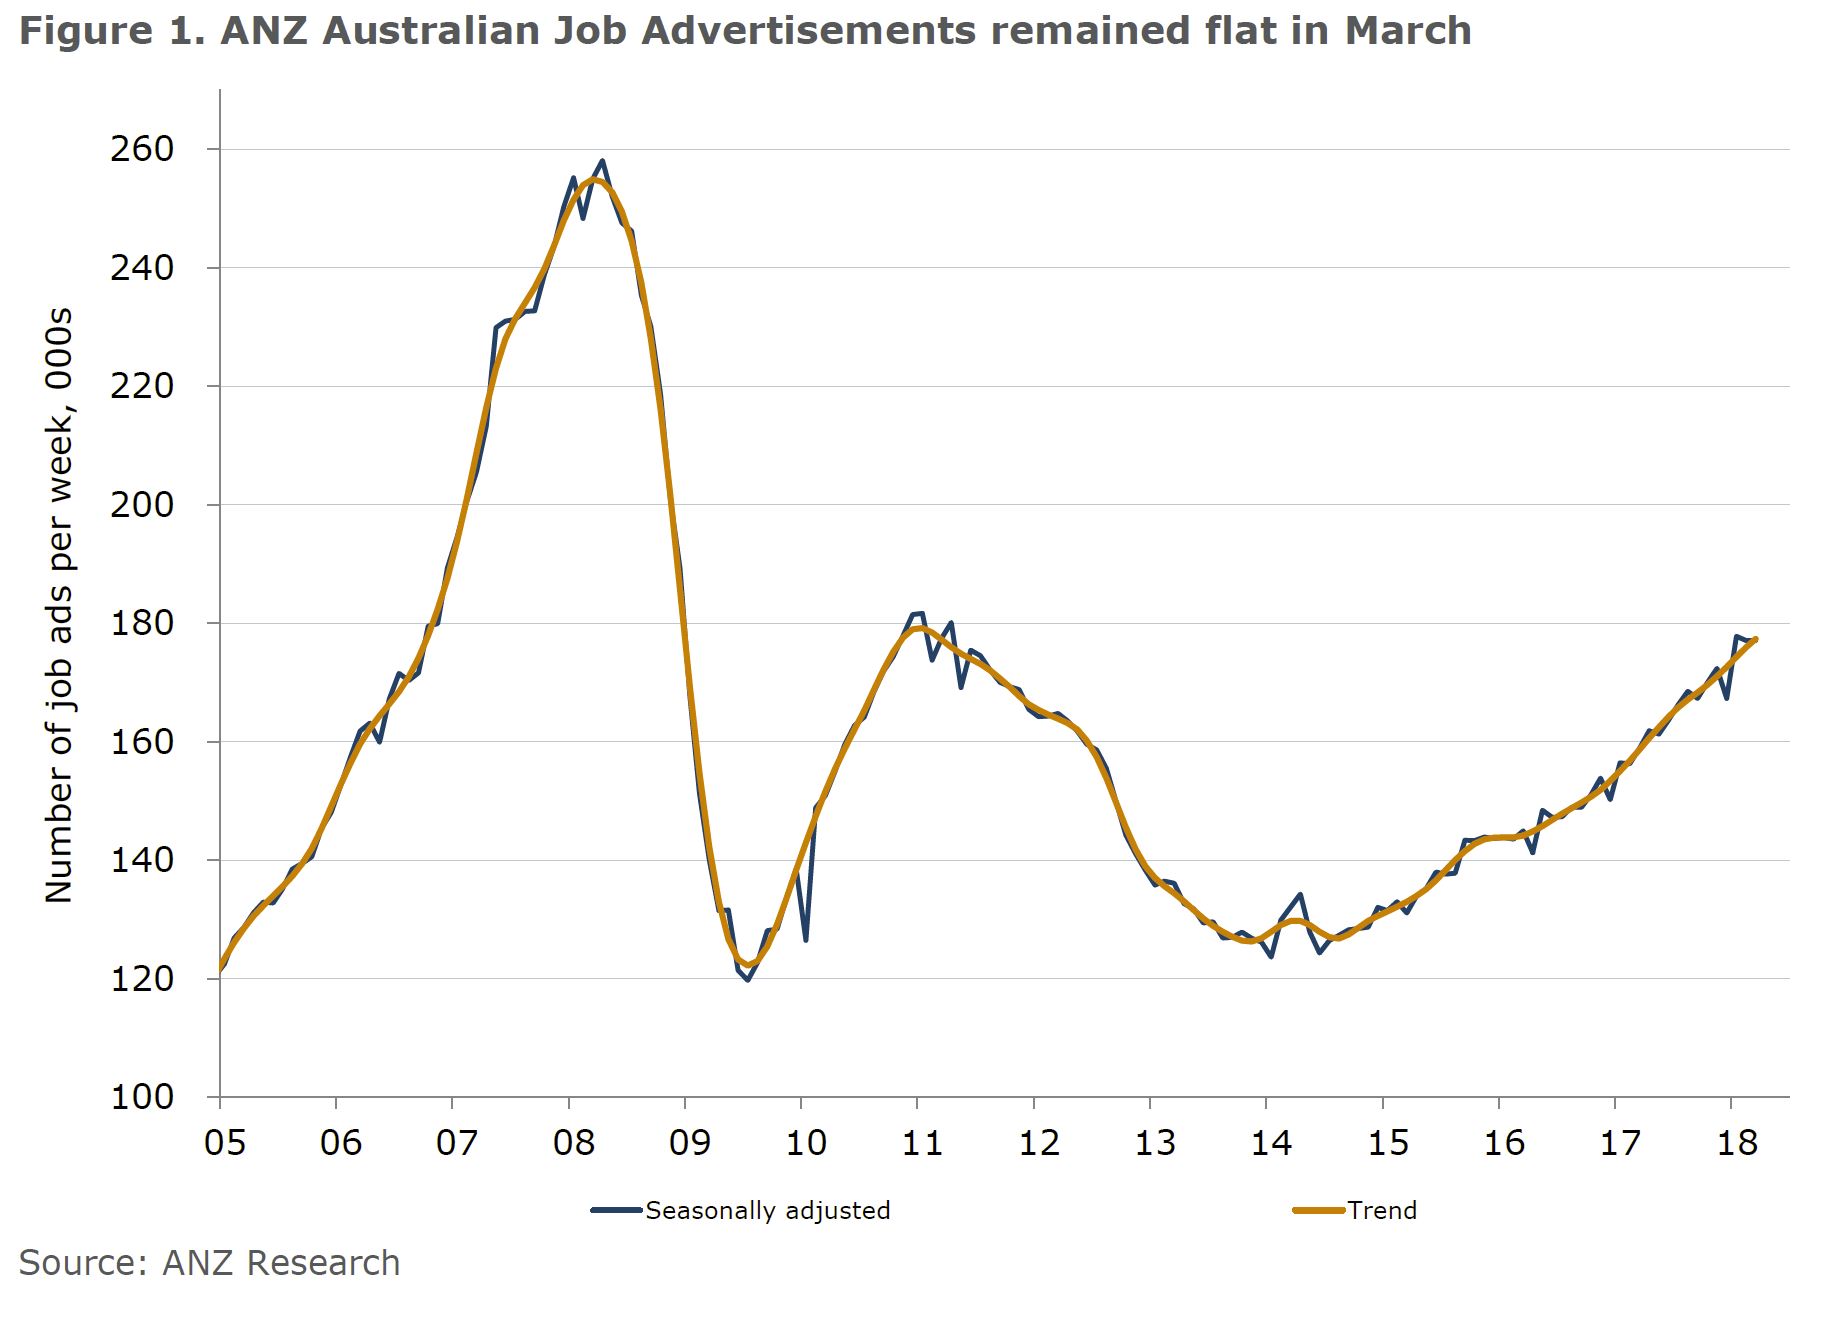
ANZ says that Australian Job Advertisements was flat (0.0% m/m) in March, after easing slightly (-0.4%) in February. The number of job ads currently sits 11.5% higher than a year ago.

In trend terms, job ads were up 0.8% m/m in March, edging down from a 0.9% rise in the previous month. The annual trend rate slowed from 12.2% in February to 11.8% last month.

ANZ’S HEAD OF AUSTRALIAN ECONOMICS, DAVID PLANK, COMMENTED:

“Despite ANZ Job Ads easing slightly in the past two months, the strong January result means that job ads are up 4.4% q/q in Q1. Interestingly, after a period of employment growth overshooting growth in job ads, the two series appear to be converging once more.

Despite the recent stability in ANZ Job Ads, the labour market remains robust. The level of job ads is consistent with continued strength in employment growth, though we do expect some slowdown in the pace in which jobs are added. Businesses reported record conditions in February and the uptrend in capacity utilisation suggests that the unemployment rate will slowly grind lower through the year. The recent uptick in the unemployment and underemployment rate, however, shows that spare capacity is reducing only gradually indicating that wage growth is likely to remain muted for some time yet.”

Fed Lifts Commercial Real Estate Limit

In a further sign of loosening of rules in the US, the Board of Governors of the Federal Reserve System, the Federal Deposit Insurance Corporation, and the Office of the Comptroller of the Currency issued a final rule that increases the threshold for commercial real estate transactions requiring an appraisal from $250,000 to $500,000.

They say the increased threshold will not pose a threat to the safety and soundness of financial institutions. “Commenters opposing an increase to the commercial real estate appraisal threshold asserted that an increase would elevate risks to financial institutions, the banking system, borrowers, small business owners, commercial property owners, and taxpayers. Several of these commenters asserted that the increased risk would not be justified by burden relief”.

The agencies originally proposed to raise the threshold, which has been in place since 1994, to $400,000, but determined that a $500,000 threshold will materially reduce regulatory burden and the number of transactions that require an appraisal. The agencies also determined that the increased threshold will not pose a threat to the safety and soundness of financial institutions.

The final rule allows a financial institution to use an evaluation rather than an appraisal for commercial real estate transactions exempted by the $500,000 threshold. Evaluations provide a market value estimate of the real estate pledged as collateral, but do not have to comply with the Uniform Standards of Professional Appraiser Practices and do not require completion by a state licensed or certified appraiser.

The final rule responds, in part, to concerns financial industry representatives raised that the current threshold level had not kept pace with price appreciation in the commercial real estate market in the 24 years since the threshold was established and about regulatory burden during the Economic Growth and Regulatory Paperwork Reduction Act review process completed in March 2017.

Would A Loan Comparison Tool Compete With Brokers?

From The Adviser.

A loan comparison tool proposed by the Productivity Commission could compete with the broker channel, according to six of Australia’s largest non-major banks.

In a joint submission to the Productivity Commission (PC), AMP, the Bank of Queensland, Suncorp, Bendigo Bank, MyState and ME Bank warned that an online loan comparison tool could undermine the broking industry.

In its draft report, the PC called for the Australian Prudential Regulation Authority (APRA) to collect interest rate and fee data and use it to determine a median rate that would be published via an online tool.

The PC claimed that such a reform could help increase transparency for customers and enhance competition.

The non-majors claimed that a proposed comparison tool with the “authority of a government agency” could undermine the broker channel.

“[The] online tool would, in some respects, compete with the broker channel, particularly given the proposal is for the comparison tool to have the authority of a government agency standing behind it,” the banks stated.

“Such an approach could potentially undermine the broker industry and eventually favour the banks with larger bricks and mortar networks,” the banks added.

Further, the lenders argued that the publication of a median interest rate could “mislead customers”.

“While this has the potential to improve competitive pressure from the demand side of the market, it may also involve considerable practical difficulties,” the submission read.

“More importantly, it may mislead customers as to the true cost of a product. The main problem with such tools is that they have a tendency to lead to ‘gaming’, whereby suppliers develop products that rate well on the tool but have shortcomings in other areas.

“For example, comparison tools have difficulty capturing the full benefits of a ‘bundle’ of services offered by a financial institution.”

The banks claimed that the tool could also create an incentive for some lenders to “shift costs” to products and services outside the tool’s scope.

“They also provide an incentive for suppliers to increase costs for services outside the scope of required disclosures. For example, in the case of mortgages, suppliers could shift costs to account closing or switching fees,” the submission said.

Additionally, the banks claimed that the tool could instigate a “race to the bottom”, with lenders creating products that “fall short of expectations”, potentially requiring regulatory intervention.

The lenders said: “[Some] financial institutions may respond by choosing not to offer services outside what the tool requires, and consumers could end up with products that fall short of expectations.

“Such an approach could see suppliers in a race to the bottom, offering only the most basic and feature-free products in order to present the most attractive median interest rates to the comparison tool.

“This would then inevitably result in additional regulatory interventions as governments attempt to patch over the shortcomings of the tool.”

Broker remuneration

Moreover, the banks advised against changes to the broker remuneration model, claiming that “consumers have a strong tendency to resist paying for services”.

The lenders added that “disruption” to the broking industry’s remuneration model could have a “material” impact on market competition.

“A significant disruption to the economic viability of the broker industry would be a material competitive neutrality issue for smaller banks.”

“Disclosure of mortgage broker ownership is a priority”

In their submission, the banks also expressed support for the PC’s call for increased disclosure for mortgage brokers.

The non-majors noted that they believe customers should “know the identity of the broker’s owner”, and they claimed that the level of business activity directed to an aggregator’s owner or associated company should also be published.

“[We] believe it is important to ensure that the customers of mortgage brokers know the identity of the broker’s owner so they can factor this information into their decision-making process.

“In addition to ownership disclosure, [we] recommend that broker networks and aggregators publish information showing the amount of business directed towards their owners or associated companies, relative to the proportion directed elsewhere.”

Debt Monetisation And Bank Lending

Has the FED’s increased recent debt monetisation enabled US banks to lend out more money than they otherwise would?  This is an important question, given the current round of rate tightening, and the potential impact down stream. So a recent article from the St. Louis On The Economy Blog makes interesting reading.

One can think of the government as issuing three types of nominal liabilities:

  • Currency
  • Central bank reserves
  • Treasury debt

Historically, currency and central bank reserves are considered money, whereas Treasury debt is not. Hence, to finance the deficit—the difference between government revenue and expenditures—the government needs to borrow money. The burden of finance is reduced if the central bank transforms high-interest government debt into low-interest reserves. The act of converting debt into money is often labeled “debt monetization.”

Reserves and the Money Supply

The creation of reserves increases the supply of base money. The reserves of chartered banks are held at the central bank and play an important role in the banking system.

In particular, banks finance a variety of investments by creating their own form of money—demand deposit liabilities, such as checking accounts—which are convertible on demand for currency. Note that private banks do not lend reserves: They lend the liabilities they create, and these liabilities are then convertible into currency at the discretion of “depositors” (those who have demand deposit accounts with banks).

Banks are motivated to keep some minimum level of reserves on hand to meet everyday redemption requests for currency and to settle their obligations with other banks on the interbank market for federal funds.

Spurring Lending

But because the interest earned on reserves is typically low (historically, zero), banks are motivated to increase their lending to the point that their demand deposit liabilities can no longer be safely increased, lest they fail to meet their obligations for redemption and settlement. In this way, debt monetization can increase the total money supply, which includes currency, reserves and bank deposit liabilities.

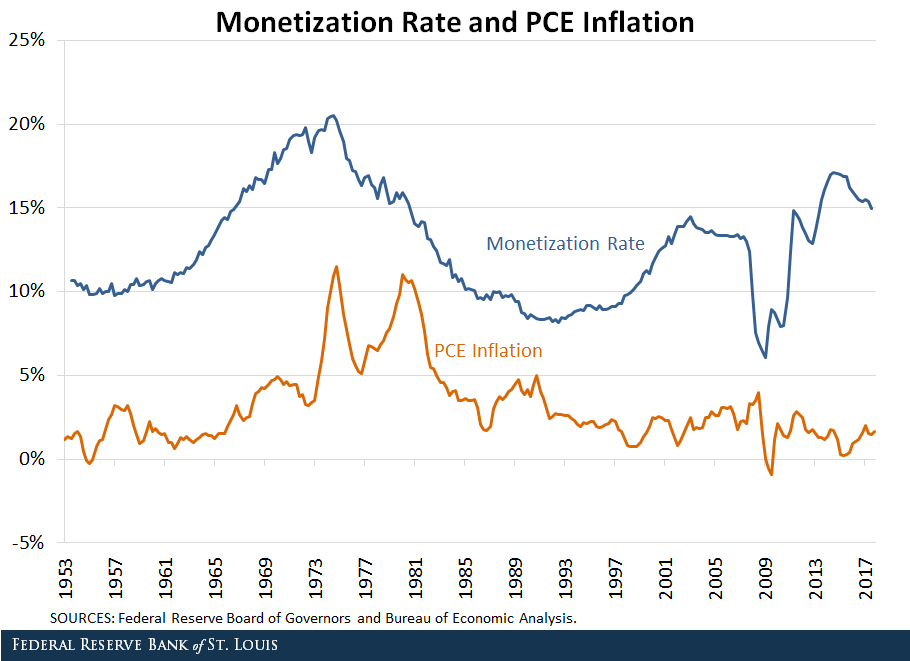
The figure below plots the percent of debt held by the Federal Reserve—the monetization rate—against personal consumption expenditures (PCE) inflation.

Monetization Rate and PCE Inflation

From 1953 to 1974, the monetization rate increased hand-in-hand with inflation, with both peaking near the end of 1974. The positive correlation between the two indicators during this span seems consistent with the expectation that debt monetization puts upward pressure on inflation.

From 2009 to 2017, the monetization spiked up at an even faster rate. However, this time the inflation rate stayed more or less constant. Why might the former episode of monetization have been inflationary while the latter was not?

The Interest Rate Spread

When the Fed buys a large amount of federal debt, as it did during these two time periods, it injects a large amount of reserves into the banking system to pay for those purchases. Commercial banks have two options of what to do with these additional reserves:

  • Use them to make more loans to customers
  • Hold onto them

All else equal, banks will pick whichever option is more profitable, which depends on (among other things) the spread between the interest rate it can charge on consumer/business loans and the interest rate it earns by holding reserves. The larger the spread, the more profitable it is for a bank to lend, and the more likely that a bank increases its lending.

Monetization of the Debt: Then

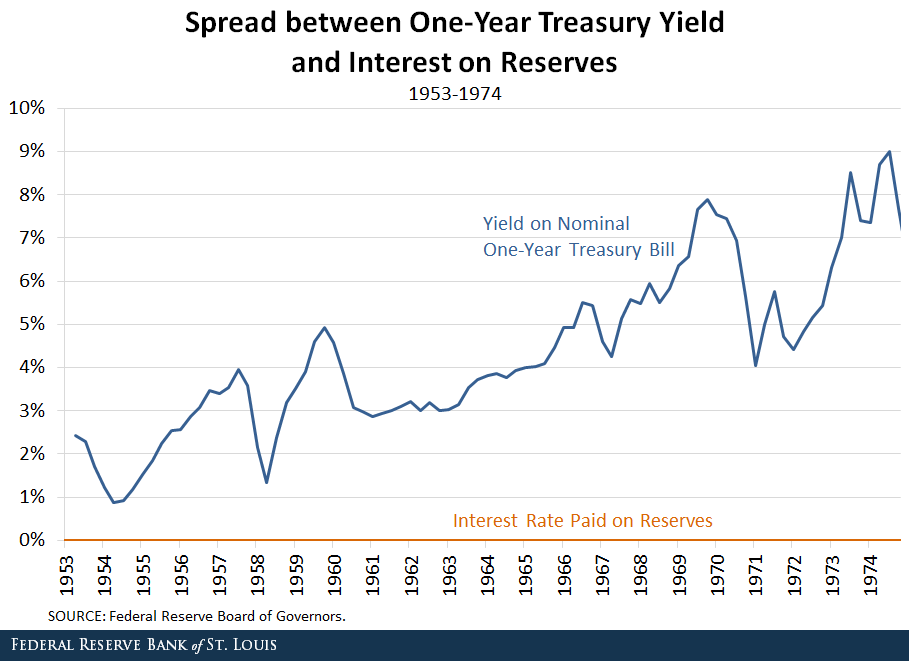
The figure below plots the spread between the yield on a one-year Treasury bill (a measure of short-term interest rates) and the interest rate paid on reserves from 1953 to 1974.

Spread between One-Year Treasury Yield and Interest on Reserves (1953-1974)

As the Fed ramped up its debt monetization during this span, the average rate of interest on a one-year Treasury bill was about 5 percent, and the interest rate paid on reserves was literally zero.

With the spread between interest rates so large, banks had more incentive to use their newfound reserves to make loans than to hold onto them. These loans would then create money, which would boost the money supply and have inflationary effects. While several factors led to the Great Inflation of the 1970s, the gradual rise in the monetization rate was likely a significant one.

Tightening of the Spread

However, the interest rate spread has narrowed significantly in recent years for several reasons:

  • Since the financial crisis of 2007-08, the federal funds rate target has been near zero, keeping short-term interest rates low throughout the economy.
  • The demand for federal debt rose greatly after the start of the crisis, pushing bond prices up and bond yields down.
  • Beginning in 2008, the Fed began to pay interest on reserves held by its member banks.

Monetization of the Debt: Now

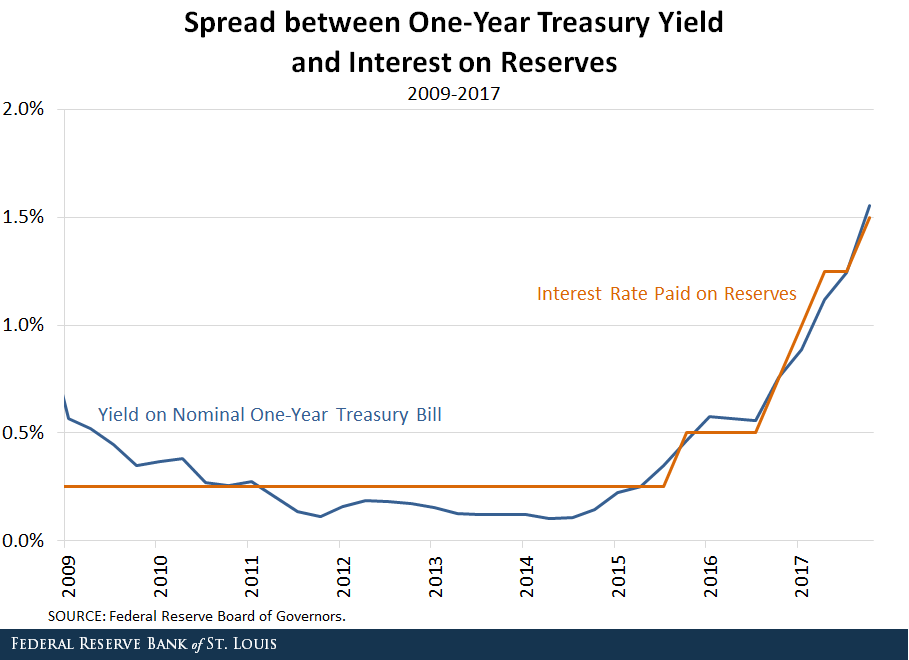
As shown in the next figure, during the spike in debt monetization from 2009 to 2017, the spread between short-term interest rates and the interest paid on reserves was essentially zero.

Spread between One-Year Treasury Yield and Interest on Reserves 2009-2017

Unlike during the first scenario, banks now had no incentive to use their newfound reserves to increase their lending. After all, it would be just as profitable to hold onto those reserves. In fact, at times the spread was even negative, making it more profitable to hold reserves.

As such, there was little to no upward pressure on prices. The Fed’s increased debt monetization didn’t lead banks to lend out more money than they otherwise would. Contrary to the episode from 1953 to 1974, banks could make a profit holding onto reserves, which doesn’t create new money and ultimately doesn’t have the same inflationary effects as increased lending does

But the article also highlights a fundamental fallacy, namely that deposits leads loans. Actually, we now know this is incorrect, and that banks can create loans first, which flow TO deposits. So the fundamental assumption they make seems incorrect. Therefore, their conclusions may be suspect! In addition, we know US consumer debt is still very high now at 80% of US GDP!  More importantly, it reduces the potential impact central bank have on the economy in terms of credit availability.