Please consider supporting our work via Patreon
Please share this post to help to spread the word about the state of things….

Digital Finance Analytics (DFA) Blog
"Intelligent Insight"
We review the latest lending statistics
Please consider supporting our work via Patreon
Please share this post to help to spread the word about the state of things….

The latest data from APRA, the monthly banking stats to June 2018 show that the banks are still busy lending for home loans. Total balances rose in the month by $9.2 billion, to $1.64 trillion. Within that lending for owner occupied housing rose $7.1 billion, up 0.68% to $1.08 trillion and lending for investment property rose 0.38% to $558 billion. Investment lending comprised 34% of the portfolio, and fell slightly as a result.
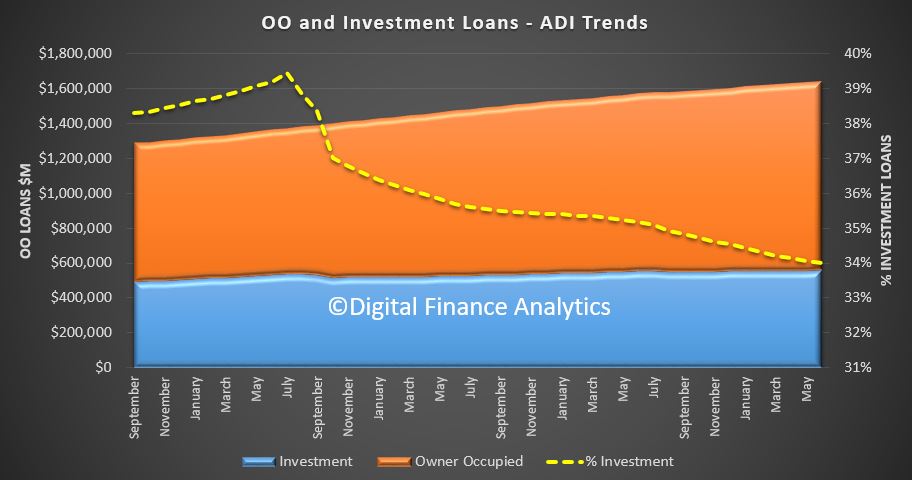 The trend growth, over the months is accelerating. Total credit is still growing at an annualised rate of 6.7%, scary, when incomes and cpi are circa 2% and we have some of the highest debt to income ratios globally.
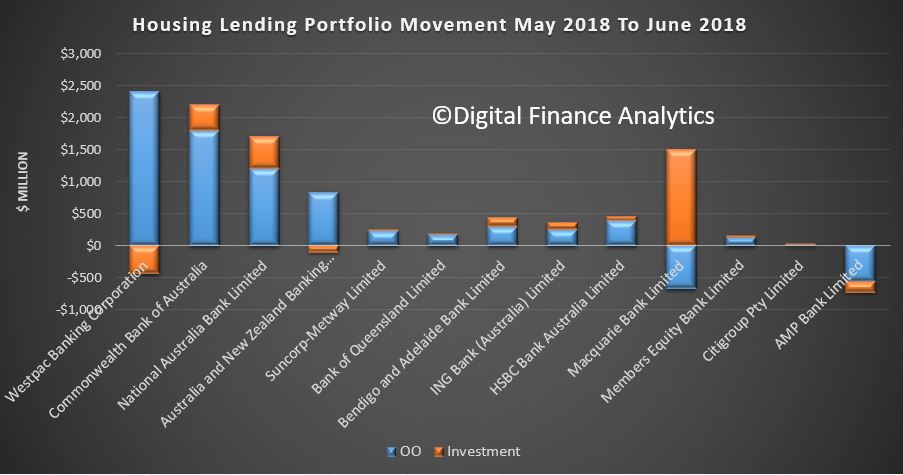
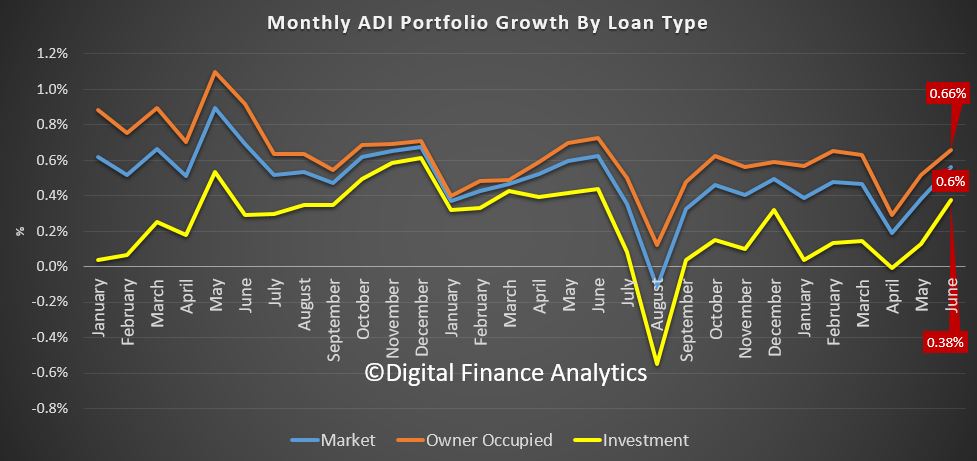 Looking at the individual lenders portfolio movements, we see that Westpac have been focusing on owner occupied lending growth, while their investor balances fell a little, a similar pattern to the ANZ. On the other hand, both CBA and NAB grew their investor loan books, having given up share in recent months. But Macquarie bank lifted their investor loan book significantly.
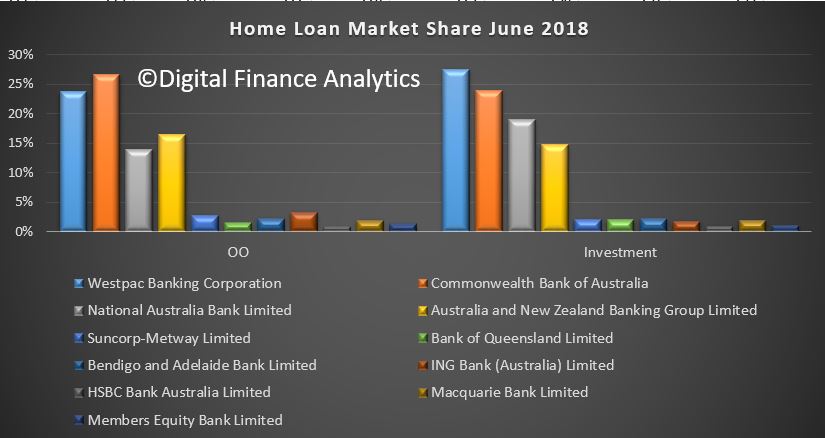
 Overall shares did not move that much in the month, with CBA still the largest owner occupied lender, and Westpac the largest investment loan lender.
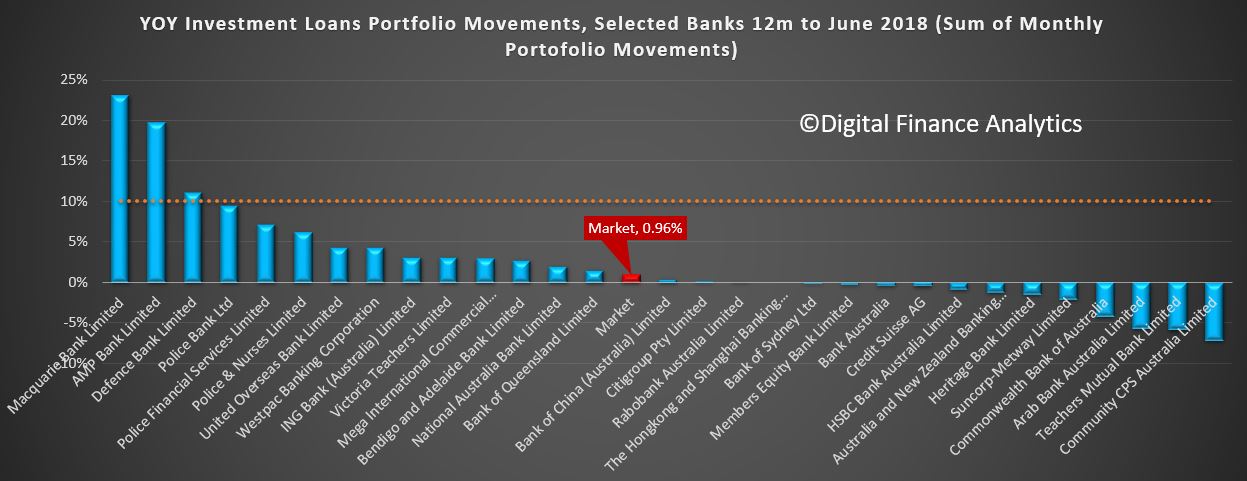
 We also updated our annual portfolio movements for investor lending (despite the APRA 10% speed limit no longer being relevant). We see that Macquarie shows the strongest growth in investor lending, alongside AMP Bank, and some of the smaller players. The market annual effective growth rate is 0.96%. ANZ and CBA are in negative territory across the last 12 months.
 So in summary, home lending is alive and well, which given the current falls in home prices is a concern – but many households are refinancing to lower cost loans, taking advantage of the wide range of deals out there, for some. But investment lending remains in the doldrums, if a little off its lows.
Clearly the regulators are betting that income growth will snap back up, allowing for households to service their massive debt burden, but as prices fall for the straight 10th month, and all else being equal its hard to see an easy way out from the debt bomb, as rates rise in the months ahead.
We discuss the latest APRA bank stress tests, and run our own.
In Wayne Byers speech yesterday – the one in which he said an 8% growth rate in residential home lending was “healthy (!)… he also covered the “stress testing”processes with the banks, and gave them a clean bill of health.
 We ran our own scenario on our Core Market Model, using their worst case baseline, and we get a result much closer to the LF Economics scenarios we posted early than the APRA outcome. In fact we think the LF Economics numbers may themselves be conservative.
In addition from APRA, we get no detail on their work, and no individual bank level disclosure (unlike the US version). So we do not find the APRA version very credible. Which is a worry. Clearly their strategy is “just trust us” – just as they did with the now revealed poor lending practice.
So to summarize the “tests” are:
In addition, banks had to consider an operational risk loss event involving misconduct and mis‑selling in the origination of residential mortgages. The additional operational risk element served as an amplifier of the stress, adding a further shock to bank balance sheets.
The result is a reduction in bank capital and credit losses of around $40 billion on their residential mortgage books. What have they assumed about property sales in default we wonder, and what about claims on Lender Mortgage Insurers at an industry level?
In addition, APRA does not really give us much detail of the scenarios (compare this with the US version). Is it a short sharp shock, or a long grind? We suspect the former.
Now, if we run the same scenario through our Core Market Model, based on our household surveys, what happens?
Well, first if banks cannot fund their books from offshore markets, their ability to lend, in aggregate drops by ~30%, unless it can be supplemented by either more deposits, or local investors. Remember that a significant proportion of the non-deposit part of bank books are funded short-term, so the impact will be immediate.
Either way there will be a rationing of credit and a bid up the price of funds – so putting more pressure on margins and mortgage rates. The local markets ability to provide sufficient funding is suspect, and it is likely that the Government via the RBA would have to provide funding, perhaps by the purchase of existing loan portfolios. We doubt the lenders ability to access funding. Loans will be rationed.
Households who are unemployed will be unable to continue to pay their mortgages, and will likely default. We have to assume that specific segments of the market will be most impacted, and we can run analysis on this. In addition some households renting will be unable to pay their rents as they fall due, putting some investment property under pressure.
We estimate that around 15% of mortgage holders will default. We assume that banks will try to assist borrowers, via their hardship schemes, and capitalise interest for a period, rather than foreclose (selling in a falling market just creates more losses).
So over the scenario time frame, using our data, we think credit losses will be will north of $310 billion. This compared with the $40 billion in the APRA results and $298 billion from LF Economics.
So why the difference?
Well, first, we think bank funding costs will be higher, thanks to the network effect of all lenders trying to tap limited sources thus driving rates higher still. APRA appears to have looked at banks individually.
Second, we think more households will be exposed to default risk as unemployment bites. In addition, we think that those remaining employed will have less overtime, and no wage growth so more financial pressure.
Third, the LVR and DTI ratios in our date (based on up to date data) suggests that the risks in the portfolio are actually higher than those used in the APRA (bank sourced) modelling. Some of this is so called “liar-loans” and the rest is multiple debt exposures and changed circumstances. Currently banks are myopic on this.
Fourth, Lender Mortgage Insurers will not be able to meet all claims. Not sure what APRA or the banks assumed. LMI’s might well be one of the first points of failure.
With that in mind, this is what APRA said:
When the storm hits – APRA’s most recent industry stress test
Alongside the gradual improvement in lending standards has been a significant increase in capital within the banking industry. This has been built first on the post-crisis Basel III reforms, and then on the recommendations of the 2014 Financial System Inquiry. As banks reach the “unquestionably strong” benchmarks that we announced last year, it will complete a decade-long build-up of capital strength.
ADI industry capital ratios
That capital exists today so that it can be called on in adversity. In 2017, we conducted our most recent test of banks’ resilience through an industry stress test. The aim of the stress test was not to set capital levels, and consistent with past practice it was not run as a pass or fail exercise. Rather, APRA utilises stress tests to examine the resilience of the largest banks, individually and collectively, and to explore the potential impacts of grim and challenging periods of stormy economic weather.
The scenario for the stress test was designed to be severe but plausible, and to target the key risks facing the industry. The basic scenario was a severe economic stress in Australia and New Zealand, with a significant downturn in the housing market at the epicentre. This was triggered by a downturn in China and a collapse in demand for commodities. The subsequent downgrade in sovereign and bank debt ratings leads to a temporary closure of offshore funding markets, a sell-off in the Australian dollar and widening in credit spreads. Australian GDP falls by 4 per cent, unemployment doubles to 11 per cent and house prices decline by 35 per cent nationally over three years.
Stress test – Real GDP growth
Stress test – House price index
To this traditional macro stress scenario we then added a twist. In addition to the sharp downturn in the economic environment, banks had to consider an operational risk loss event involving misconduct and mis‑selling in the origination of residential mortgages. The additional operational risk element served as an amplifier of the stress, adding a further shock to bank balance sheets.
Before sharing the results with you, I do need to note that these scenarios do not represent our official forecasts! They are obviously quite different from the base-case projections contained in most forecasts for the economy. But that is also why it is so important to test these severe but hopefully hypothetical scenarios – to avoid the risk of disaster myopia and a belief that we are somehow immune to tail risk events, given a benign track record and outlook.
The stress test involved 13 of the largest banks, and our approach was to generate the results in two phases. In the first, banks used their own models and parameters to estimate the impacts of the stress, subject to common guidelines and instructions to ensure a degree of consistency in the results. In the second phase, banks were asked to apply APRA estimates of the stress impacts, based on our own research, modelling, benchmarks and judgement.
While the phase 1 results were useful in shining a light on the banks’ modelling capabilities, and provided a view on what the banks themselves believe the impact of the scenarios would be, I’ll focus on the results from phase 2. These ironed out the kinks in modelling and, in our view, provided a more reliable and consistent set of results at a bank-specific and industry aggregate level.
Chart 11: Proportion of cumulative credit losses
As you would expect given the severity of the macroeconomic scenario, banks incurred significant losses, producing a substantial reduction in capital. Projected losses on the residential mortgages portfolio were large, consistent with the depth of the fall in house prices and the rise in unemployment. Overall, banks projected credit losses of around $40 billion on their residential mortgage books, which was equivalent to a little over a quarter of overall projected loan losses. As a loss rate, this would be broadly consistent with the experience in the UK in the early 1990s, but lower than the losses seen in Ireland or the US during the global financial crisis. It also represented a slightly lower loss rate than in APRA’s previous industry stress test in 2014. Some of this is due to differences in the scenario and in modelling, but it was also arguably reflective of the improvement in asset quality in recent years.
In aggregate, the common equity tier 1 (CET1) ratio of the industry fell from around 10.5 per cent at the start of the scenario to a little over 7 per cent by year three, a fall of more than 3 percentage points from peak to trough. This was driven by a combination of higher funding costs, significant credit losses and growth in risk weighted assets reflecting the deterioration in asset quality. Adding in the operational risk event, the aggregate CET1 ratio fell further to just below 6 per cent, driven by additional costs from customer compensation, redress, legal fees and fines.
CET1 capital ratio results Macroeconomic and operational risk scenario
Despite significant losses, these results nevertheless provide a degree of reassurance: banks remained above regulatory minimum levels in very severe stress scenarios. As importantly, these results have been estimated without assuming any management actions to respond to and mitigate the stress, such as equity raisings, repricing and cost cutting – all of which would occur in reality and lessen the impact. The results therefore represent if not a worst case scenario, then at least a scorecard towards one end of the spectrum of possible outcomes. Once we take into account expected (and plausible) management actions, the banks remain above the top of the capital conservation buffer throughout, and rebuild back towards unquestionably strong levels by the end of the recovery periods.
The funding and liquidity positions of the industry also stood up to the test. Despite difficulties accessing funding markets, most banks maintained their liquidity coverage ratios (LCRs) above 100 per cent through the crisis scenario. Some dropped below 100 per cent, but even then, those banks were able to initiate strategies to restore their position to good order within a reasonable timeframe. This is entirely consistent with how the LCR is intended to operate in severe conditions – liquidity is held in good times so it can be used when needed.
That general reassurance comes, however, with a note of caution. Like weather forecasting, stress testing is an inexact science. Modelling in Australia is complicated by a lack of experience of significant stress and periods of high loan defaults. This is a good problem to have, but it makes the stress testers’ task difficult, and widens the margin for error. That is particularly the case for the mortgages portfolio, and estimates of misconduct losses are of course necessarily judgement-based. In addition, the feedback loops from second order effects and competitor reactions are inherently difficult to model.
Given these challenges, stress testing needs to continue to evolve, and no one scenario can be relied upon for a definitive answer. In this vein, our 2016 exercise didn’t set a scenario at all, but instead asked the major banks to conduct a “reverse stress test”: to assume a fall in capital to minimum prudential levels, and estimate the scenarios that could have caused these outcomes.
The scenarios generated invariably included a macroeconomic downturn, compounded by a shock amplifier such as a cyber-security attack, mis-selling case or additional ratings downgrades. One bank assumed that it was last to market and couldn’t get an equity raising away, challenging a long-held belief that this cornerstone recovery action will always be available. The exercise was valuable primarily for broadening the stress testing imaginations of the participating banks, and reinforcing the importance of continuing to invest in capabilities.
This year, we will be assessing a range of banks’ stress testing capabilities through a review of internal capital adequacy processes (ICAAPs). Our review will focus on scenario development, internal governance and the use of stress testing to inform decision-making on appropriate capital buffers. In parallel, APRA and the industry will be subject to external examination: the IMF will be conducting a stress test of the Australian banking industry as part of its Financial Sector Assessment Programme (FSAP). We look forward to the results from this exercise, and to understanding what we can learn from their approach. Just as we expect banks to continue to invest in their modelling, data and capabilities, APRA will be reviewing its stress testing framework this year to identify areas for enhancement. We will also be preparing for the next industry stress test in our cycle, another opportunity to test resilience, explore vulnerabilities and challenge assumptions.
An excellent piece from LF Economics, which chimes with DFA data too by the way (more on that later). APRA’s “stress tests” are merely window dressing.
So yesterday APRA came out and said that if unemployment rose to 11%, House prices fell by 35%, and the Chinese economy tanked, that the Australian banking system would be able to withstand the economic stresses associated with this type of economic destruction.
So let’s use a bit of history as a guidance and put it to the test using the most abnormal of leniencies to assess whether APRA is full of cow-pat.
What history tells us from housing crashes in the past in other jurisdictions is that when house prices crash by 35% that the riskiest borrowers (those with the highest outstanding loans to income ratio’s and/or the lowest buffers) are totally wiped out alongside those who lose their jobs long enough to run out of savings and default on their mortgage.
As an example, those borrowers in the US just prior to the GFC who had a total liabilities to income ratio higher than 6x income were at a very high risk of default (and many did) when the GFC arrived. Those with a debt to income ratio of 8x or higher were all but guaranteed to go into foreclosure and lose everything they had.
Furthermore, it was all but guaranteed that those who were living beyond their means on the slimmest of income buffers (income – debt repayments- cost of livings) would too be foreclosed upon as the cost of risk rose.
Before even going there and factoring in job losses, the above two cohorts (the highly leveraged and those living beyond their means) alone represented a dangerous fringe of borrowers in the US that cost its economy, and its banking system very dearly when house prices fell.
The Oz banking stress test.
With limited data available here in Australia on banks mortgage books, it has been incredibly hard to find a sample of a banks mortgage book over the years to be able to conduct a stress test of some sort. But several weeks back, The Royal Commission released Westpac’s mortgage book sample that was used in APRA’s highly secretive ‘Targeted Reviews’. These reviews were never meant to see the light of day. But with good fortune, the Royal Commission ascertained these reviews and released Westpac’s, including the mortgage book sample. This mortgage book sample consisted of 420 loans issued over the 2015/16 period.
If this mortgage book sample has any resemblance to the greater mortgage market in general then it would be fair to say that stress testing this sample in a way that gives more benefit of the doubt than we should be giving…should be able to give insight whether a bank like Westpac….indeed the banking system in general would be able to survive in real life the elements that APRA used to conduct its stress test.
Now before we get to the figures I think it’s important to note that in relation to the data in the mortgage book sample, we assume that the data is correct. Yes correct! So correct, that for the sake of this stress test on this mortgage book sample we assume that the borrowers actually earn as much in income as the data suggests they do. Furthermore, we assume that the borrowers monthly costs of living data is accurate…despite some of this data pretty much implying that a fair cohort of borrowers will neither purchase a car, go on a nice holiday or buy any family members Christmas presents over the life of the loan.
We also assume that the total and existing liabilities of borrowers were not modified (reduced) to make borrowers appear more creditworthy than what they really are.
For the purpose of this stress test, and with history telling us that borrowers with the highest leverage ratios and lowest buffers are those who get wiped out, we snippet out the absolute fringes from the mortgage book sample to illustrate the collateral damage that coincides with an all-out economic catastrophe as APRA used in its stress test.
And just to give more than any reasonable absolute benefit of the doubt; instead of calculating credit write-offs of borrowers leveraged 8x or more, we assume that only borrowers who are leveraged 11x or more when the loan was issued are wiped out. Furthermore, we assume that borrowers whom only have a monthly uncommitted income of $70 or less also go into receivership. The findings do not double dip if a borrower has both 11x leverage to income and a uncommitted monthly income of $70 or less. We also assume that borrowers outside of the scope of the selected fringe thresholds ‘do not’ lose their jobs, or for any other reason default on their liabilities.
The findings.
- Westpac mortgage book sample value – $397,364,308.15
- Number of borrowers in mortgage book sample – 420
- Number of borrowers who fail in the stress test according to our assumptions – 44
- Sum of debt held by borrowers with total liabilities 11x income or greater – $41,180,593
- Sum of debt held by borrowers with an uncommitted monthly income of $70 or less, but leveraged less than 11x – $14,345,483.91
- Percentage of borrowers who fail the stress test – 10.48%
- Proportion of mortgage book sample value that fails stress test – 13.97%
- Losses to the banking system if scaled: $298 Billion
Conclusion
Despite giving more than the benefit of the doubt on highly questionable data, if Westpac’s mortgage book sample has any broader resemblance or correlation with the broader profile of the Australian household debt market, there is simply no way Australian banks would ever survive APRA’s implied elements used in its stress test once you factor in the further losses outside retail banking in real life….. In other words, there would simply be too much distressed debt, not even the funds from the Committed Liquidity Facility will have enough to cut the mustard to cover the shortfalls. And this is just based on the assumption that fringe borrowers leveraged 11x income or greater, and/or have less than $70 a month buffer wont repay will default in an economic disaster.
In ending, the results of APRA’s stress test further provide evidence that they are a captured regulator..
Reproduced with permission.
We view the latest data on home lending and APRA’s latest speech.
Today the ABS published their housing lending statistics for May 2018, and APRA Chair Wayne Byers spoke on the resilience in the financial sector. Interesting timing.
 APRA pretty much says they called it just right, and their tightening has not really impacted overall growth, and any further tightening will be marginal.
First, the changes in lending practices to date do not seem to have had an obvious impact on housing credit flows in aggregate. Total housing lending grew at around 6 per cent in the year to May 2018, which is only marginally below long-run averages and roughly in line with the average run rate since 2011 (covering the period since house prices last went through a period of softening in Australia). Indeed, cumulative credit growth in the roughly three and a half years since APRA stepped up the intensity of its actions was greater than cumulative credit growth in the preceding three and a half years. Credit growth appears to be slowing somewhat at the moment, but that is not surprising in an environment of softening house prices and rising interest rates.
Second, it is evident that the composition of housing credit has shifted notably. Lending to investors is certainly now growing more slowly compared to three or four years ago. But despite the tightening in lending standards – which, it’s important to remember, also apply to owner-occupiers – lending to owner-occupiers grew at a very healthy 8 per cent over the past year. This relatively high rate of rate of growth for owner-occupiers (running broadly at almost 3x household income growth) has been sustained during a period in which lending policies and practices have been gradually strengthened.
Despite the prominence it has been given, our goal in seeking to reinforce standards and practices has been relatively modest: ensuring that internal policies are followed in practice, and applying what is, in most cases, a healthy dose of common sense. This has been an orderly adjustment, and we expect it to continue over time. While there is more “good housekeeping” to do, the heavy lifting on lending standards has largely been done. Any tightening from here on is expected to be at the margin as banks seek to get a better handle on borrower expenses, and better visibility of borrower debt commitments.
The ABS data shows that total lending stock grew again in May. This is original data split between owner occupied and investment loans.
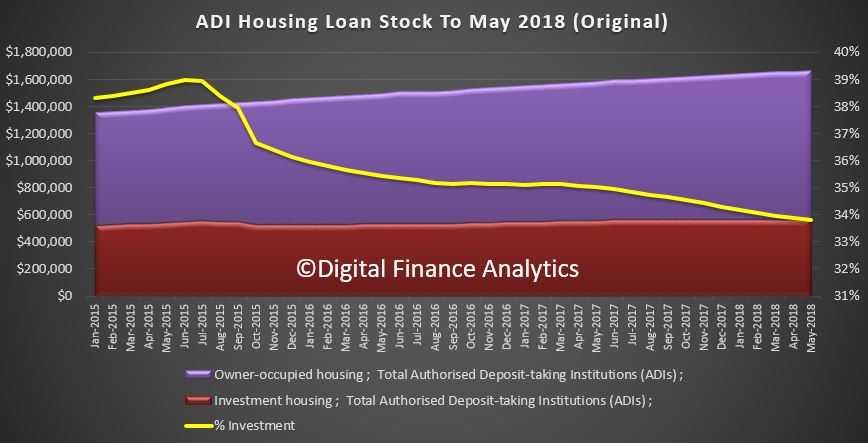 Total housing loan stock rose 0.5% in the month to $1.66 trillion. Within that owner occupied lending rose 0.5% to $1.1 trillion and and investment lending rose just 0.1% to $563 billion. Investment loans fell to be 33.8% of all loans. Overall growth is circa 6% annualised. As for whether growth at 3 times income is “healthy” to quote Wayne Byers; well that’s another story. Remember debt has to be repaid, eventually.
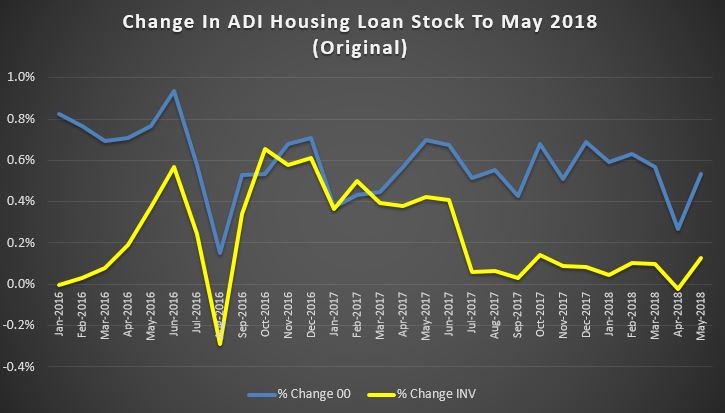
Growth has been strongest in owner occupied lending, but investment lending was also higher.
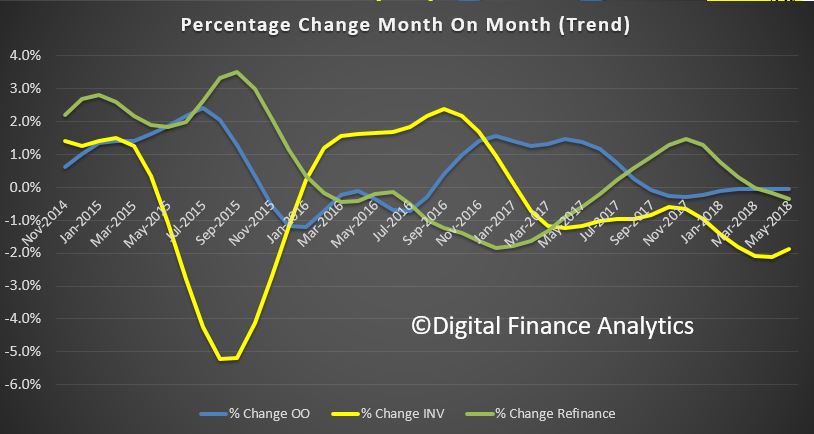
 The trend housing flows were down month on month with a fall of 0.1% in owner occupied lending to $14.7 billion and investment lending down 1.9% to $10.7 billion. There was$6.3 billion of refinancing, a drop of 0.4%. 42% of lending was for investment purposes (excluding refinancing) and 19.9% of lending was refinancing, this proportion rose a little.
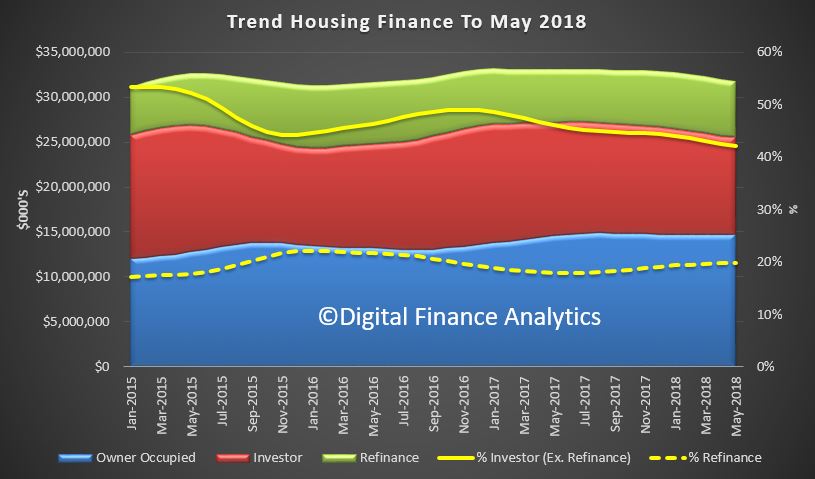 Looking in more detail at the trend movements by category, only owner occupied purchase of established dwellings rose, all other categories fell back. Investor lending continued to slide on a relative basis.
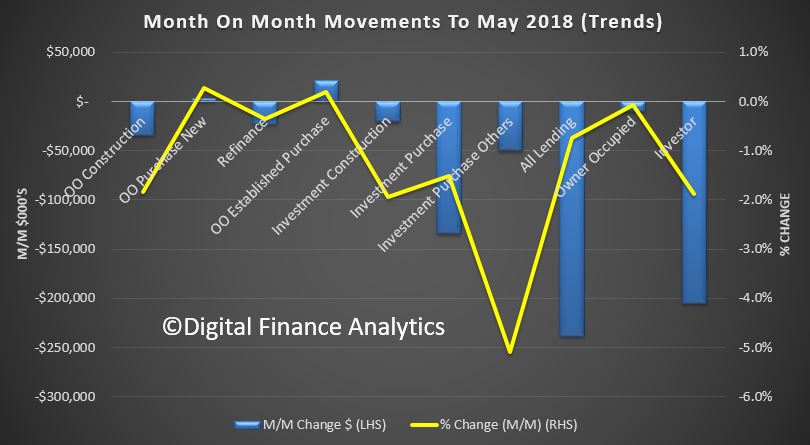 The month on month changes show the movements, and we note a slower rate of decline in investor lending.
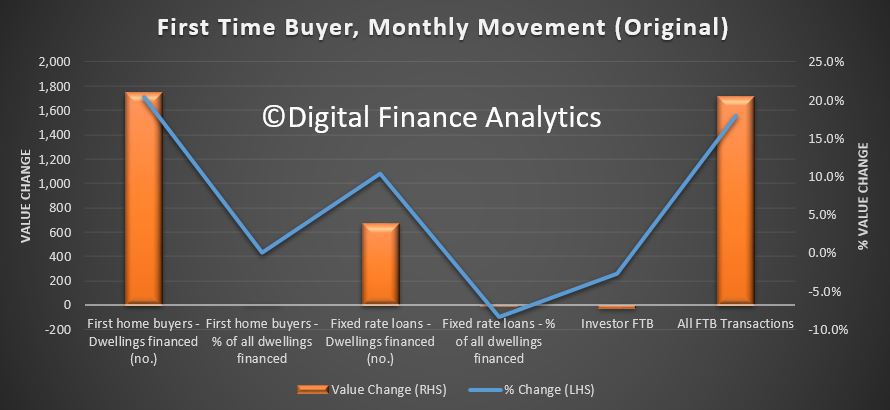
 First time buyers continue to support the market, with a 17.6% share of all loans written but a significant rise in the absolute number of first time loans written (up 20.5% on last months) as well as a rise in non first time buyer borrowers. These are original numbers, so they do move around from month to month, and does reflect the incentives for first time buyers in some states.
![]() The number of investor first time buyers continues to fall.
The number of investor first time buyers continues to fall.
![]() The month on month movements show the additional 1,750 buyers in the month. Worth noting also that the average loan size continues to grow, at $412,000 for non-first time buyers, up 0.4% on the previous month and $344,000 for a first time buyer, up 0.5%. There are some variations across the states, but I won’t include those here. There was also a further fall in the number of fixed rate loans being written, down to 12.1% from 13.2% last month.
The month on month movements show the additional 1,750 buyers in the month. Worth noting also that the average loan size continues to grow, at $412,000 for non-first time buyers, up 0.4% on the previous month and $344,000 for a first time buyer, up 0.5%. There are some variations across the states, but I won’t include those here. There was also a further fall in the number of fixed rate loans being written, down to 12.1% from 13.2% last month.
 To me this begs the question, if credit is still running at these levels, and APRA says the tightening is all but done, will we see home prices starting to trend higher? Clearly the plan is to keep the debt bomb ticking for yet longer.
But this may well mean the RBA will lift rates sooner than I expected.
APRA has released a discussion paper on making changes to the related parties framework for ADI’s. As APRA says an ADI’s associations with related entities can expose the ADI to substantial risks, including through financial and reputational contagion. Complex group structures may also adversely impact on the ability of an ADI to be resolved in a sound and timely manner. The consultation period open until 28 September 2018 and changes would come into force in 2020.
The existing requirements established by the Australian Prudential Regulation Authority (APRA) for authorised deposit-taking institutions (ADIs) governing associations with related entities are a long-standing and important component of the prudential framework for ADIs. The requirements have not been materially updated since 2003.
Since then, international developments have emphasised that deficiencies in prudent controls can expose an ADI to substantial risks in relation to its related entities. For example, during the global financial crisis, reputational pressures meant that overseas banks were inclined to support, often beyond their legal obligations, certain funds management vehicles that suffered significant falls in value or impaired liquidity. In effect, these banks were exposed to substantial credit and liquidity risks through their associations.
APRA is proposing to update its existing related entities framework to account for lessons learned from the global financial crisis on mitigating the flow of contagion risk to an ADI, particularly from related entities, and incorporate changes to the revised large exposures framework, published in December 2017. This update includes revisions to the:
- definition of related entities to capture all entities (including individuals) that may expose the ADI to contagion and step-in risk. This is expected to impact all ADIs;
- measurement of exposures to related entities by aligning with requirements in the revised large exposures framework. This is expected to impact all ADIs;
- prudential limits on exposures to related entities. APRA is proposing to adjust the size of the limits and align the capital base used in limit calculations with the more appropriate Tier 1 base now used in the revised large exposures framework. The proposal is expected to primarily impact ADIs that have a small capital base;
- extended licensed entity (ELE) framework by amending the criteria for a subsidiary to be consolidated in an ADI’s ELE. This is expected to impact those ADIs that utilise the ELE framework and particularly those that have offshore ELE subsidiaries, which hold or invest in assets; and
- reporting requirements to capture more prudential information on substantial shareholders and subsidiaries that are treated as part of an ADI’s ELE. This is expected to impact more complex ADIs.
The impact of the proposed changes on each ADI will depend on, among other factors, the number and size of entities captured by the proposed definition of related entities; the size of exposures to related entities relative to an ADI’s capital base; the extent to which an ADI undertakes business through subsidiaries; and differences in how an ADI currently measures to related entities compared with the proposed methodology.
APRA is cognisant of the impact these reforms may have on ADIs and is particularly interested in receiving feedback on whether the proposed reforms best meet APRA’s mandate to improve financial safety and financial system stability without material adverse impacts on efficiency or competition. ADIs are encouraged to provide alternative proposals where it is considered that an alternative will better meet the prudential objectives.
APRA is seeking feedback on the proposed amendments with the consultation period open until 28 September 2018. Given the potentially material nature of the proposals, APRA anticipates that a finalised framework would come into force on 1 January 2020, with transition potentially offered to ADIs that are most impacted by the reforms.
The prudential regulator has issued a warning to super funds about offering cash options with underlying investments that are not ‘cash-like’ in nature; via InvestorDaily.
In a letter to registrable superannuation entity licensees, APRA deputy chairman Helen Rowell said the prudential regulator had conducted a review that revealed instances where “‘cash’ investment options appear to include exposure to underlying investments that would not generally be considered cash or cash-like in nature”.
According to APRA’s review, it had found that some underlying investments of some cash options included asset-backed and mortgage-backed securities, commercial bonds and hybrid debt instruments, credit-default swaps, loans and other credit instruments.
“These assets do not typically exhibit the characteristics necessary to be considered as cash or cash equivalent,” Ms Rowell said in the letter.
“There were also exposures noted to cash enhanced vehicles without sufficient policy guidance as to the permitted holdings of these vehicles.”
Ms Rowell reminded super funds of their obligations under SPS 530 Investment Governance which states that an RSE licensee must be satisfied it has “sufficient understanding and knowledge of the investment selected, including any factors that could have material impact on achieving investment objectives of the investment option… and the investment is appropriate for the investment option”.
APRA has followed up with a number of super funds identified in the review and will continue to monitor super funds’ cash investment options, Ms Rowell said.
She added that the prudential regulator expected RSE licensees to “consider the content of the letter” and reassess their ‘cash’ investment options that had exposure to non-cash assets where necessary.
The letter comes a month after Ms Rowell appeared before the Economics Legislation Committee where she said “some cash options seem to be returning much higher than we would expect from what you might call a pure cash option and there are others that are returning much less”.
“Our initial work seems to suggest that part of it goes to the types of instruments, if you like, which are in those. They are not just term deposits; they may be enhanced cash, RMBSs or other types of securities that are cash-like but not cash.
“And in other cases it does come down to the level of expenses that are being charged for the management of those cash options. Those are all issues that we are pursuing with the relevant funds where [we] have identified them as being outliers in that regard.”
She also admitted that the superannuation regulatory framework had “room to strengthen” with regards to placing tougher requirements on the ways super funds assessed member outcomes and what they were delivering, as well as the reporting and disclosure that would allow APRA to address these issues more quickly.
We look at the latest RBA and APRA stats
