Non Bank Lending Up, Overall Growth Lower, But Another Record Hit

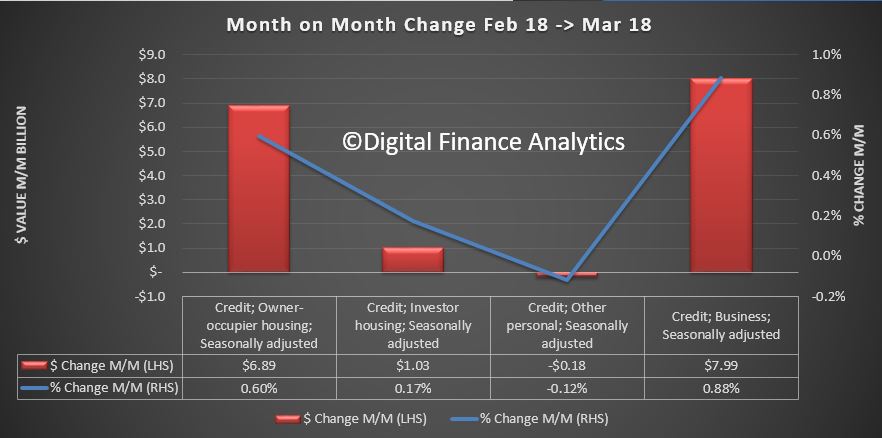
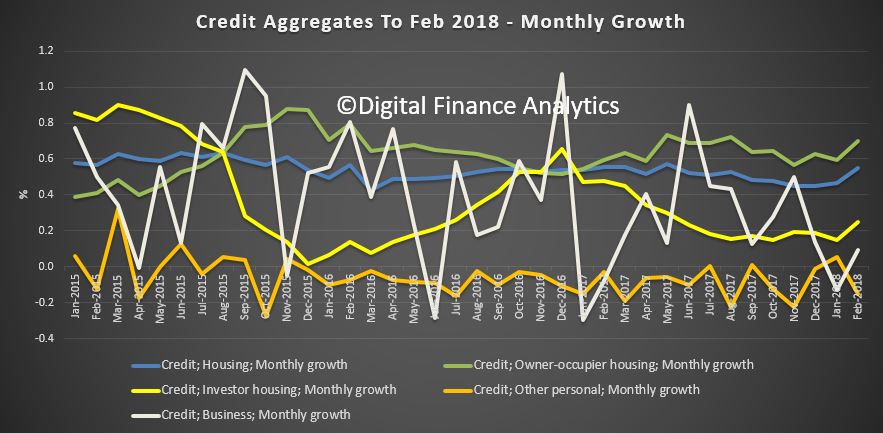
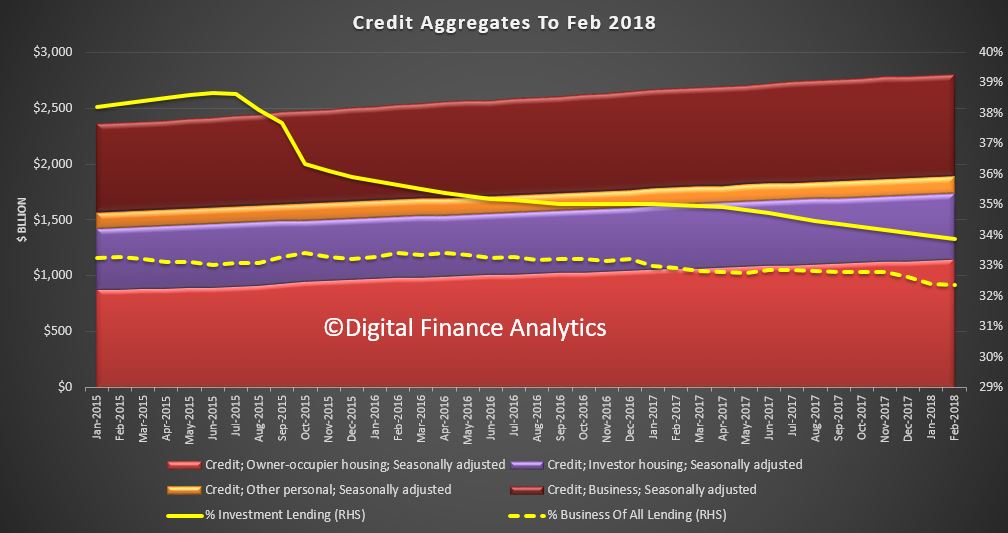
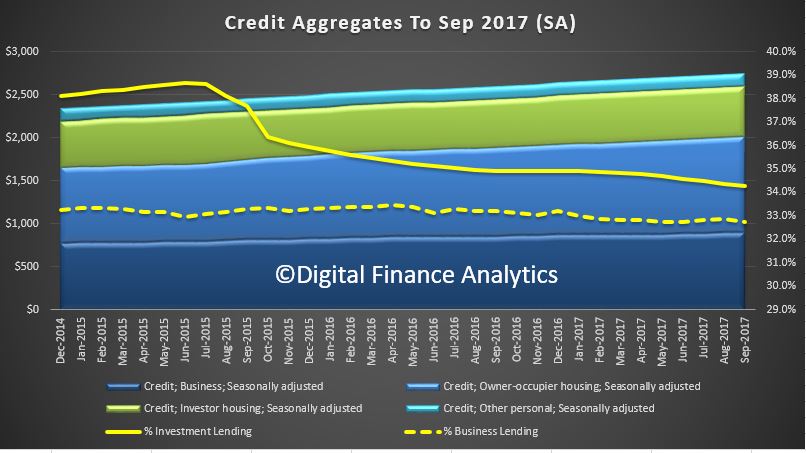
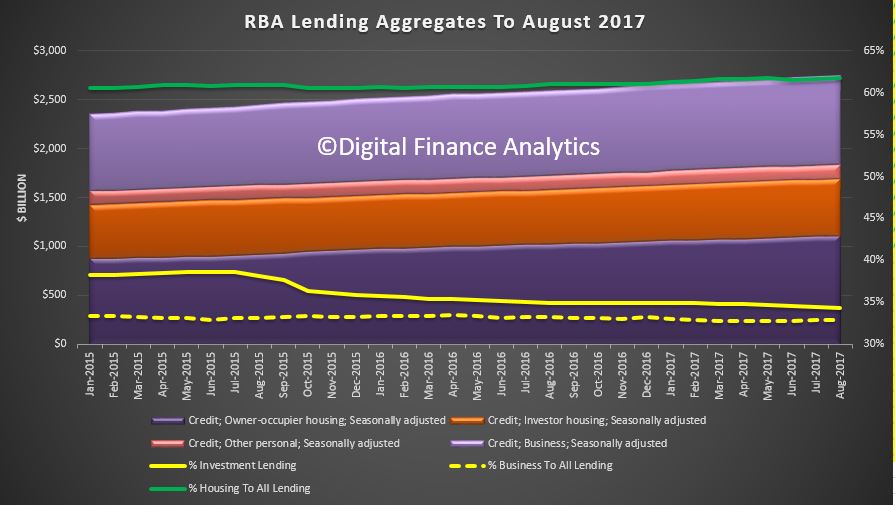
The RBA has released their credit aggregates to April 2018. Total mortgage lending rose $7.2 billion to $1.76 trillion, another record. Within that, owner occupied loans rose $6.4 billion up 0.55%, and investment loans rose 0.14% up $800 million.  Personal credit fell 0.3%, down $500 million and business lending rose $6.3 billion, up 0.69%.

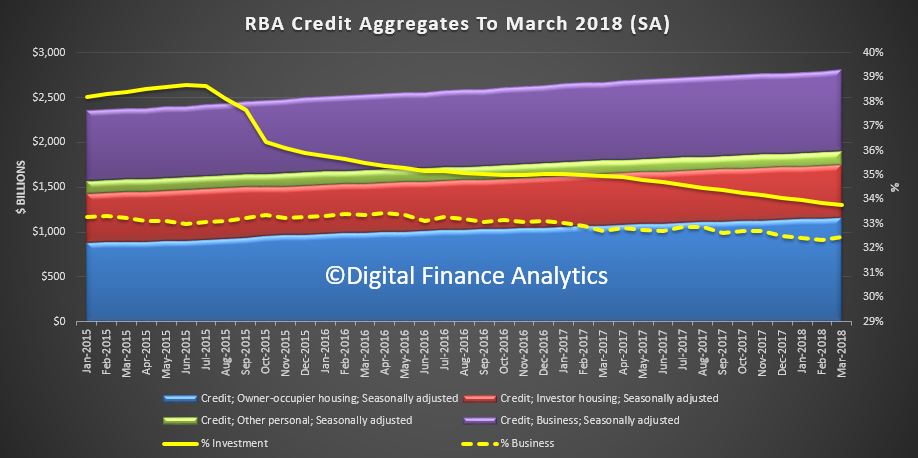
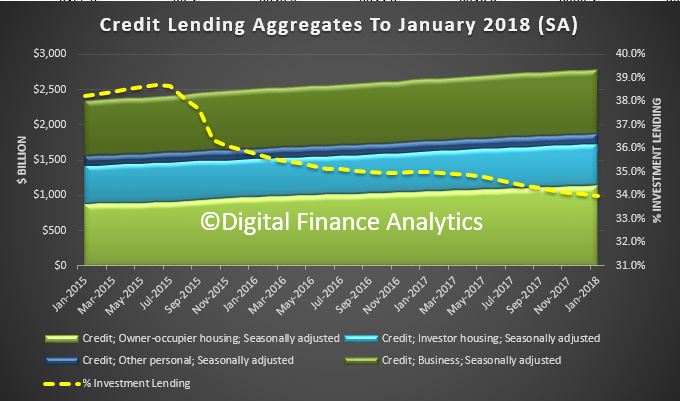
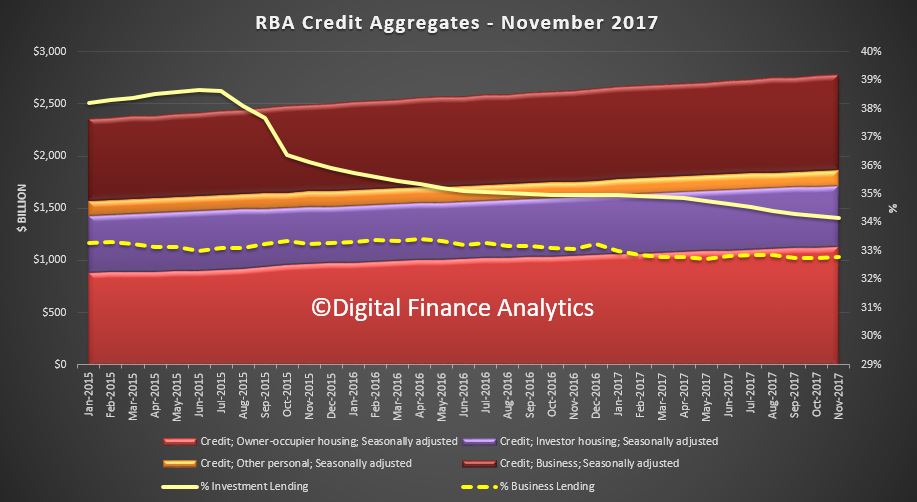
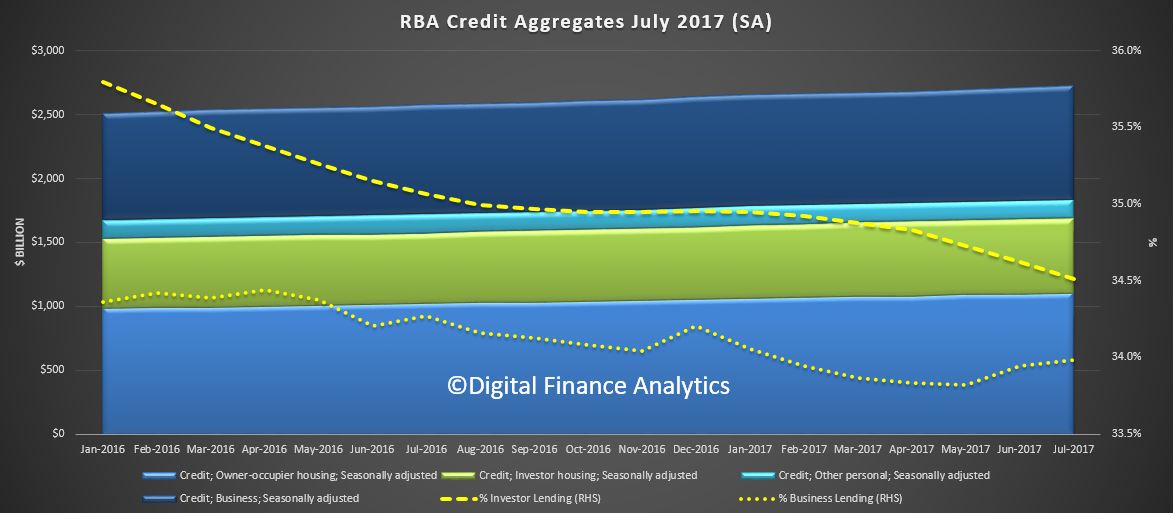
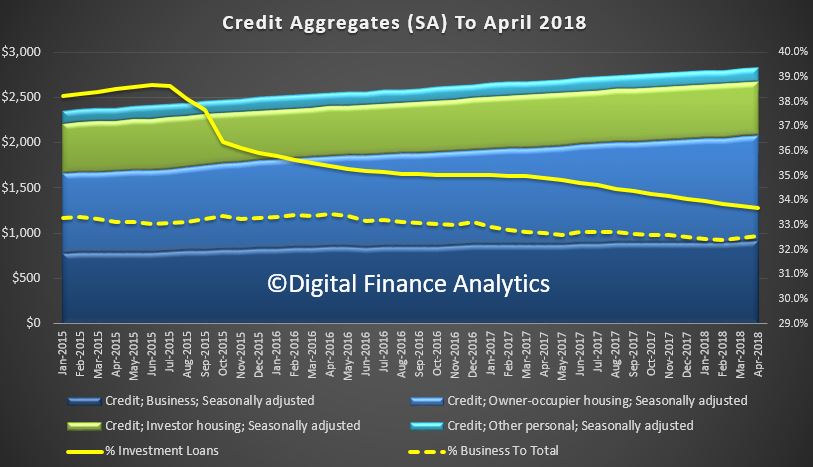
Business lending was 32.5% of all lending, the same as last month, and investment mortgage lending was 33.7%, slightly down on last month, as lending restrictions tighten.

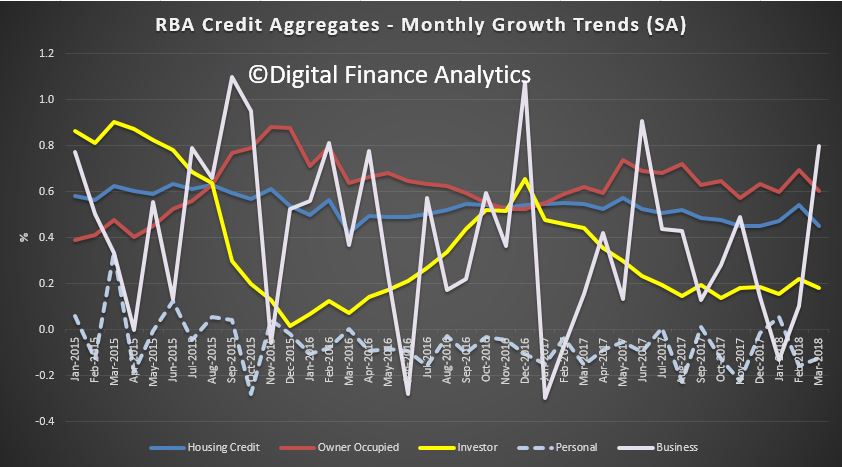
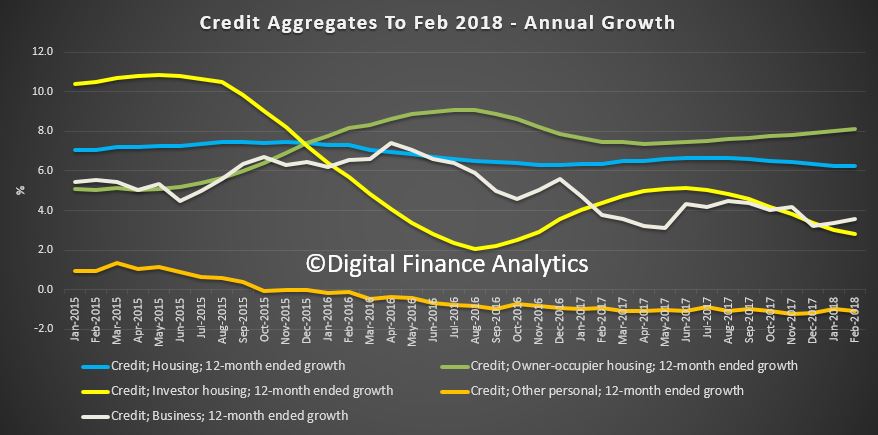
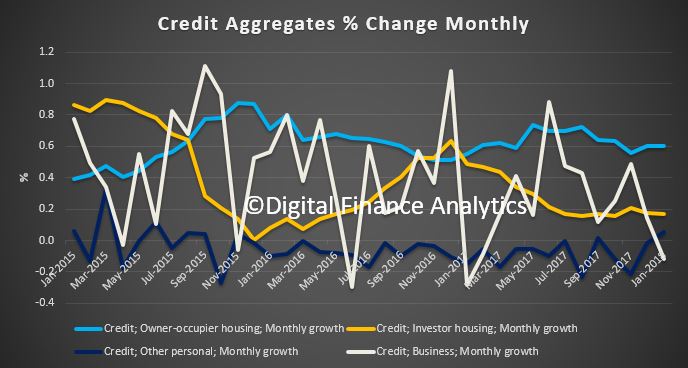
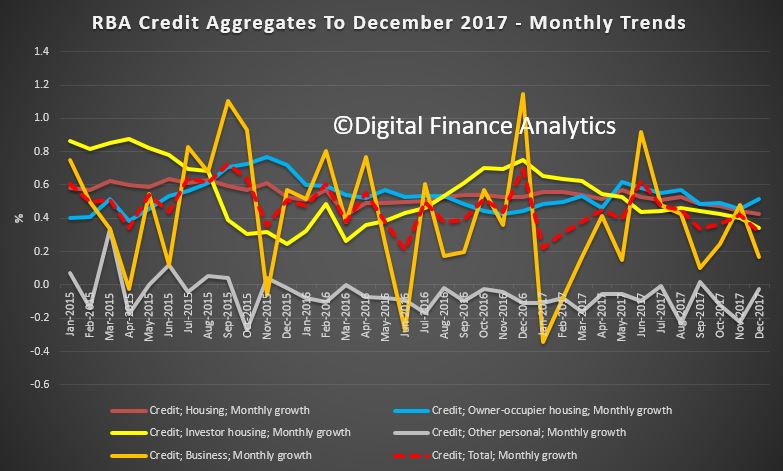
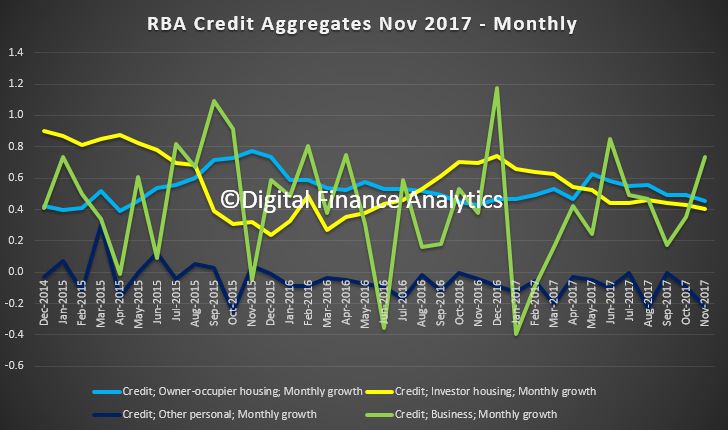
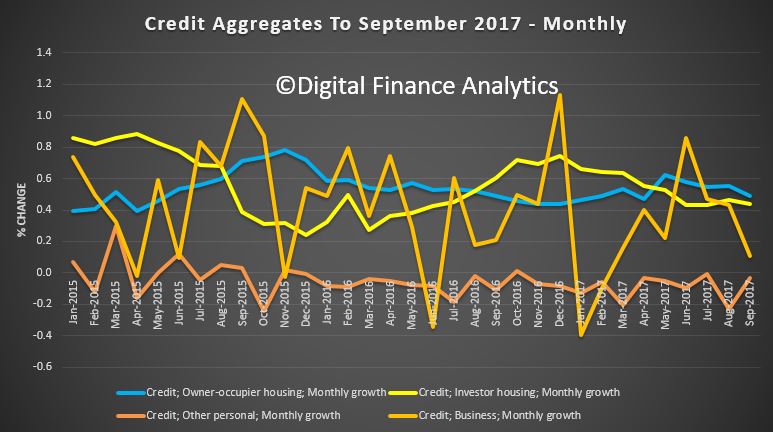
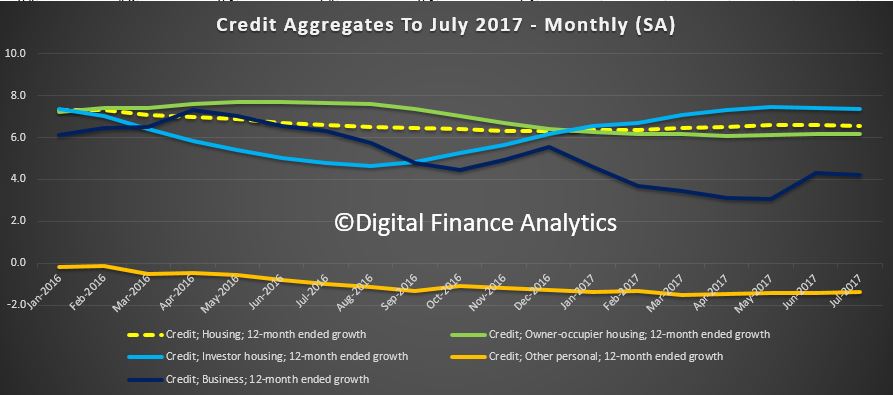
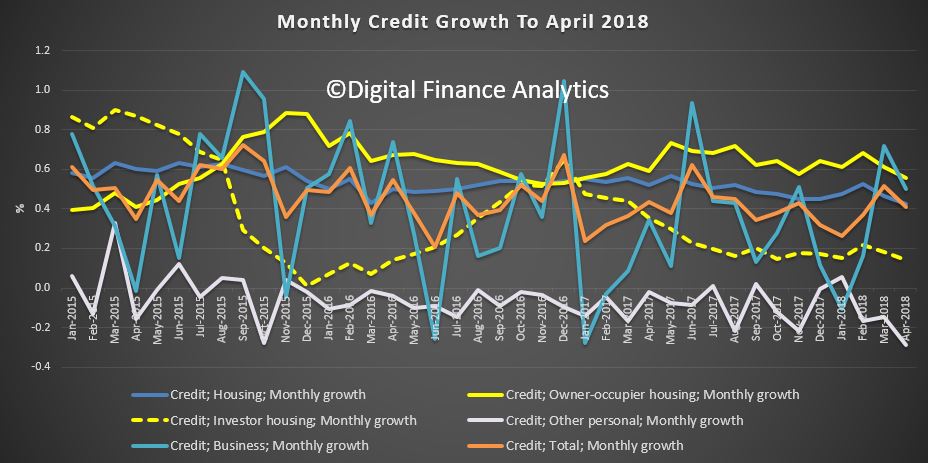
The monthly trends are noisy as normal, although the fall in investor property loans is visible and owner occupied lending is easing.

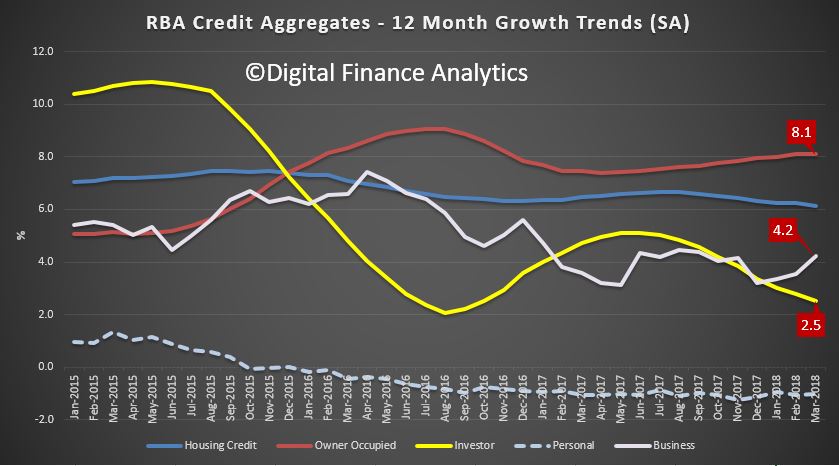
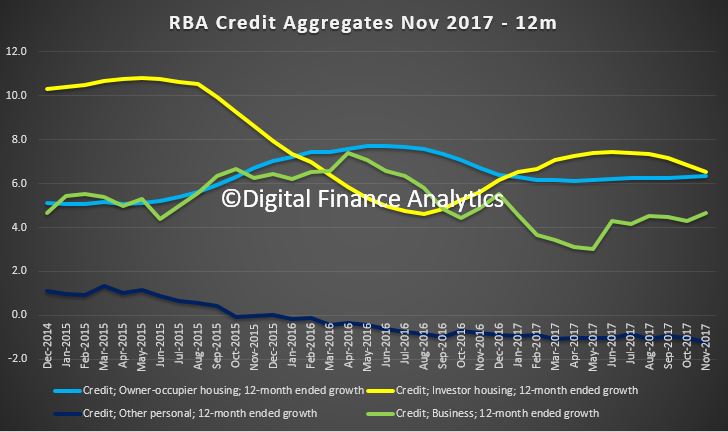
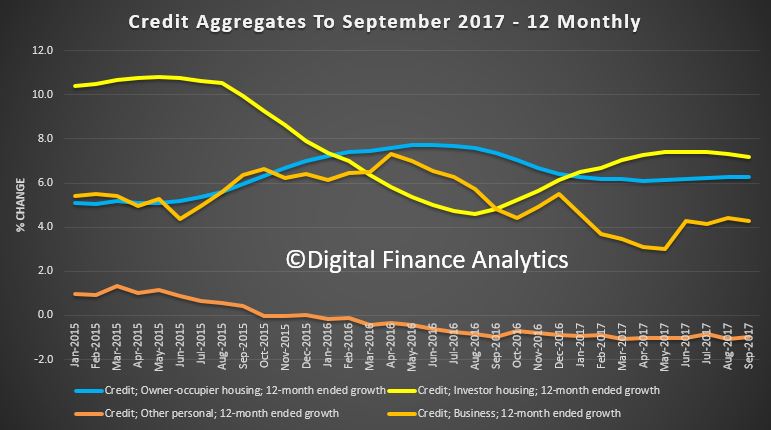
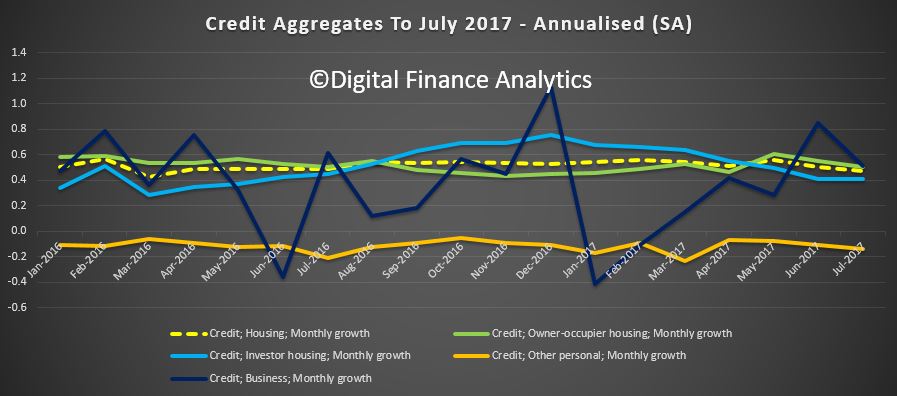
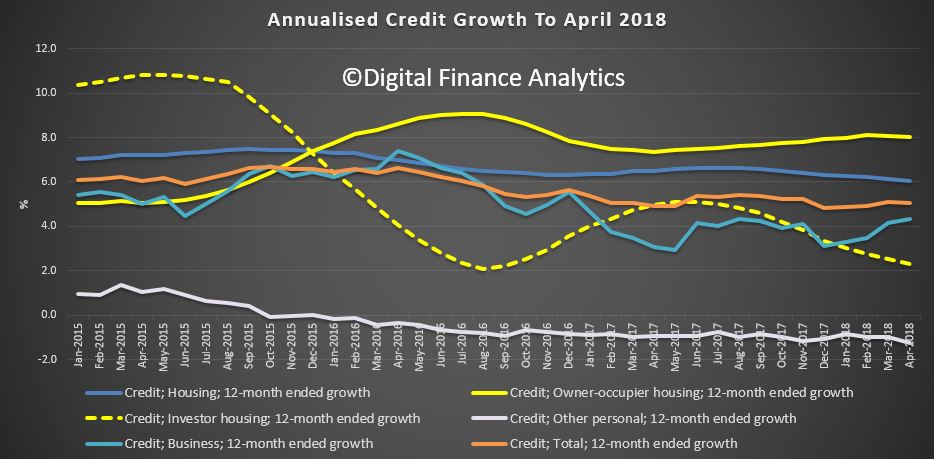
But the annualised stats show owner occupied lending still running at 8%, while business lending is around 4% annualised, investment lending down to 2.3% and personal credit down 0.3%.  On this basis, household debt is still rising.

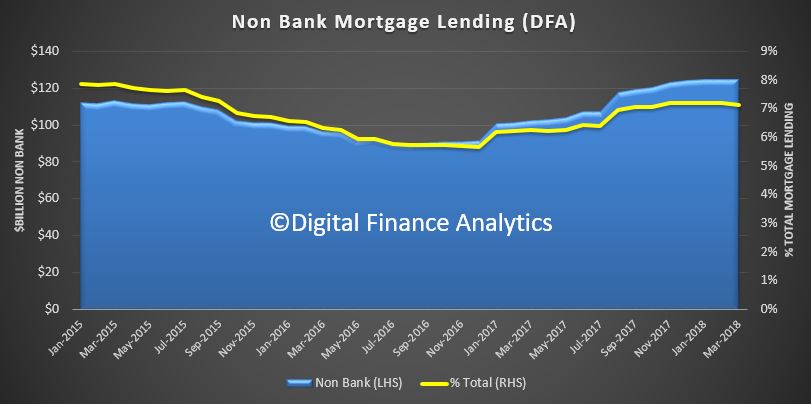
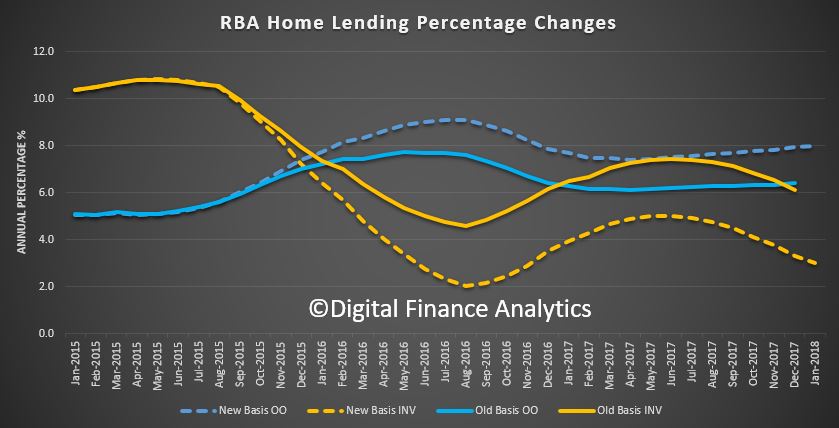
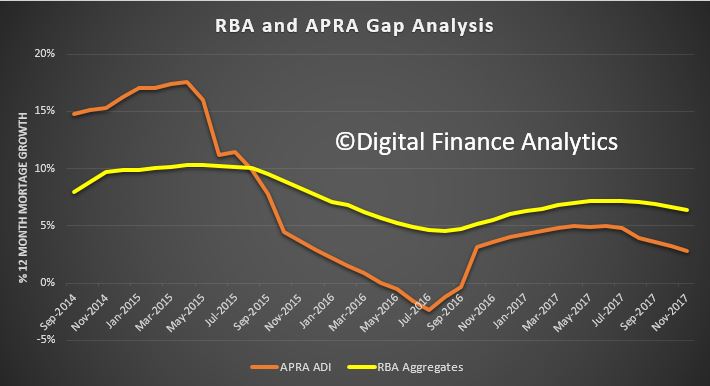
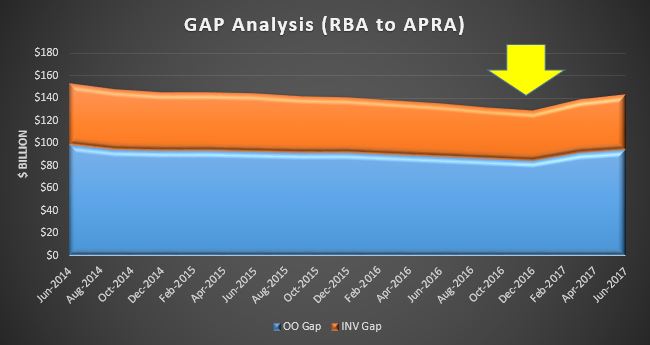
One interesting piece of analysis we completed  is the comparison between the RBA data which is of the whole of the market and the  APRA data which is bank lending only.

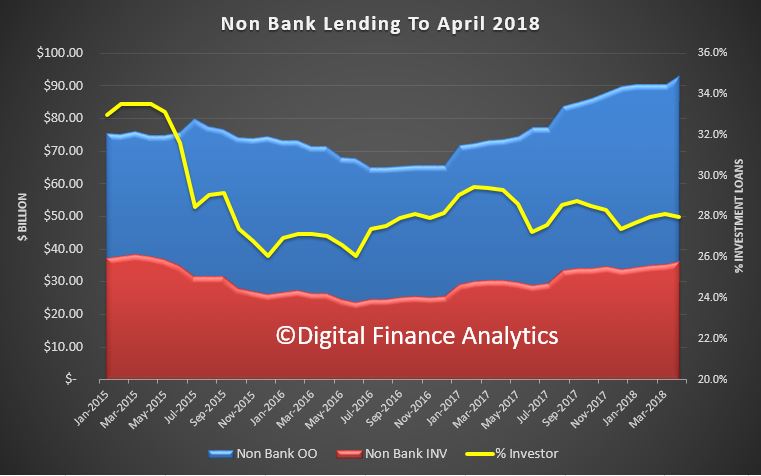
Now this is tricky, as the non-bank data is up to three months behind, and only covers about 70% of the market, but we can get an indication of the relative momentum between the banks and non banks.

We see that non-bank lending has indeed been growing, since late 2016. The proportion of loans for property investors is around 28%, lower than from the banks.  Back in 2015, the non-bank investor split was around 34%.

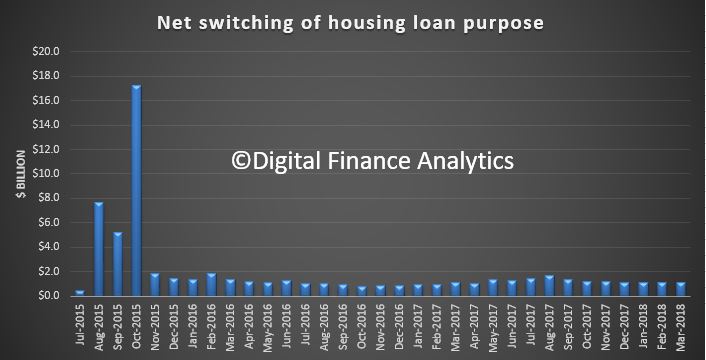
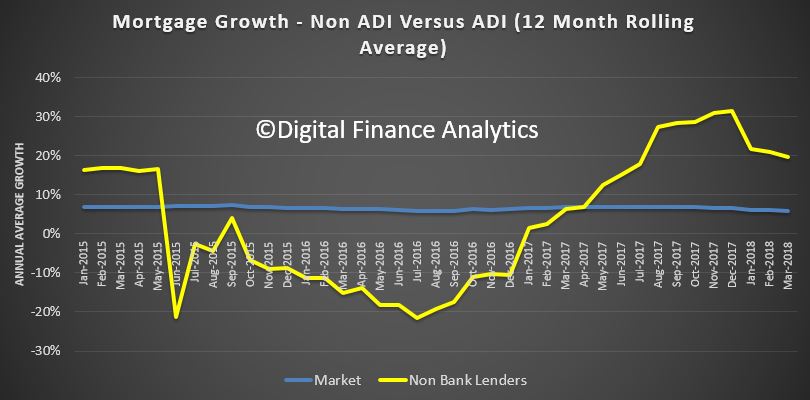
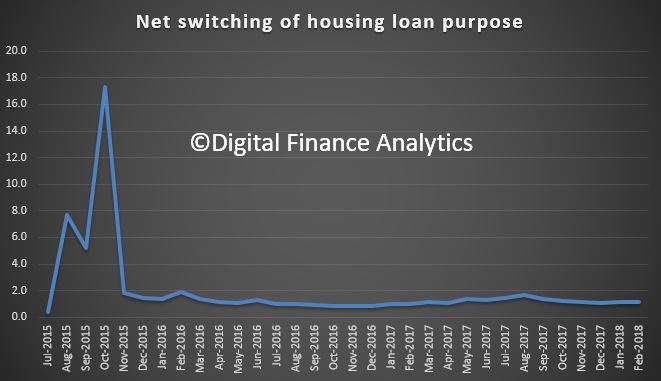
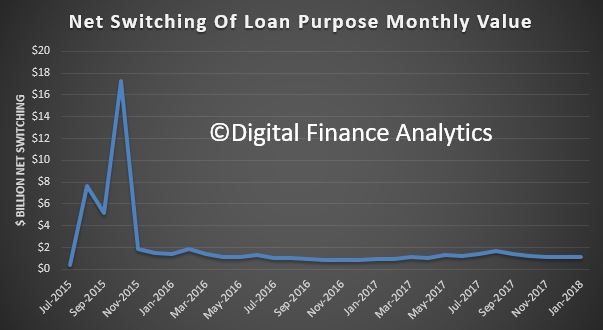
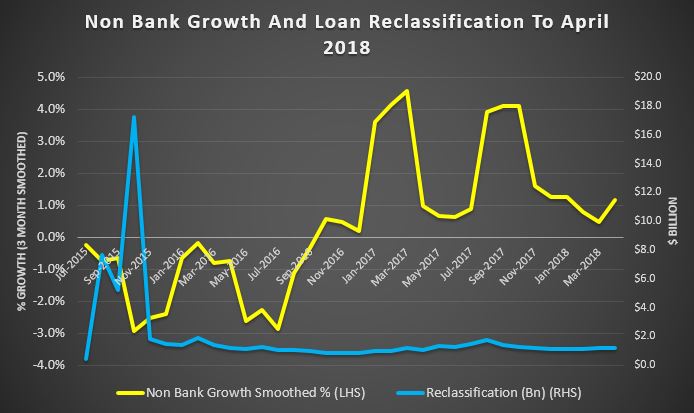
The percentage growth from the non-bank sector appears stronger than the banks. Across all portfolios, loan reclassification is still running at a little over $1 billion each month.

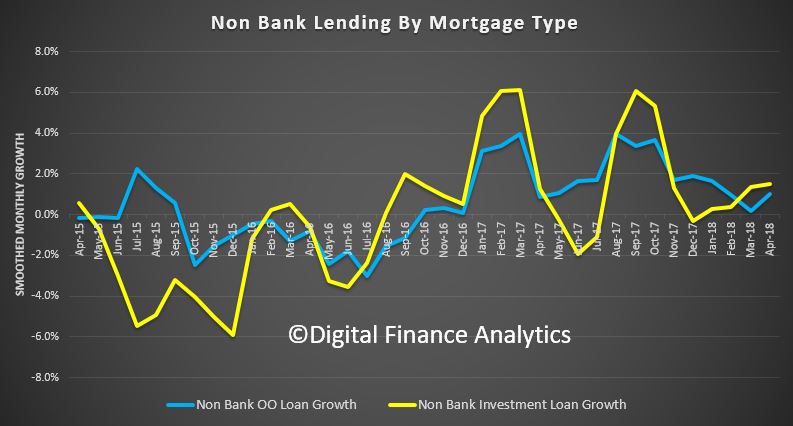
Finally if we look at the relative growth of owner occupied and investment loans in the non-bank sector we see stronger investment lending in the past couple of months.  Bank investment property lending actually fell on April according to APRA stats.

As expected, as banks throttle back their lending, the non-banks are filling some of the void – but of course the supervision of the non-banks is a work in progress, with APRA superficially responsible but perhaps not actively so.

We would expect better and more current non-bank reporting at the very least APRA, take note!


Non Bank Mortgage Lending Accelerates

The RBA have released their credit aggregates to March 2018.  Looking at the month on month movements, total owner occupied lending rose 0.6%, or $6.89 billion to $1,157.8 billion and investor mortgage lending rose 0.17% or $1.03 billion to $590.2 billion.  So overall mortgage lending rose 0.46% in the month, up $7.92 billion (all seasonally adjusted) to $1.75 trillion. A record.

Personal credit fell 0.12%, down $0.18 to $152 billion. Business credit rose 0.88%, or $7.99 billion to  $913 billion.

The trends show that the share of investment loans fell a little on the total portfolio to 33.8%, while business lending was 32.5% of all lending, up just a little.

The 12 month average growth rates show that owner occupied loans rose 8.1%, while investment loans grew 2.5%. Business rose 4.2%, and personal credit fell again. Overall growth rates of credit for housing slide just a little to 6.1%. This is 3 times the rate of inflation and wage growth! Household debt therefore is still rising.

The noisy monthly data highlights how volatile the business lending trends are.

They also reported that the switching between investor and owner occupied loans continues to run at similar levels, after the hiatus in 2015.

Now, we can also make comparisons between the total loan pool, and those loans written by the banks (ADS’s) by combining the APRA bank data and the RBA data. There are a few catches, and the ABS suggests that not all the non-banks are captured.

But set that aside, we have plotted the relative value of the mortgage pools at the total level, and the ADI level (not seasonally adjusted). The trend shows around 7% of lending is non-bank, up from 5.7% in 2017.  In value terms this equates to  $124 billion, up from $90 billion in 2016.

Another way to show the data is to look at the rolling 12 month growth trend. This shows that non-bank lending has been growing at up to 30% and significantly higher than the market at 5.94%.

This is highly relevant given Bluestone’s recent announcement and Peppers recent $1 billion securitisation issue.

So this is all playing out as expected. As the majors throttle back on new mortgage lending under tighter controls, the non-bank sector continues to pick up the slack. This is a concern as the regulatory environment for these lenders is weaker, with both ASIC and APRA now involved, ASIC from a responsible lending perspective and APRA from new supervision on the non-bank sector, despite their failure in the core banking sector. So we expect to see significant non-bank lending growth, ahead, which will stoke the current massively high household debts even higher.

The total loan mortgage growth is still significantly higher than income growth. This is not sustainable, and will lift mortgage stress higher again – our new data will be out in a few days.

Business Credit Growth Stalls

The latest Credit Aggregates from the RBA for February 2018  shows continued growth in mortgage lending, and only small rises in business credit and other consume credit. The monthly growth stats are noisy, but  owner occupied lending growth is higher, and this continues to drive overall credit growth higher than business lending.

The smoothed 12 month view shows the trends more clearly, with annualised owner occupied growth registering 8.1%, up from last month, investor lending falling again down to 2.8% annualised, and business credit at 3.6%

Looking at the relative value of lending, in seasonally adjusted terms, owner occupied credit rose 0.71% to $1.15 trillion, up $8.08 billion, while investment lending rose 0.12% to $588.3 billion, up just 0.69 billion. Business lending rose 0.17% to $905 billion, up 1.55 billion and personal credit fell 0.15%, down 0.22 billion to $152.2 billion.

Note that the proportion of investment loans fell again down to 33.9%, and the proportion of business lending to all lending remained at 32.4%, and continues to fall from last year. In other words, it is owner occupied housing which is driving credit growth higher – if this reverses, there is a real risk total credit grow will run into reverse. Again, we see the regulators wishing to continue to drive credit higher, to support growth and GDP, yet also piling on more risks, when households are already terribly exposed. They keep hoping business investment and growth will kick in, but their forward projections look “courageous”. Remember it was housing consumption and Government spending on infrastructure which supported the last GDP numbers, not business investment.

One final note, the loan switching between investor and owner occupied loans are around $1 billion each month. This of course has now been backed out of the RBA numbers.

Now, lets compare the total housing lending from the RBA of  $1.740 trillion, which includes the non-banks (though delayed, and partial data), with the APRA $1.61 trillion. The gap, ¬$130 billion shows the non bank sector is growing, as historically, the gap has been closer to $110 billion. This confirms the non-bank sector is active, filling the gap left by banks tightening. Non-banks have weaker controls on their lending, despite the new APRA supervision responsibilities. This is an emerging area of additional risk, as some non-banks are ready and willing to write interest only and non-conforming loans, supported by both new patterns of securitisation (up 13% in recent times) and substantial investment funds from a range of local and international investors and hedge funds.

Once again, we see the regulators late to the party.  This continues the US 2005-6 playbook where non-conforming loans also rose prior to the crash. We are no different.

More On The RBA Tweaks – Messy Or What!

I did a mapping between the old and new basis for investor and interest only loans in the RBA credit aggregates. I posted the data earlier.

Since mid-2015 the bank has been writing back perceived loan reclassifications which pushed the investor loans higher and the owner occupied loans lower.

They have now reversed this policy, so the flow of investment loans is lower (and more in line with the data from APRA on bank portfolios). Investor loans are suddenly 2% lower. Magically!

This is the monthly switching:

But two points.

First I am amazed the  banks feels its OK to suddenly change the basis of their calculations, when its such a critical issue. The provided reasoning is perverse – loan switching is “normal”. Suddenly back tracking over the past two years is plain weird.  The section in the Stability Report said it was going to happen. That is all.

Second, it once again highlights the rubbery nature of the data on lending in Australia. What with data problems in the banks, and at the RBA, we really do not have a good chart and compass.  It just happens to be the biggest threat to financial stability but never mind.

Standing back though, despite the static growth in investment lending, do not forget that overall debt is still rising faster than incomes, by a factor of two to three times.

Owner occupied lending must be tamed too if we are to ever get back to a more even keel – the case for more macro-prudential intervention just got stronger!

RBA Aggregate Lending Data Tweaked To Make Investor Loans Lower

The RBA has published their credit aggregates for January today. Owner occupied lending rose 0.6%, or 8% over the past year to $1.14 trillion. Investment lending rose 0.2% of 3% over the past year to $587 billion. It comprises 34% of all housing lending.  They changed the way they report the data this month. It changes the trend reporting significantly .

Business investment fell 0.1% in the month, or 3.4% over the past year to $908 billion. Personal credit rose 0.1%, but fell 0.9% over the past year to $151.5 billion.

The monthly movements show the clear slowing of the mortgage sector, a slide in business lending and a small rise in personal credit (much of the slack here is being picked up in the Alternative Lending sector which will be subject to a separate post later).

The smoothed annual trends show the slide in investment lending in January.

Compare this with last month’s equivalent data when the RBA was running adjustments between the investor and owner occupied series. They have now stopped, as we discussed recently.  Investment lending therefor dropped from ~5% to ~3% in the past year as a result of their changes. Talk about fluff in the numbers!!

Instead they report on net switching. After a spike in 2015, when the differential pricing started to appear, its been running at around $1 billion each month.

The RBA says:

All growth rates for the financial aggregates are seasonally adjusted, and adjusted for the effects of breaks in the series as recorded in the notes to the tables listed below. Data for the levels of financial aggregates are not adjusted for series breaks. Historical levels and growth rates for the financial aggregates have been revised owing to the resubmission of data by some financial intermediaries, the re-estimation of seasonal factors and the incorporation of securitisation data. The RBA credit aggregates measure credit provided by financial institutions operating domestically. They do not capture cross-border or non-intermediated lending.

Following the introduction of an interest rate differential between housing loans to investors and owner-occupiers in mid-2015, a number of borrowers changed the purpose of their existing loan. Adjustments for these switching flows have been applied to the growth figures over the period from mid to late 2015 when this switching was unusually large, but not thereafter, as the amount of switching each month subsequently decreased and remained relatively stable (and thus appears to reflect regular behaviour that occurs from month to month). All switching flows are reflected in the level of owner-occupier and investor credit outstanding. For more information, including on past treatment of switching flows, please see February 2018 SMP – Box D: Measures of Investor and Owner-Occupier Housing Credit.

Comparing the APRA and RBA data, it appears the non-bank lending sector is still enjoying significant growth.

Lending Trends In December 2017 – Still About Home Loans!

The RBA released their credit aggregate data to end December 2017 today.  $1.1 billion of loans were reclassified in the month (we guess AMP).

They report that lending for housing grew 6.3% for the 12 months to December 2017, the same as the previous year, and the monthly growth was 0.4%.  Business lending was just 0.2% in December and 3.2% for the year, down on the 5.6% the previous year.  Personal credit was flat in December, but down 1.1% over the past year, compared with a fall of 0.9% last year. This is in stark contrast to the Pay Day Loan sector, which is growing fast, as we discussed yesterday (and not in the RBA data).

Total credit grew 0.3% in the month, and 4.8% for the year, so mortgage lending is still supporting overall growth, lifting the record household debt even higher. We need still tighter regulatory controls – especially as the costs of living continue to outstrip wage growth.

The annual trends show that investor lending is slowing a little, but still stands at 6.1% seasonally adjusted. Owner occupied lending is running at 6.4% over the last year.  34.1% of loans are for investment purposes.

The monthly data is very noisy as usual.

The value of owner occupied loans was $1.13 trillion, up $6.3 billion or 0.6%, seasonally adjusted; investment loans were $587 billion up $2 billion or 0.3%, seasonally adjusted; other personal credit $151 billion, down 0.2% or 0.3 billion and business lending was $908 billion, up $0.8 billion or 0.1%.

The data contains various health warnings:

All growth rates for the financial aggregates are seasonally adjusted, and adjusted for the effects of breaks in the series as recorded in the notes to the tables listed below. Data for the levels of financial aggregates are not adjusted for series breaks. Historical levels and growth rates for the financial aggregates have been revised owing to the resubmission of data by some financial intermediaries, the re-estimation of seasonal factors and the incorporation of securitisation data. The RBA credit aggregates measure credit provided by financial institutions operating domestically. They do not capture cross-border or non-intermediated lending.

Following the introduction of an interest rate differential between housing loans to investors and owner-occupiers in mid-2015, a number of borrowers have changed the purpose of their existing loan; the net value of switching of loan purpose from investor to owner-occupier is estimated to have been $62 billion over the period of July 2015 to December 2017, of which $1.1 billion occurred in December 2017. These changes are reflected in the level of owner-occupier and investor credit outstanding. However, growth rates for these series have been adjusted to remove the effect of loan purpose changes.

Mortgage Lending On The Slide, Perhaps

The RBA data for November 2017 was released today.  The financial aggregates shows that mortgage lending momentum is easing a little, but more slowly than bank lending, suggesting that the non-bank sector is taking up much of the slack. In addition, more loans were reclassified in the month, taking the total to an amazing $61 billion. Total mortgages are now at $1.71 trillion, another record. Overall growth is still much higher than wage growth, so household debt levels will continue to climb.

The monthly trends are pretty clear, if noisy.

The 12 month view irons out the noise and shows that investor lending has fallen to an annual rate of 6.5%, compared with owner occupied lending at 6.3%.   Total housing lending grew at 6.4%. Business lending is lower, at 4.7% and personal lending down 1.2%.

Looking at the values involved, total mortgage lending rose to $1.71 trillion, and investor loans fell to 34.1% of balances, still too high.

Two interesting points to make. First, it is clear mortgage momentum is being support by the non-bank sector, as the RBA aggregate data is significantly higher than the ADI growth from APRA. We have plotted the gap between the two on a 12 month rolling basis.

Second, there is still more “tweakage” in the numbers as loans are re-classified.  Total to date now $61 billion, a large proportion of investor loans!

Following the introduction of an interest rate differential between housing loans to investors and owner-occupiers in mid-2015, a number of borrowers have changed the purpose of their existing loan; the net value of switching of loan purpose from investor to owner-occupier is estimated to have been $61 billion over the period of July 2015 to November 2017, of which $1.2 billion occurred in November 2017. These changes are reflected in the level of owner-occupier and investor credit outstanding. However, growth rates for these series have been adjusted to remove the effect of loan purpose changes.


Lending In Sept 2017 Still Fixated On Housing

The RBA has released their financial aggregates to September 2017.  The data confirms the growth is still in the mortgage sector, with both owner occupied and investment lending growing quite fast, significantly faster than productive business lending. So expect to see household debt rise still further. The settings are just not right to create sustainable economic growth, rather they still support a debt driven property splurge.

There was a significant volume of loans switched in the month – $1.4m are shown in the aggregates table, but are corrected in the growth tables, which is why investor lending is reported more strongly there.

Overall lending for housing rose 0.5% in the months, or 6.6% for the year, which is higher than the 6.4% the previous year. Personal credit rose slightly in the month and down 1.% in the past year.  Lending to business rose just 0.1% to 4.3% for the year, which is down from 4.8% the previous year.

Owner occupied lending grew $5.5bn or 0.5% to $1.11 trillion while investment lending rose $1.9% or 0.3% to $583 billion. Lending to business rose just $0.3 billion and personal credit rose $0.3 billion or 0.2%, the first rise since February 2017.

The share of investment lending remained at 34.3% of lending for housing, while the share of all lending to business fell to 32.7%.

Looking at the adjusted RBA percentage changes we see that over the 12 months investor lending is still stronger than owner occupied lending, both of which showed a slowing growth trend, while last month growth in business lending continued to ease.

The RBA noted that:

Following the introduction of an interest rate differential between housing loans to investors and owner-occupiers in mid-2015, a number of borrowers have changed the purpose of their existing loan; the net value of switching of loan purpose from investor to owner-occupier is estimated to have been $59 billion over the period of July 2015 to September 2017, of which $1.4 billion occurred in September 2017. These changes are reflected in the level of owner-occupier and investor credit outstanding. However, growth rates for these series have been adjusted to remove the effect of loan purpose changes.

RBA Says Housing Credit Still Growing

The latest RBA data on credit, to August 2017 tells a somewhat different story to the APRA data we discussed already. There were clearly adjustments in the system [CBA in particular?]  and the non-bank sector is picking up some of the slack.

Overall housing credit rose 0.5% in August, and 6.6% year-ended August 2017. Personal credit fell again, down 0.2%, and 1.1% on a 12 month basis. Business credit also rose 0.5%, or 4.5% on annual basis. But overall lending for housing is still growing.

Here are the month on month (seasonally adjusted) movements. Owner occupied lending up $17.5 billion (0.68%), investment lending up $0.8 billion (0.14%), personal credit down $0.4 billion (-0.24%) and business lending up $4.2 billion or 0.47%.

As a result, the proportion of credit for housing (owner occupied and investor) still grew as a proportion of all lending.

Another $1.7 billion of loans were reclassified in the month. This will give an impression of greater slowing investment loan growth as a result.

Following the introduction of an interest rate differential between housing loans to investors and owner-occupiers in mid-2015, a number of borrowers have changed the purpose of their existing loan; the net value of switching of loan purpose from investor to owner-occupier is estimated to have been $58 billion over the period of July 2015 to August 2017, of which $1.7 billion occurred in August 2017. These changes are reflected in the level of owner-occupier and investor credit outstanding. However, growth rates for these series have been adjusted to remove the effect of loan purpose changes.

Home Lending Reaches Another Record

The RBA Credit Aggregates for July 2017 have been released. Overall credit rose by 0.5% in the month, or 5.3% annualised. Within that housing lending grew at 0.5% (annualised 6.6% – well above inflation), other Personal credit fell again, down 0.1% (annualised -1.4%) and business credit rose 0.5% (annualised 4.2%).

Home lending reached a new high at $1.689 trillion. Within that owner occupied lending rose $7 billion to $1.10 trillion (up 0.48%) and investor lending rose just $0.09 billion or 0.15% to $583 billion.  Investor mortgages, as a proportion of all mortgages fell slightly.

The adjusted movement data shows that investor housing is still at around 7%, higher than owner occupied loans and still way too high. Personal credit continues to languish, while business lending remains at around 4%. All growth rates for the financial aggregates are seasonally adjusted, and adjusted for the effects of breaks in the series

The more volatile monthly data shows a slight easing in housing credit growth this month, and a fall this month in business lending.

The RBA notes that:

Following the introduction of an interest rate differential between housing loans to investors and owner-occupiers in mid-2015, a number of borrowers have changed the purpose of their existing loan; the net value of switching of loan purpose from investor to owner-occupier is estimated to have been $56 billion over the period of July 2015 to July 2017, of which $1.4 billion occurred in July 2017. These changes are reflected in the level of owner-occupier and investor credit outstanding. However, growth rates for these series have been adjusted to remove the effect of loan purpose changes.

So more adjustments, either from mis-classification, or borrowers proactively switching from investment loans to get better rates.  This rate of switching has not slowed down, so it looks like a continuing process rather than a clerical error.

We suspect non-banks are picking up some of the investor lending slack as ADI’s conform to the regulators guidance. A quick calculation, comparing RBA and APRA data provides some validation: