Are You Being Enticed Into The Property Market?

Property expert Joe Wilkes and I discuss the current wave of offers targetting first time buyers, despite the slowing property market.

We use New Zealand as a case study, but the findings are highly relevant to the Australian market too.

Caveat Emptor! Note: this is NOT financial or property advice!!

Please consider supporting our work via Patreon

Please share this post to help to spread the word about the state of things….

First Time Buyers Won’t Take Up The Slack

We continue our analysis of the latest household survey results, with a deep dive into the motivations and barriers of first time buyers, whom both industry and government hope will pick up the slack as property investors flee.

We showed there was an increase in the number of first time buyers seeking property and saving to buy, and their intention to transact is a little higher. That said, the number of first time buyers is lower, at around 150,000 than the number of investors they are replacing at 650,000, so net demand will fall at a time when more new builds are coming on stream, something like 150,000 over the next 1-2 years.

Lets look at first time buyer relative priorities and motivations. Around 30% say the reason to buy relates to finding a place to live, while 15% said it was to gain a tax advantage, 14% to gain future capital growth, and 12% to access the first home owners grants, which some states are offering. 14% said it was to gain greater security (as opposed to short term renting) and 12% said it was because of a newly formed family. Only 3% said it would be cheaper than renting. More are getting help from the Bank of Mum and Dad, as we discussed recently.

We can also look at trends over time, and the proportion who think capital growth will occur has fallen by half in the past year, while the number seeking to take advantage of the first home owner grants has started to rise (mainly thanks to new state-based initiatives).  The other factors have remained pretty static, through more are seeking tax advantages and greater financial security.

Turning to the barriers to purchase, the first and most significant stumbling block is that home prices are still too high (37%). Next is the availability of finance at 32%, followed by finding a place to buy at 14%, risks relating to interest rate rises 6% and costs of living 9%. Fear of unemployment is a low 2%, and other factors, including overseas travel hardly registered.

Turning to the trend data we see the most significant factor is the growing proportion who are unable to get funding to purchase. Back in 2015, this hardly registered, whereas now one third of prospective purchasers cannot get funding. This is a reflection of the ever tighter lending standards currently in play, despite low attractor interest rates.

Next we turn to what type of property, and in which locations first time buyers are looking.

Around half of all first time buyers are expecting to purchase a unit or apartment, as opposed to a house. This continues the trend of recent years.  27% will be seeking a suburban unit, 19% a city edge unit and 3% a city centre unit.  The proportions are higher in the main east coast states, with Sydney, Melbourne and Brisbane all registering growing demand for units, thanks to price and affordability pressure.

The trend data shows a steady rise in unit purchases.

Just to round out our survey results, those wanting to buy find that availability of finance is the most significant barrier (32%), followed by high home prices (26%) and costs of living pressures (17%). Concerns about rising interest rates also came it at 17%.

You can see in the trends how concerns relating to funding and costs of living are rising.

Turning to those seeking to trade up, we see a pivot from property investment (34%) and consequential capital growth to finding more space to live (34%). Life style changes at 18% and job changes also figure (13%).

The trends are clear, it is now more about space, and less about property investment.  There are a smaller number of households in this category now, at around 600,000, so they will not be able to blot up all the available property, including those previously taken by investors.

Down traders are being driven more strongly by the urge to release capital (45%), whilst the intention to switch to an investment property is now lower (13%). Indeed there is an air panic, for fear of larger price fall later. One reason why more property is coming onto the market. Increased convenience (29%) and illness or death of spouse also figure. There are more than 1.2 million households in this group, so their need to sell will help to increase the supply of properties for sale, and so drive prices lower, especially at the upper end of the market.

The trends are pretty clear, with a greater concern to release capital a less of a focus on investment property purchase.

Put all the data together, and we conclude that despite strong migration, net demand for property will ease in the months ahead, with a consequential fall in values in many areas.

And finally, we also examined the purchase drivers across our household segments, and as you may have guessed, for many, price will be the critical determinate of purchase, whereas elements such as brand recognition, trust and flexibility were rated much lower. No surprise then that lenders are still offering amazing attractor rates to capture new business, despite pricing up their back books to maintain margin. As the Productively Commission highlighted, loyalty is not being rewarded by the industry. We happen to think this may change as the markets evolve and demand for credit slows.

We will incorporating these findings into our latest Core Market Model and the next edition of the Property Imperative report, due out in about a month.

More On Incentives For First Time Buyers In Victoria

The Victorian Government has reaffirmed their intent to shortly accept  applications for its shared equity scheme known as HomesVic from up to 400 applicants. This was first announced in March 2017.

As we said at the time:

… our analysis not only here but overseas is that they simply lifts prices by the same amount. It is a zero sum game.

Whilst we understand the political agenda, this move is unlikely to improve housing affordability and access to property.

Of course many will highlight that fact that buyers will be entering the market as prices being to go south, and might even suggest this is a further attempt to keep the property market afloat.

The scheme will allow young people to purchase a home with the state government providing up to 25 percent of the purchase price – reducing the size of the mortgage that must be taken out. When the house is sold, the government recoups its share of the proceeds.

The $50-million initiative aims to make it easier for first-home buyers to enter the market by reducing the size of their loan, hence reducing the amount they need to save for a deposit.

The initiative targets single first-home buyers earning an annual income of less than $75,000 and couples earning less than $95,000.

Eligible applicants must buy in so-called “priority areas” which include 85 Melbourne suburbs, seven fringe towns and 130 regional towns and suburbs.

In Melbourne, the list includes suburbs around Box Hill, Broadmeadows, Dandenong, Epping, Fishermen’s Bend, Footscray, Fountain Gate, Frankston, LaTrobe, Monash, Pakenham, Parkville, Ringwood, Sunshine and Werribee.

The scheme is not available in most of Melbourne’s bayside suburbs, the leafy inner eastern suburbs or some pockets of the inner north.

The state government said the locations were chosen in growth areas where there was a high demand for housing and access to employment and public transport.

Regional centres on the list include Ballarat, Bendigo, Castlemaine, Geelong, La Trobe, Mildura, Seymour, Shepparton, Wangaratta, Warrnambool and Wodonga.

Some of the locations are where mortgage stress, on our modeling is highest – we will release the January results next week.

The move was welcomed by HIA – “it is a positive scheme that addresses the rising problem of housing affordability and will help see young people achieve the Aussie dream of owning their own home faster,” senior spokesperson for HIA Kristen Brookfield said.

“HIA figures show that the typical stamp duty bill on homes in Victoria has risen by 4,000 percent since 1982. With the median price of a Melbourne dwelling at $720,417, this makes buying a house a pipe dream for so many low income young people.

“Buying a house gives an individual a sense of great pride and security. Although the HomesVic scheme is currently only open to 400 applicants, it is still a good start and we will watch its progress with keen interest,” Kristin Brookfield concluded.

Australians in for a Boon With New Super Changes in 2018

NAB says that Australians who are looking to buy their first home or are preparing for retirement could be in for a windfall in 2018, with a number of key superannuation changes expected to come into effect.

NAB Director of SMSF and Customer Behaviour, Gemma Dale said a number of key super reforms are expected to come into effect this year, so it’s important consumers stay on top of these change to ensure they capitalise on the opportunities.

“One of the big changes this year is the Downsizer contribution, which allows individuals aged 65 years plus to make non-concessional contributions of up to $300,000 per person to their super from the proceeds of selling their main residences,” Ms Dale said.

“But it is important to note that these contributions only apply to contracts of sale entered into from 1 July 2018, and the property also needs to be owned for at least 10 years before disposal.’’

Another key change is the first home super saver scheme.

“This scheme will allow eligible individuals who make voluntary super contributions from 1 July 2017 to withdraw these contributions, together with associated earnings for the purpose of purchasing their first home,” Ms Dale said.

“These voluntary contributions will be limited to $15,000 per year, up to a total of $30,000, and count towards the relevant contribution cap.

“Eligible individuals will be able to have up to 100 per cent of non-concessional and 85 per cent of concessional contributions plus associated earnings withdrawn from super to purchase their first home from 1 July.

“However, it is important to note, that the legislation for this scheme is yet to be passed, so there is a risk any voluntary contributions made in anticipation of it could be locked into individuals’ super.”

From 1 July, individuals with super balances of less than $500,000 on 30 June of the prior financial year will be able to access a higher annual cap and contribute their remaining unused concessional contribution cap on a rolling basis for a period of five years. But only unused amounts accrued from 1 July 2018 can be carried forward.

“This measure will enable customers who take time out of work or work part-time to make catch-up contributions when they accumulate lumpy income or decide to work full-time,’’ Ms Dale said.

Ms Dale encouraged Australians to seek advice before making any decisions to ensure it is in their best interest.

Some key super changes expected to come into effect from 1 July 2018

  • First home super saver scheme – This scheme allows eligible individuals who make voluntary super contributions on or after 1 July 2017 to withdraw these contributions, together with associated earnings for the purpose of purchasing their first home. These voluntary contributions are limited to $15,000 per year, up to a total of $30,000 and count towards the relevant contribution cap.
  • Downsizer contributions – The Government introduced a Bill in September 2017 allowing individuals aged 65 years or over to make non-concessional contributions of up to $300,000 (per person) to their superannuation from proceeds of selling their main residences
  • Catch-up contribution concessions – Individuals with super balances less than $500,000 on 30 June of the prior financial year will be able to access a higher annual cap and contribute their remaining unused concessional contribution cap on a rolling basis for a period of five years. Only unused amounts accrued from 1 July 2018 can be carried forward.

Bank of Mum and Dad Now Offers “Deposit Free” First Time Buyer Loans

Hopping on the “Bank of Mum and Dad” bandwagon, Bluebay Home Loan, a  WA-based mortgage manager has launched a “new” loan offering designed to help first time buyers access the market without a deposit.

Our research shows that many first time buyers are getting help from parents – on average up to $88,000. But there are risks attached (especially in a falling market), as we discussed some time back, and at a time when many lenders are desperate to lend to first time buyers.

Now, Bluebay have introduced a Parent Assist Home Loan, which formalises the Bank of Mum and Dad arrangements and allows first home buyers (FHBs) to receive a loan for a home deposit of 5 per cent to 20 per cent from parents, with interest-only repayments at half the rate of the home loan.

There may be some benefit in a more formal structure, as many Bank of Mum and Dad arrangements are very informal!

By using this structure, first home buyers who borrow 20 per cent of the property from their parents are exempt from lenders mortgage insurance (LMI). LMI premiums are expensive, and many brokers now recommend avoiding them. In addition, first time borrowers can get access to first home owner grants within this structure.

Rather than spend years saving for a deposit, a parent can lend their child up to 20% of the property’s purchase price.

It’s an official structured loan managed by Bluebay Home Loans.

Bluebay Home Loans arranges and manages the remainder of the loan through a large lender.

Because it’s a loan and not a gift, parents are paid back with interest.

Interest is half the interest rate of the Bluebay home loan rate, which helps on the parents loaned amount with lower repayments.

Parents are paid back over time or when the house is sold or refinanced, including their share of any investment growth.

Parents don’t have to become a guarantor so children are not asking them to risk their family home.

The new homebuyer still gets access to the First Home Owner’s Grant and any stamp duty concessions.

Because you’ve contributed a larger deposit you could save paying thousands of dollars in mortgage insurance.

The fees are transparent with an ongoing management fee of only $5 per month.

The new buyer gets a little more financial muscle, which means they’ll have more choice to buy something bigger, somewhere better or maybe even something closer to the family.

And remember, things happen in life Whatever changes occur down the track, parents have official protection over their money.

Most importantly, a Parent Assist Home Loan removes the stress and emotion of borrowing money from a parent


Some Segments Are More Likely To Buy, But Is It Enough?

Now, in our review of the results from our household surveys, we look at owner occupied purchasers. We start with “want to buys” – households who would like to purchase but cannot.  High home prices are the strongest barrier (31%), followed by availability of finance (27%), rising costs of living (17%) and concerns about interest rate rises (16%). Unemployment is not currently a major concern.

Turning to first time buyers, around 30% are buying for a place to live, while 17% are eying the potential capital gains (down from 31% a year ago). 15% are motivated by tax breaks, and 11% by the availability of first home owner grants (FHOG), up from 1% a year ago.  Greater security is also another factor (12%).

Turning to first time buyer barriers, the most significant challenge is problems with finance availability at 24.5% (compared with 11% a year ago), and house prices 41.1% (compared with 45.5% a year ago). Finding a place to buy is a little easier, down from 24% a year ago to 16% now.

Looking at the type of property they expect to purchase, we see a rise in city edge units, and suburban units, as more purchase an apartment not a house.  17% are not sure what to buy, compared with 22% a year ago.

Those seeking to refinance are driven a desire to reduce monthly payments (42%), 17% to withdraw capital, 18% for a better interest rate and 14% to lock in a fixed rate. Poor lender service is not a significant driver of refinancing.

Those seeking to sell and move down the market are seeking to release capital for retirement (41%), up from a year ago, 30% moving for great living convenience, and 10% because of illness or death of a spouse. Interestingly, the attraction of putting funds into an investment property has reduced from 23% a year ago to 16% now.

Finally, those seeking to trade up, 32% are doing so to get more space, 38% for investment purposes down from 43% a year ago, 17% for life style change and 13% for job change.

So the surveys highlight the lower appetite for investment property, the barriers limiting access to funds, and the desire to extract capital before prices fall much further.

Putting all this together, we think home prices are likely to fall further, as investor appetite continue to dissipate, and whilst there will be some first time buyer substitution, it will not be sufficient to keep prices high. Sydney, Brisbane and Melbourne markets are most likely to see a fall though 2018.  There is a risk of a more sustained fall if more property investors decide to cut their losses and try to lock in paper profits.


First Time Buyers Keep The Property Market Afloat – The Property Imperative Weekly – 9th Dec 2017

First Time Buyers are keeping the property ship afloat for now, but what are the consequences?

Welcome to the Property Imperative weekly to 9th December 2017. Watch the video, or read the transcript.

In our weekly digest of property and finance news, we start this week with the latest housing lending finance from the ABS. The monthly flows show that owner occupied lending fell $23m compared with the previous month, down 0.15%, while investment lending flows fell 0.5%, down $60m in trend terms. Refinanced loans slipped 0.13% down $7.5 million. The proportion of loans excluding refinanced loans for investment purposes slipped from a recent high of 53.4% in January 2015, down to 44.6% (so investment property lending is far from dead!)

While overall lending was pretty flat, first time buyers lifted in response to the increased incentives in some states, by 4.5% in original terms to 10,061 new loans nationally. At a state level, FTB’s accounted for a 19% per cent share in Victoria and 13.7% in New South Wales, where in both states, a more favourable stamp duty regime and enhanced grants were introduced this year. But, other states showed a higher FTB share, with NT at 24.8%, WA at 24.6%, ACT at 20.1% and QLD 19.7%. SA stood at 13% and TAS at 13.3%. There was an upward shift in the relative numbers of first time buyers compared with other buyers (17.6% compared with 17.4% last month), still small beer compared with the record 31.4% in 2009. These are original numbers, so they move around each month. The number of first time buyer property investors slipped a little, using data from our household surveys, down 0.8% this past month. Together with the OO lift, total first time buyer participation has helped support the market.

The APRA Quarterly data to September 2017 shows that bank profitability rose 29.5% on 2016 and the return on equity was 12.3% compared with 9.9% last year. Loans grew 4.1%, thanks to mortgage growth, provisions were down although past due items were $14.3 billion as at 30 September 2017. This is an increase of $1.5 billion (11.8 per cent) on 30 September 2016. The major banks remain highly leveraged.

The property statistics showed that third party origination rose with origination to foreign banks sitting at 70% of new loans, mutuals around 20% and other banks around the 50% mark. Investment loan volumes have fallen, though major banks still have the largest relative share, above 30%.  Mutuals are sitting around 10%.  Interest only loans have fallen from around 40% in total value to 35%, but this represents a fall from around 30% of the loan count, to 27%. This reflects the higher average loan values for IO borrowers. The average loan balance for interest only loans currently stands at $347,000 against the average balance of $264,000.  No surprise of course, as these loans do not contain any capital repayments (hence the inherent risks involved, especially in a falling market).

But there has been a spike in loans being approved outside serviceability, with major banks reporting 5% or so in September. This may well reflect a tightening of standard serviceability criteria and the wish to continue to grow their loan books. We discussed this on Perth 6PR Radio.  So overall, we see the impact of regulatory intervention. The net impact is to slow lending momentum. As lenders tighten their lending standards, new borrowers will find their ability to access larger loans will diminish. But the loose standards we have had for several years will take up to a decade to work through, and with low income growth, high living costs and the risk of an interest rate rise, the risks in the system remain.

On the economic front, GDP from the ABS National Accounts was 0.6%. This was below the 0.7% expected. This gives an annual read of 2.3%, in trend terms, well short of the hoped for 3%+. Seasonally adjusted, growth was 2.8%. Business investment apart, this is a weak and concerning result.  The terms of trade fell. GDP per capita and net disposable income per capita both fell, which highlights the basic problem the economy faces.  The dollar fell on the news. Households savings also fell. No surprise then that according to the ABS, retail turnover remained stagnant in October. The trend estimate for Australian retail turnover fell 0.1 per cent in October 2017 following a relatively unchanged estimate (0.0 per cent) in September 2017. Compared to October 2016 the trend estimate rose 1.8 per cent. Trend estimates smooth the statistical noise.

So no surprise the RBA held the cash rate once again for the 16th month in a row.

The latest BIS data on Debt Servicing ratios shows Australia is second highest after the Netherlands. We are above Norway and Denmark, and the trajectory continues higher. Further evidence that current regulatory settings in Australia are not correct. As the BIS said, such high debt is a significant structural risk to future prosperity. They published a special feature on household debt, in the December 2017 Quarterly Review. They call out the risks from high mortgage lending, high debt servicing ratios, and the risks to financial stability and economic growth.  All themes we have already explored on the DFA Blog, but it is a well-argued summary. Also note Australia figures as a higher risk case study.  They say Central banks are increasingly concerned that high household debt may pose a threat to macroeconomic and financial stability and highlighted some of the mechanisms through which household debt may threaten both. Australia is put in the “high and rising” category.  The debt ratio now exceeds 120% in both Australia and Switzerland.  Mortgages make up the lion’s share of debt.  In Australia mortgage debt has risen from 86% of household debt in 2007 to 92% in 2017.

Basel III was finally agreed this week by the Central Bankers Banker – the Bank for International Settlements – many months later than expected and somewhat watered down. Banks will have to 2022 to adopt the new more complex framework, though APRA said that in Australia, they will be releasing a paper in the new year, and banks here should be planning to become “unquestionably strong” by 1 January 2020.  We note that banks using standard capital weights will need to add different risk weights for loans depending on their loan to value ratio, advanced banks will have some floors raised, and investor category mortgages (now redefined as loans secured again income generating property) will need higher weights. Net, net, there will be two effects. Overall capital will probably lift a little, and the gap between banks on the standard and internal methods narrowed. Those caught transitioning from standard to advanced will need to think carefully about the impact. This if anything will put some upwards pressure on mortgage rates.

The Treasury issues a report “Analysis of Wages Growth” which paints a gloomy story. Wage growth, they say, is low, across all regions and sectors of the economy, subdued wage growth has been experienced by the majority of employees, regardless of income or occupation, and this mirrors similar developments in other developed western economies. Whilst the underlying causes are far from clear, it looks like a set of structural issues are driving this outcome, which means we probably cannot expect a return to “more normal” conditions anytime some. This despite Treasury forecasts of higher wage growth later (in line with many other countries). We think this has profound implications for economic growth, tax take, household finances and even mortgage underwriting standards, which all need to be adjusted to this low income growth world.

Mortgage Underwriting standards are very much in focus, and rightly, given flat income growth.  There was a good piece on this from Sam Richardson at Mortgage Professional Australia which featured DFA. He said that over four days in late September two major banks added extra checks to an already-extensive application process. ANZ introduced a Customer Interview Guide requiring brokers to ask questions about everything from a customer’s Netflix subscription to whether they were planning to start a family. Three days later CBA introduced a simulator that would show interest-only borrowers how their repayments would change and affect their lifestyle. Customers would be required to fill in an ‘acknowledgement form’ to proceed with an interest-only application.

Getting good information from customers is hard work, not least because as we point out, only half of households have formal budgeting. So, when complete the mortgage application, households may be stating their financial position to the best of their ability, or they may be elaborating to help get the loan. It is hard to know. Certainly banks are looking for more evidence now, which is a good thing, but this may make the loan underwriting processes longer and harder. Improvements in technology could improve underwriting standards for banks while pre-populating interactive application forms for consumers and offering time-saving solutions to brokers and Open Banking may help, but while Applications can be made easier, this does not necessarily mean shorter.

More data this week on households, with a survey showing Australians have become more cautious of interest only loans with online panel research revealing that 46 per cent of Australians are Adamant Decliners of interest-only home loans according to research from the  Gateway Credit Union. In addition, a further quarter of respondents are Resistant Approvers, acknowledging the benefits of interest-only loans yet choosing not to utilise them. Of the generations, Baby Boomers are most likely to be Adamant Decliners and therefore, less likely to use interest-only products. While Gen Y are most likely to be Enthusiastic Users.

Banks continue to offer attractive rates for new home loans, seeking to pull borrows from competitors. Westpac for example, announced a series of mortgage rate cuts to attract new borrowers, as it seeks to continue to grow its portfolio, leveraging lower funding costs, and the war chest it accumulated earlier in the year from back book repricing, following APRA’s tightening of underwriting standards and restrictions on interest only loans. Rates for both new fixed rate loans and variable rate loans were reduced.  For example, the bank has also increased the two-year offer discount on its flexi first option home for principal and interest repayments from 0.84% p.a. to 1.00% p.a. putting the current two-year introductory rate at 3.59% p.a.

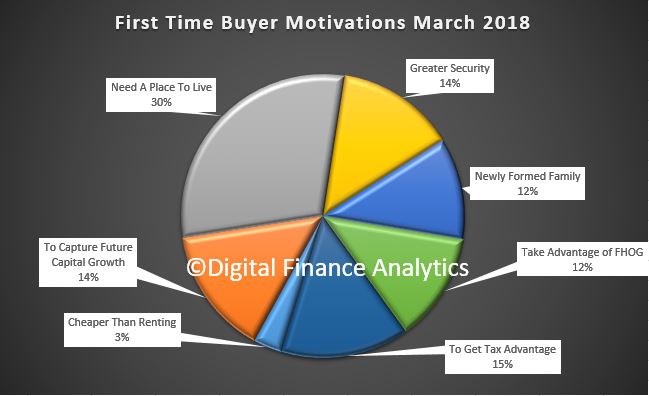
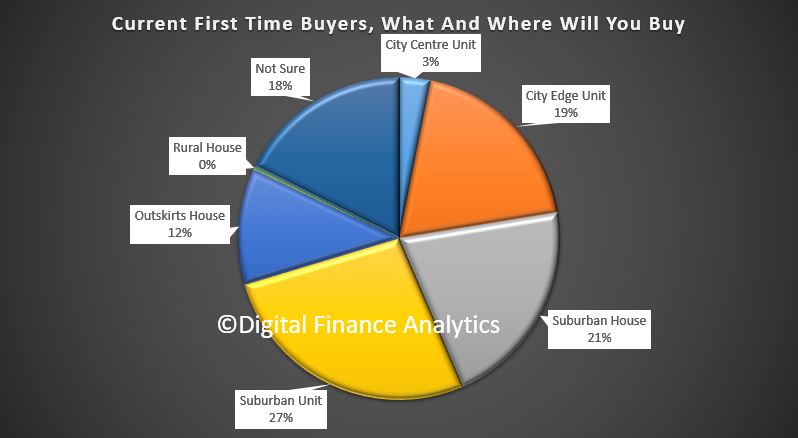
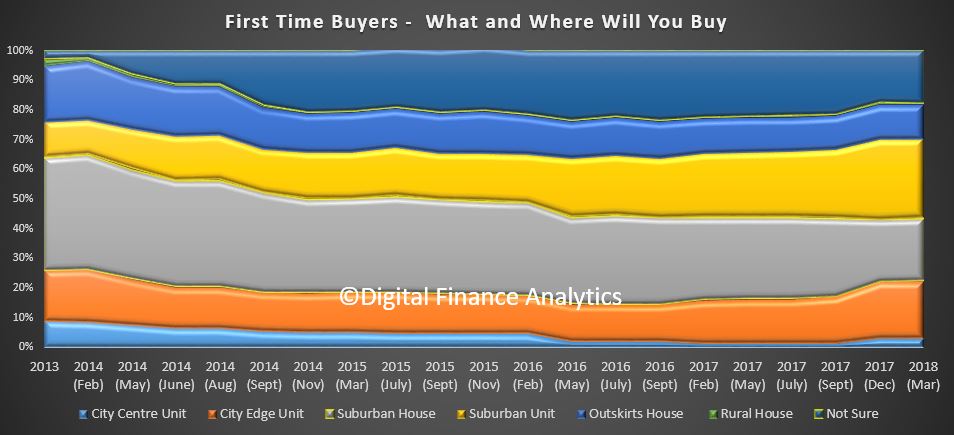
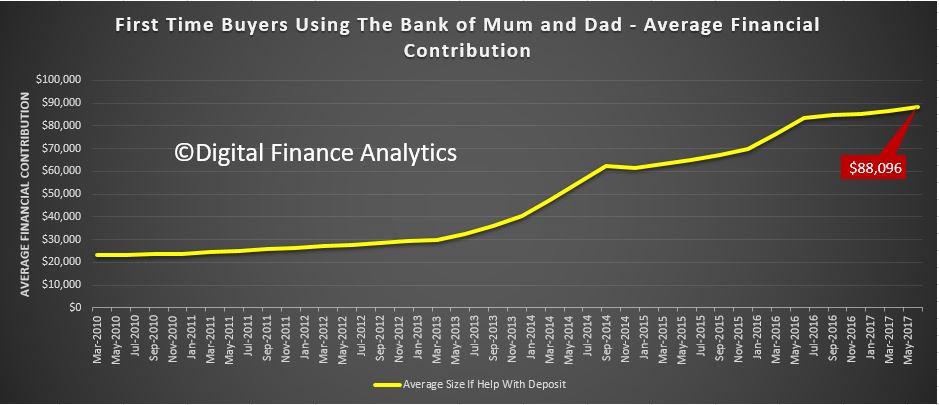
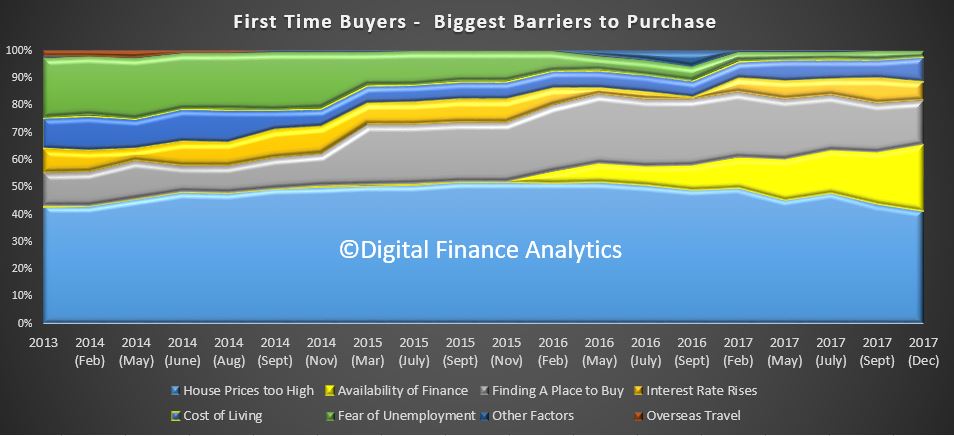
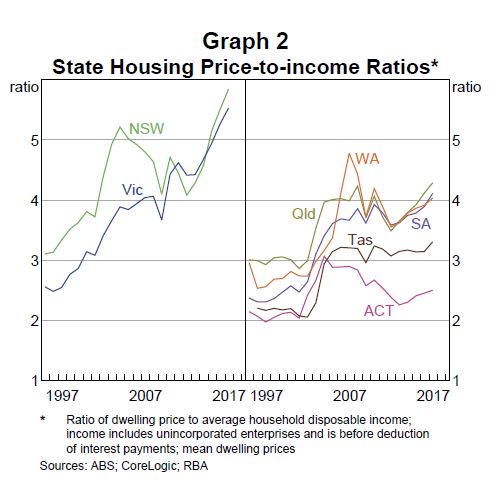
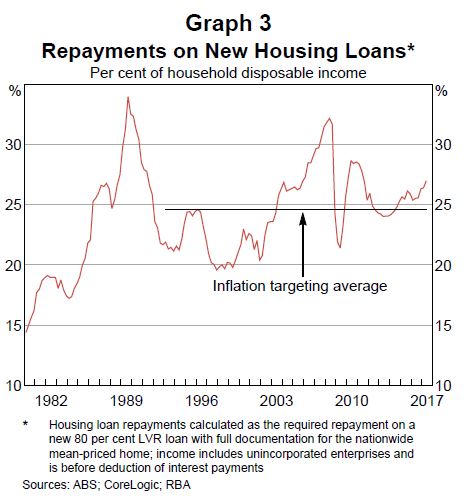
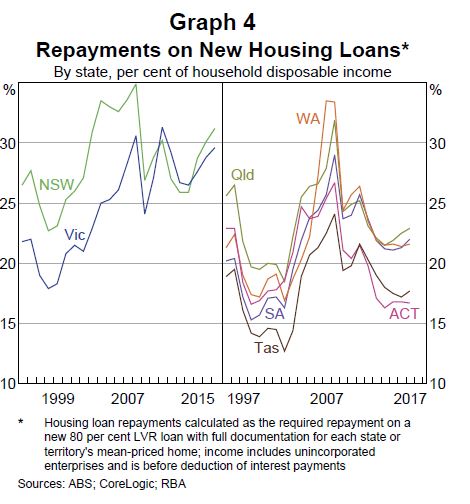
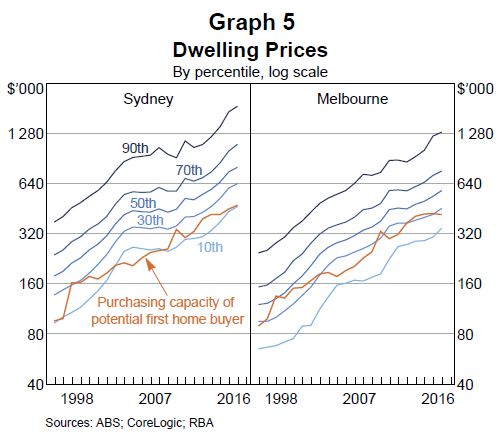
The RBA released their latest Bulletin  and it contained an interesting section on Housing Accessibility For First Time Buyers.  They suggest that in many centers, new buyers are able to access the market, thanks to the current low interest rates. But the barriers are significantly higher in Melbourne, Sydney and Perth. They also highlight that FHBs (generally being the most financially constrained buyers) are not always able to increase their loan size in response to lower interest rates because of lenders’ policies. Indeed, the average FHB loan size has been little changed over recent years while the gap between repeat buyers and FHBs’ average loan sizes has widened. They also showed that in aggregate, rents have grown broadly in line with household incomes, although rent-to-income ratios suggest housing costs for lower-income households have increased over the past decade.

Housing affordability has improved somewhat  across all states and territories, allowing for a large increase in the number of loans to first-home buyers, according to the September quarter edition of the Adelaide Bank/REIA Housing Affordability Report. The report showed the proportion of median family income required to meet average loan repayments decreased by 1.2 percentage points over the quarter to 30.3 per cent. The result was decrease of 0.6 percentage points compared with the same quarter in 2016. However, Housing affordability is still a major issue in Sydney and Melbourne they said.  In addition, over the quarter, the proportion of median family income required to meet rent payments increased by 0.3 percentage points to 24.6 per cent.

Our own Financial Confidence Index for November fell to 96.1, which is below the 100 neutral metric, down from 96.9 in October 2017. This is the sixth month in succession the index has been below the neutral point. Owner Occupied households are the most positive, scoring 102, whilst those with investment property are at 94.3, as they react to higher mortgage repayments (rate rises and switching from interest only mortgages), while rental yields fall, and capital growth is stalling – especially in Sydney.  Households who are not holding property – our Property Inactive segment – will be renting or living with friends or family, and they scored 81.2. So those with property are still more positive overall. Looking at the FCI score card, job security is on the improve, reflecting rising employment participation, and the lower unemployment rate.  Around 20% of households feel less secure, especially those with multiple part time jobs. Savings are being depleted to fill the gap between income and expenditure – as we see in the falling savings ratio. As a result, nearly 40% of households are less comfortable with the amount they are saving. This is reinforced by the lower returns on deposit accounts as banks seek to protect margins. More households are uncomfortable with the amount of debt they hold with 40% of households concerned. The pressure of higher interest rates on loans, tighter lending conditions, and low income growth all adds to the discomfort. More households reported their real incomes had fallen in the past year, with 50% seeing a fall, while 40% see no change.  Only those on very high incomes reported real income growth.

Finally, we also released the November mortgage stress and default analysis update. You can watch our video counting down the most stressed postcodes in the country. But in summary, across Australia, more than 913,000 households are estimated to be now in mortgage stress (last month 910,000) and more than 21,000 of these in severe stress, the same as last month. Stress is sitting on a high plateau. This equates to 29.4% of households. We see continued default pressure building in Western Australia, as well as among more affluent household, beyond the traditional mortgage belts across the country. Stress eased a little in Queensland, thanks to better employment prospects. We estimate that more than 52,000 households risk 30-day default in the next 12 months, similar to last month. We expect bank portfolio losses to be around 2.8 basis points, though with losses in WA rising to 4.9 basis points.

So, the housing market is being supported by first time buyers seeking to gain a foothold in the market, but despite record low interest rates, and special offer attractor rates, many will be committing a large share of their income to repay the mortgage, at a time when income growth looks like it will remain static, costs of living are rising, and mortgage rates will rise at some point. All the recent data suggests that underwriting standards are still pretty loose, and household debt overall is still climbing. This still looks like a high risk recipe, and we think households should do their own financial assessments if they are considering buying at the moment – for home prices are likely to slide, and the affordability equation may well be worse than expected. Just because a lender is willing to offer a large mortgage, do not take this a confirmation of your ability to repay. The reality is much more complex than that. Getting mortgage underwriting standards calibrated right has perhaps never been more important than in the current environment!

And that’s the Property Imperative to 9th December 2017. If you found this useful, do leave a comment, sign up to receive future research and check back next week for the latest update. Many thanks for taking the time to watch.

The RBA On Housing Affordability

The RBA released their latest Bulletin today  and it contained an interesting section on Housing Accessibility For First Time Buyers.  They suggest that in many centers, new buyers are able to access the market, at the current low interest rates. But the barriers are significantly higher in Melbourne, Sydney and Perth.

They also highlight that FHBs (generally being the most financially constrained buyers) are not always able to increase their loan size in response to lower interest rates because of lenders’ policies. Indeed, the average FHB loan size has been little changed over recent years while the gap between repeat buyers and FHBs’ average loan sizes has widened.

The article starts with an analysis of housing price-to-income ratios.

In Australia, the housing price-to-income ratio has increased since the early 1990s, and has increased particularly rapidly over the past five years to reach its highest level on record. At face value, this suggests that housing affordability is at a record low. However, this masks significant differences across states. The recent trend increase in the housing price-to-income ratio is largely due to increases in the ratios in New South Wales and Victoria (Graph 2). The housing price-to-income ratios have increased by less in other states in recent years and suggest that housing affordability in those states is at a similar level to the mid 2000s.

This housing affordability measure accounts for changes in average housing prices and household income. However, it ignores the effect of changes in interest rates on borrowing costs and other financial factors that may affect a household’s purchasing capacity and therefore their ability to purchase a home.

If interest rates fall, households can afford to repay a larger mortgage, all other things being equal. This would be reflected in a lower mortgage debt-servicing ratio, and would imply greater affordability. There is no role for changes to the deposit burden in the mortgage debt-servicing ratio, as the LVR is considered to be fixed. Looking at the trends over time, the aggregate mortgage debt-servicing ratio has risen over the
past year or so and is currently above the average of the inflation-targeting period but below historical peaks

There are significant state variations.

A shortcoming of the conventional estimates of housing affordability is that, by focussing on the average home price and average household income, they measure affordability for the average household. But the typical FHB is not the same as the average household – they tend to be younger and less wealthy. Also, if most FHBs buy homes that are cheaper than the average, then measures that focus on the average home will provide a poor guide to the ability of FHBs to purchase their first home (i.e. housing accessibility). To address these shortcomings, we construct a housing accessibility index that specifically focuses on the purchasing capacity of potential FHBs

This measure combines information from household surveys with data on all housing sale transactions in Australia. It shows housing accessibility is around the long-run average in aggregate in Australia, with the median potential FHB being able to afford around one-third of all homes sold in 2016, although this share is significantly lower in Sydney, Melbourne and Perth. Moreover, the quality of homes that potential FHBs can afford has fallen over time, as measured by location and the number of bedrooms. This measure also shows accessibility is lower in capital cities, particularly in areas close to the CBD.

The cost of renting is also an important component of housing affordability and the number of households renting has trended up over the past few decades. In aggregate, rents have grown broadly in line with household incomes, although rent-to-income ratios suggest housing costs for lower-income households have increased over the past decade.

ABC Radio Does Housing

I had the chance to discuss at some length the latest dynamics of the housing and property markets with ABC’s Jules Schiller on ABC Radio last night.

You can listen to the discussion.

We discussed the concept of affordability to first-time house buyers and the latest Bankwest study which shows how budget-friendly the Australian housing market is today. North says that the country has an existing dilemma to repair in able for younger people to buy houses easily.

North says that giving incentives to first-time buyers will only lessen the interest of the house they are set to buy, adding that it might not help those people. He believes that reforms in the housing sector are needed to solve this issue of unaffordable housing among new buyers. He talks about the different housing prices in the East coast where Sydney resides and the West Coast where Perth is located. He gives advice to first-time buyers when is the right time to buy houses in capital cities in Australia.

He believes that there are several uncertainties concerning the current set-up of the housing market. He says that a Housing Royal Commission is more needed than a Banking one, though this inquiry can affect the housing industry but he is not sure whether first-time buyers will feel the effect once the inquiry is finished. He says that the inquiry should look into how banks are dealing with mortgage payments and other transactions.

He cannot say whether foreign ownership of some houses and lands in the country are largely affecting the first-time buyers but it is a factor. He says that there are many markets where first-time buyers can invest like Adelaide, Hobart and Brisbane.

UK’s reduction of stamp duty for first-time homebuyers will benefit RMBS

From Moody’s

On 22 November, the UK government announced a number of measures in its Autumn Budget, including a stamp duty reduction that will benefit 95% of first-time homebuyers, with a maximum saving of £5,000 per buyer. For purchases completed on or after 22 November 2017, first-time buyers do not have to pay stamp duty on properties worth up to £300,000, while for properties worth up to £500,000 they pay £5,000 less. The stamp duty for purchases above £500,000 is unchanged. Such measures will be credit positive for residential mortgage-backed securities (RMBS), allowing first-time buyers to amass the down payment they need to take out a loan faster or allow them to borrow a larger amount, strengthening both housing demand and property prices and lowering market-implied loan-to-value ratios on existing loans.

The stamp duty reduction will help alleviate some of the financial burden on first-time buyers amid stagnant wage growth, proportionally more household cost expenditures, and rising rents (rental price inflation in the UK has slowed recently, but was up 0.9% in October 2017 versus a year ago, according to HomeLet). Nevertheless, first-time buyers, especially in London and surrounding counties, still face relatively high equity layouts compared with other regions. Our recent RMBS pool analysis also showed that compared with non-first-time buyers, first-time buyers start with up to 15% less equity in the property (see exhibit).

The budget also confirmed additional funding under the help-to-buy equity loan scheme, another credit positive because it increases the availability of loans for borrowers, while supporting house prices, which overall we expect will remain flat in 2018. Under the scheme, borrowers can purchase a newly built property with just a 5% deposit. Since its launch, borrowers have purchased 120,864 properties, with 81% of the sales attributable to first-time buyers. In 2017, Halifax Ltd. estimated that first-time buyers accounted for almost half of all mortgage-financed house purchases, an important driver of housing demand.