
We review today’s economic news, the RBA decision, and the current state of household finances via our mortgage stress report.
Tag: RBA
RBA Holds, As We Expected
At its meeting today, the Board decided to leave the cash rate unchanged at 1.50 per cent. They reinforced the labour market as the key to future rate moves, looking past lower inflation. That is a pretty strong signal about what would lead to a cut. They are still reciting stronger growth than many believe is feasible.
Franking, cutting now would be using using up the limited ammo they have, for no good reason. Savers will be relieved!

The outlook for the global economy remains reasonable, although the risks are tilted to the downside. Growth in international trade has declined and investment intentions have softened in a number of countries. In China, the authorities have taken steps to support the economy, while addressing risks in the financial system. In most advanced economies, inflation remains subdued, unemployment rates are low and wages growth has picked up.
Global financial conditions remain accommodative. Long-term bond yields are low, consistent with the subdued outlook for inflation, and equity markets have strengthened. Risk premiums also remain low. In Australia, long-term bond yields are at historically low levels and short-term bank funding costs have declined further. Some lending rates have declined recently, although the average mortgage rate paid is unchanged. The Australian dollar is at the low end of its narrow range of recent times.
The central scenario is for the Australian economy to grow by around 2¾ per cent in 2019 and 2020. This outlook is supported by increased investment in infrastructure and a pick-up in activity in the resources sector, partly in response to an increase in the prices of Australia’s exports. The main domestic uncertainty continues to be the outlook for household consumption, which is being affected by a protracted period of low income growth and declining housing prices. Some pick-up in growth in household disposable income is expected and this should support consumption.
The Australian labour market remains strong. There has been a significant increase in employment, the vacancy rate remains high and there are reports of skills shortages in some areas. Despite these positive developments, there has been little further progress in reducing unemployment over the past six months. The unemployment rate has been broadly steady at around 5 per cent over this time and is expected to remain around this level over the next year or so, before declining a little to 4¾ per cent in 2021. The strong employment growth over the past year or so has led to some pick-up in wages growth, which is a welcome development. Some further lift in wages growth is expected, although this is likely to be a gradual process.
The adjustment in established housing markets is continuing, after the earlier large run-up in prices in some cities. Conditions remain soft and rent inflation remains low. Credit conditions for some borrowers have tightened over the past year or so. At the same time, the demand for credit by investors in the housing market has slowed noticeably as the dynamics of the housing market have changed. Growth in credit extended to owner-occupiers has eased over the past year. Mortgage rates remain low and there is strong competition for borrowers of high credit quality.
The inflation data for the March quarter were noticeably lower than expected and suggest subdued inflationary pressures across much of the economy. Over the year, inflation was 1.3 per cent and, in underlying terms, was 1.6 per cent. Lower housing-related costs and a range of policy decisions affecting administered prices both contributed to this outcome. Looking forward, inflation is expected to pick up, but to do so only gradually. The central scenario is for underlying inflation to be 1¾ per cent this year, 2 per cent in 2020 and a little higher after that. In headline terms, inflation is expected to be around 2 per cent this year, boosted by the recent increase in petrol prices.
The Board judged that it was appropriate to hold the stance of policy unchanged at this meeting. In doing so, it recognised that there was still spare capacity in the economy and that a further improvement in the labour market was likely to be needed for inflation to be consistent with the target. Given this assessment, the Board will be paying close attention to developments in the labour market at its upcoming meetings.
Weaker Credit Impulse Signals More Home Price Falls, Despite New Record Debt
On the last working day of each month the RBA releases their Credit Aggregates and APRA their Monthly Banking Statistics for ADS‘s. Both are now out for March.
The headline news is the overall housing credit is up, to a new record of $1.82 trillion dollars up 0.31% from last month, or 0.31%. Within that owner occupied lending rose 0.32% to $1.22 trillion dollars and investment lending was flat. 32.7% of lending stock is for investment lending purposes, a slight fall from last month, whilst business lending as a proportion of all lending rose from 32.9% from 32.8% to reach $963.7 billion dollars. Personal credit fell 0.27% or $0.4 billion, to $147.1 billion, and continues to fall.
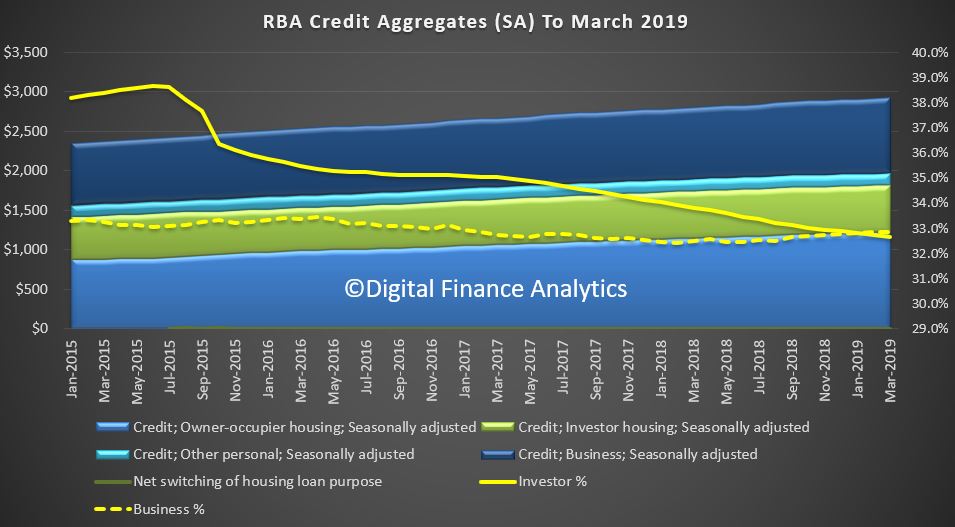
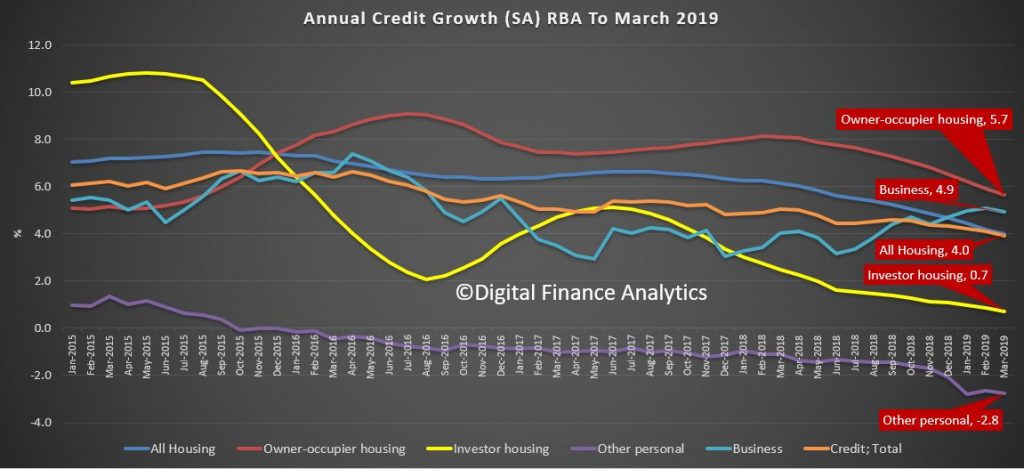
The annualised movements by category shows further weakness, with lending for owner occupied housing now at 5.7%, investment housing lending at 0.7%, giving housing overall growth of just 4% (though still higher than wages growth I would add). Personal credit fell 2.8% over the past year, while business lending rose 4.9% annualised. All these figures are on a seasonally adjusted basis
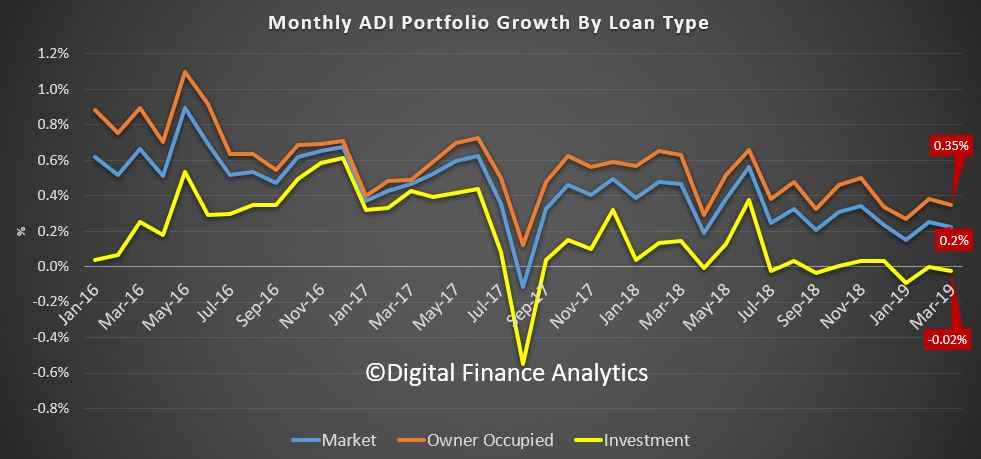
Turning to the APRA data on the banks, owner occupied lending rose 0.35% in March, while investment lending fell by 0.02%, giving total credit growth of just 0.2%. Over the past year owner occupied loans grew by 4.8% (compared with 5.7% at the aggregate level) and investor loans grew 0.4% (compared with 0.7% at the aggregate level). So the banks loan portfolios are growing more slowly than the market.
This can be illustrated by comparing the RBA and APRA data (warts and all) to show the non-bank sector is growing faster than the banks. Overall, they have over 7.5% of the market, which is up from the low in December 2016.
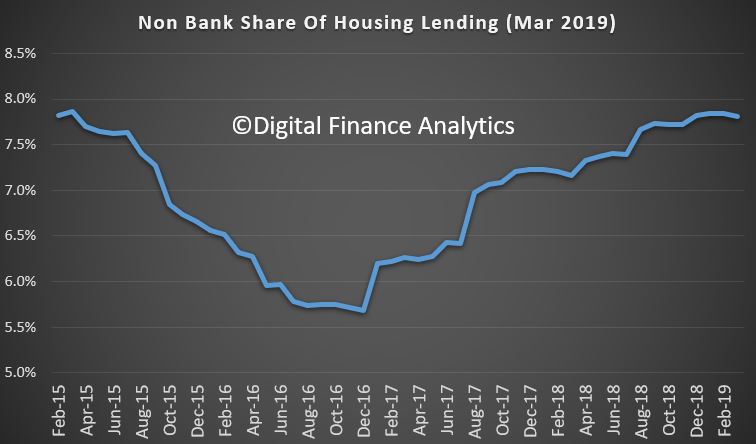
In addition, the rate of growth is significantly higher than the banks. Non-bank owner occupied loans are growing at an annual rate of 14%, while investment loans are 2.2%; both significantly higher than the ADI’s. Non-banks have weaker regulation, and more ability to lend. APRA has yet to truly engage with the sector.
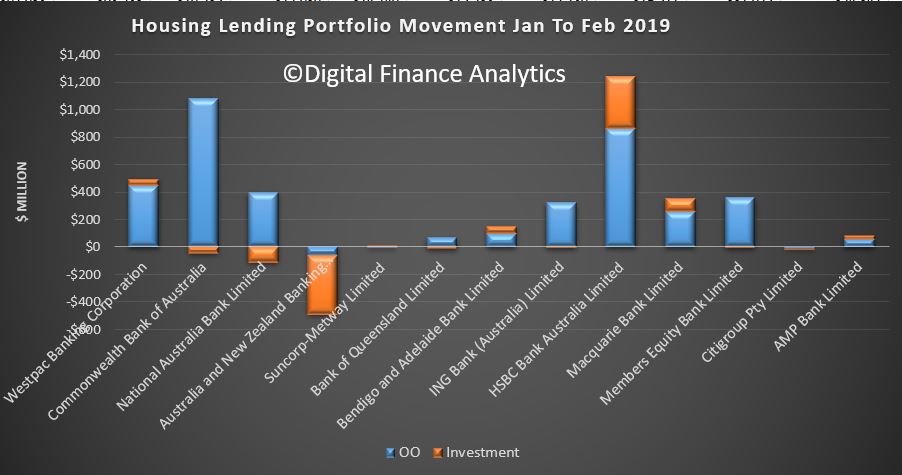
Turning back to the individual lenders, the changes in their portfolios over the month show that Westpac and CBA offered the most new owner occupied loans, while ANZ dropped back, on both owner occupied and investment loans, while NAB dropped investment lending. HSBC, Macquarie and Member Equity Bank (ME) lend more than the regionals.
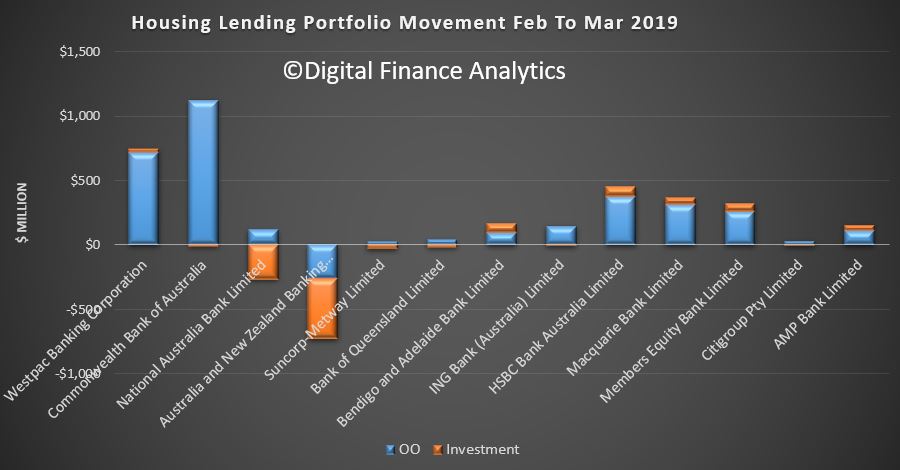
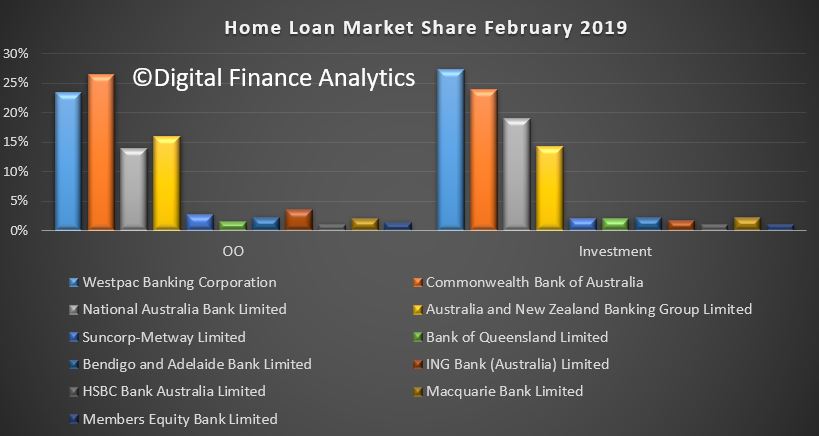
Overall market shares hardly moved, with CBA still the largest owner occupied lending, and Westpac the biggest investor lender.

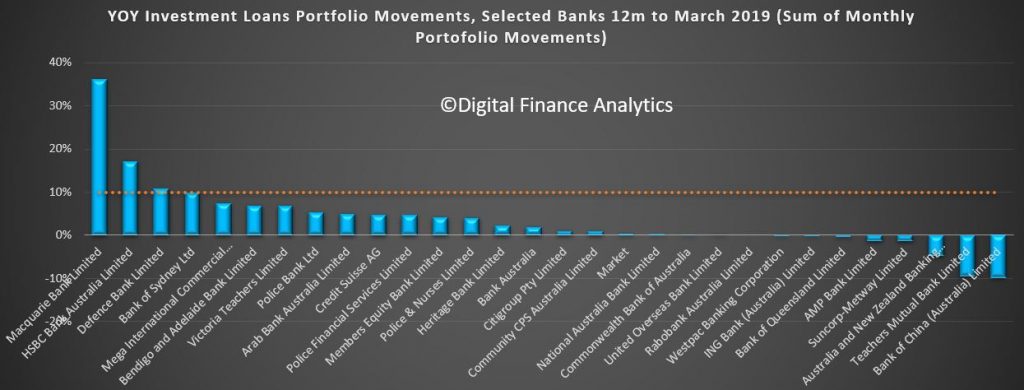
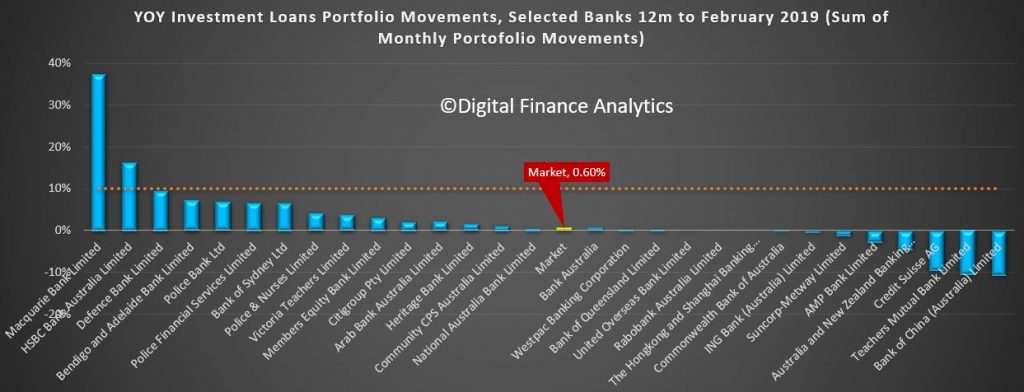
Investment lending growth over the past 12 months has been anemic, but some lenders such as Macquarie are making hay. Of course the old 10% speed limit from APRA has gone now, but the relative growth highlights the fact that the four majors are well below market growth levels – and ANZ the weakest (which is why they said they wanted to lend more).
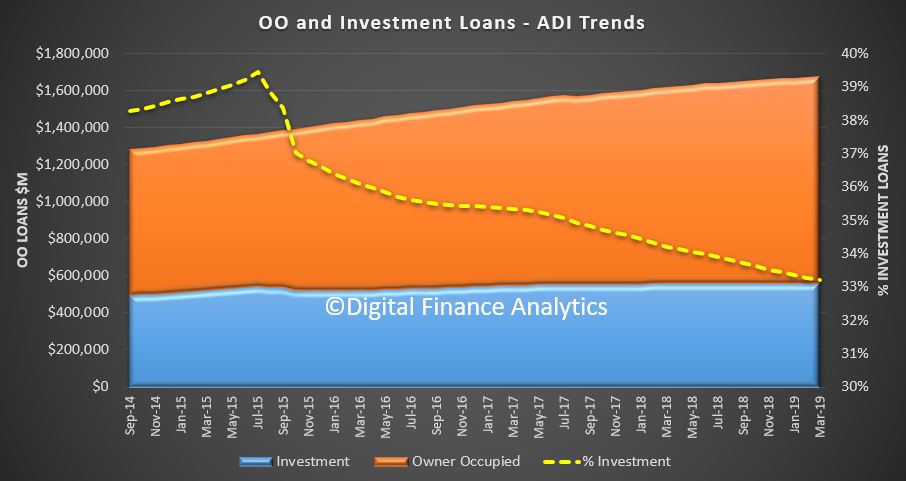
So finally, the total ADI lending book is at $1.68 trillion dollars, with owner occupied loans comprising $1.12 trillion dollars and investment loans $557 billion dollars, and comprising 33.2% of the portfolio – as the ratio continues to fall.
In conclusion, the credit impulse – the rate of change of credit being written is the most significant forward indicator of house price trajectory. The weak state of the market suggests more and significant price falls ahead. Yet despite all this, household debt will continue to rise. There is absolutely no reason to loosen lending requirements, or drop the hurdle rate on these numbers. More households will get into trouble ahead.
RBA More Dovish?
The RBA released their minutes today, and they highlight the current tensions between the domestic GDP and labour market data evolve. But more negative news was recited in the minutes, and this suggests rate cuts, not rate rises.

International Economic Conditions
Members commenced their discussion by noting that the slower pace of global economic activity had continued in recent months. This had been particularly evident in the manufacturing sector. Survey measures of conditions in the manufacturing sector had declined across a range of economies, although they had ticked up in China in March. Slower external demand, especially from China, had continued to weigh on export growth and the manufacturing sectors in the trade-exposed economies of east Asia, Japan and the euro area. In east Asia, the electronics cycle had turned, which had affected the region’s exports as well as investment in those economies with sizeable semi-conductor sectors.
Recent trade talks between the United States and China had taken on a somewhat more positive tone. However, the United States had also said it would consider imposing restrictions on automotive imports, which would affect large car exporters, including Germany and Japan.
In the major advanced economies, however, domestic demand conditions had remained positive, supported by an easing in financial conditions since the beginning of 2019, and were consistent with growth being around, or even above, potential. Underlying inflation had remained close to target in a number of advanced economies, but global headline inflation had declined since late 2018 because of the fall in oil prices.
Growth in consumption in the advanced economies had been supported by ongoing tightness in labour markets, which had led to an upward trend in wages growth over a number of years. In the United States, the unemployment rate had remained below levels consistent with full employment and employers had been finding it increasingly difficult to find suitable labour. Members observed that most sectors of the US labour market had experienced strong conditions and the pick-up in wages growth had been most pronounced for lower-income workers.
In Japan, consumption was expected to be supported by a bring-forward of spending ahead of an increase in the consumption tax in October 2019, as well as ongoing tightness in the labour market. In the euro area, the unemployment rate had been declining gradually and wage pressures had increased. However, employment intentions had eased in the euro area and, more sharply, in the United Kingdom in the context of ongoing uncertainty around Britain’s exit from the European Union.
The outlook for investment across the major advanced economies had been more mixed. In the United States, investment indicators had eased a little but remained above average, while investment in the euro area had weakened further. Members noted that political uncertainty in the United Kingdom and the euro area was weighing on investment in those economies. In Japan, survey measures suggested that business conditions would remain strong despite a prospective moderation in investment growth.
In China, growth in domestic demand had slowed. At its March meeting, the National People’s Congress had set a target of 6–6.5 per cent for growth in output in 2019, which was below the target of around 6.5 per cent in 2018. Members noted signs that stimulus measures implemented by the authorities over recent months were having an impact: growth in total social financing had increased a little, after slowing over the preceding year, and growth in infrastructure investment and retail spending had recovered. Residential construction activity had also increased. However, some recent indicators of production and investment in the manufacturing sector, which is more exposed to external demand, had been subdued. Exports from China to the United States had continued to decline, but China’s imports from the United States had increased a little over the first few months of 2019, after an earlier sharp decline. Australian coal shipments had continued to be affected by customs delays at Chinese ports.
Australia’s terms of trade had increased in the December quarter to be around 6 per cent higher over 2018. The terms of trade were expected to have increased further in the March quarter, although commodity price developments had been mixed since the previous meeting. Bulk commodity prices had been little changed because falls in coal prices had been largely offset by an increase in iron ore prices. Oil prices had risen, but were still 20 per cent below their recent peak in October 2018. Reflecting oil price movements in late 2018, liquefied natural gas (LNG) prices were expected to have declined over the first quarter of 2019. Other commodity prices had been little changed over the previous month.
Domestic Economic Conditions
Members commenced their discussion of the domestic economy by observing that growth had slowed markedly in the second half of 2018 compared with the first half. GDP had increased by 0.2 per cent in the December quarter and by 2.3 per cent over the year, which was below the forecasts presented in the February Statement on Monetary Policy. The soft December quarter outcome partly reflected another weak quarter of consumption growth and a larger-than-expected fall in dwelling investment. It also reflected some temporary factors, such as the weather-related disruption to resource exports and the effect of the drought. Public demand and non-mining investment had supported output growth. Members noted that the income-based measure of GDP growth had been particularly weak over the preceding year, while the expenditure-based measure had been stronger.
Growth in consumption had clearly slowed in the second half of 2018. The weakness had been concentrated in discretionary items, especially those that have historically been most correlated with housing prices and housing turnover, such as motor vehicles and home furnishings. Retail sales data and contacts in the Bank’s liaison program suggested that growth in housing-related consumption had remained soft in recent months.
Members noted that growth in household disposable income, which is an important driver of consumption growth, had been subdued for a number of years. In 2018, labour income growth had been above the very low rates seen in recent years, supported by a pick-up in growth in average hourly earnings and continued employment growth, but non-labour income growth had remained weak. Members observed that tax payments by households had been growing noticeably faster than income growth in recent years, partly because of efforts to increase tax compliance.
Dwelling investment appeared to have passed its peak, although there continued to be uncertainty about how quickly dwelling investment might decline over the forecast period. Construction of new dwellings had contracted in the second half of 2018; the largest falls in the December quarter had been for apartments in New South Wales and detached housing in Queensland. Slower housing activity had also weighed on the incomes of some building contractors and property professionals in the December quarter. There continued to be a large amount of work in the pipeline, which should support a relatively high level of building activity in the near term. Members noted that there had been a substantial rise in building approvals for high-density residential projects in February, although this series was volatile and in trend terms remained well below earlier peaks. Members also noted that population growth was expected to continue to support demand for housing over the medium term.
Conditions in the established housing market had remained weak in recent months. Housing prices had continued to fall in Sydney, Melbourne and Perth, and had declined a little in most other capital cities and regional areas. In March, Sydney prices were 13 per cent below their 2017 peak and Melbourne prices were 10 per cent below their peak. Although auction clearance rates in Sydney and Melbourne had increased over the first quarter of 2019, they remained at relatively low levels. Members noted that in Perth, housing prices had declined over the previous year, while the rental vacancy rate had declined sharply and there were signs that newly advertised rents were starting to increase. By contrast, rental vacancies in Sydney had risen, particularly in suburbs where the supply of new apartments had increased significantly.
Non-mining business investment had grown solidly in the December quarter, with non-residential construction having made the largest contribution to growth in the quarter, driven partly by strong growth in private sector infrastructure projects, such as roads and renewable energy. Forward-looking indicators, such as the substantial amount of work still to be done on private infrastructure projects, the relatively high level of non-residential building approvals and positive business investment intentions, pointed to further growth in non-mining business investment. Survey measures of business conditions had declined in late 2018, but had stabilised at above-average levels.
Mining activity had subtracted from growth in the second half of 2018, mainly reflecting ongoing declines in mining investment as remaining LNG projects approached completion. Members noted that investment required to sustain capacity and recently announced expansion projects were expected to support stronger mining investment over the medium term. Declines in resource exports, partly related to supply disruptions, had also subtracted from growth in the second half of 2018. Coal exports to China had declined by 20 per cent, partly as a result of weather-related disruptions. The longer time taken for imports of coal to clear Chinese customs in recent months was also likely to have played a role. Liaison contacts had reported that they expected to continue to be able to redirect coal shipments intended for China to other destinations. Members noted that there had been some disruptions to iron ore shipments as a result of Tropical Cyclone Veronica, which were likely to have affected iron ore export volumes in March.
The ongoing effects of the drought had weighed on farm output and income in the December quarter, and rural exports had declined; farm GDP had fallen by more than 6 per cent over the second half of 2018. Based on the latest estimates from the Australian Bureau of Agricultural and Resource Economics and Sciences, farm production was expected to improve gradually in 2019/20 assuming rainfall returned to average levels. This was a more favourable outlook than had been assumed in the forecasts presented in the February Statement on Monetary Policy. However, members noted that shortages of water in the Murray-Darling Basin had been severe and that it would take significant rainfall to increase soil moisture content from current low levels in this region.
Public demand had contributed strongly to GDP growth over 2018, supported by spending on the National Disability Insurance Scheme and aged care and health services, and investment in infrastructure. Members noted that, despite this, the overall fiscal impact on the economy had been negative because of slow growth in some other forms of government expenditure and strong growth in tax revenues.
The labour market had continued to improve in early 2019, despite the slowing in growth recorded in the national accounts through 2018. Employment had increased a little in February, following strong growth in January, and the unemployment rate had declined to 4.9 per cent, continuing the run of months with an unemployment rate at or around 5 per cent. Other measures of spare capacity, including the underemployment rate and the long-term unemployment rate, had also trended downwards. The participation rate had been relatively stable at a high level over the preceding year or so.
Employment growth over the previous year had been particularly strong in the health care & social assistance, professional services and construction industries. Over the same period, employment-to-population ratios had increased further in New South Wales and Victoria, where unemployment rates had been around historically low levels. Employment-to-population ratios had declined a little in other states more recently. Forward-looking indicators of labour demand had been mixed in recent months. Job advertisements had eased, but job vacancies reported by employers through the ABS survey had increased further as a share of the labour force in February.
Financial Markets
Members commenced their discussion of financial market developments by noting that global financial conditions remained accommodative and had eased over the preceding couple of months.
Market expectations for the future path of monetary policy in a number of economies had been lowered since the beginning of the year. This was consistent with guidance from major central banks that monetary policy would remain more accommodative than earlier expected, given downward revisions to growth forecasts and little upside risk to inflation despite increasingly tight labour markets.
At its March meeting, the US Federal Open Market Committee (FOMC) had kept the federal funds rate unchanged and announced that the decline in the Federal Reserve’s asset holdings would slow from May and cease after September, which was sooner than had been expected. The FOMC also published the quarterly update of its members’ projections for where they believed the federal funds rate was likely to be in coming years. These projections implied that the federal funds rate was likely to remain unchanged throughout the rest of 2019, followed by one increase (of 25 basis points) in 2020. By contrast, at the time of the December 2018 meeting, the median FOMC projection had been for two rate increases in 2019 and one in 2020. Policy expectations implied by financial market pricing had also been revised down since December. These implied that the next move in the federal funds rate was expected to be down.
In the euro area and Japan, financial market pricing indicated that policy rates were expected to be maintained at very low levels for an extended period, in line with recent statements by the respective central banks. In March, the European Central Bank had announced that it would roll over a long-term lending program to euro area banks. In Canada, New Zealand and Australia, financial market pricing implied that declines in policy rates were expected in the coming year or so.
Members noted that 10-year government bond yields had declined noticeably across all major markets over the preceding month. In some cases, including in Australia, yields had declined to historic lows. These declines had reflected lower expected paths for monetary policy, lower term premiums and, to varying extents, lower inflation expectations. In Germany and Japan, long-term bond yields had again turned negative, approaching the lows that had been reached in 2016. In the United States, long-term rates had moved below some short-term rates for a brief period, with market commentators noting that past episodes of yield curve inversion had tended to precede recessions. At the same time, the recent decline in risk premiums in credit and equity markets suggested financial market participants did not consider a recession to be likely.
Members observed that financing conditions for corporations had improved. Corporate bond yields had moved lower, reflecting the decline in government bond yields as well as a decline in spreads following increases in late 2018. Non-financial firms had increased their bond issuance in 2019, particularly in the US dollar high-yield sector. By contrast, issuance of leveraged loans had been more subdued, which partly reflected an easing in investors’ appetites for floating rate securities in response to the lowering of policy rate expectations. Equity markets in the advanced economies had been little changed in March, having previously rebounded from their sharp fall in late 2018.
In China, equity markets had risen particularly sharply since the end of 2018, which was likely to have reflected some easing in US–China trade tensions, as well as the authorities’ stimulus measures. Growth in total social financing had increased a little in recent months, as the authorities had taken measures to encourage bond issuance. They had also encouraged banks to provide finance to smaller private firms. To support this, the authorities had signalled additional targeted monetary easing for the period ahead. These changes had followed a slowing in the growth of total social financing over the preceding year or more as the authorities had taken measures to reduce non-bank lending, which had been an important source of funding for private firms, in order to reduce overall risks in the financial system.
In other emerging markets, conditions had been relatively stable in 2019, although Argentina and Turkey had experienced renewed depreciation of their exchange rates in response to continued macro-financial and political risks in those economies.
Members noted that there had been little change in major economies’ foreign exchange markets over the preceding month. The Australian dollar had also been little changed, remaining at the lower end of its range of recent years. The strength in commodity prices and the terms of trade had been supporting the exchange rate, while the continued decline in Australian government bond yields relative to those in other major markets had been working in the opposite direction.
Growth in housing lending to owner-occupiers had slowed to 4¾ per cent in six-month-ended annualised terms, although the monthly growth rate had increased slightly in February. Growth in housing lending to investors remained at a very low level. Housing loan approvals were materially below the levels of a year earlier, but had also increased slightly in February, with the small uptick in approvals broadly based across types of borrowers. Members observed that the slowing in housing lending over the preceding year had been driven largely by weakness in demand, particularly from investors. There had also been some tightening in lending practices. Lenders continued to compete for borrowers of high credit quality by offering lower interest rates on new loans than typically paid on existing loans.
Members noted that the major banks’ funding costs had declined over the preceding couple of months. The cost of debt funding had declined as pressures had eased in short-term money markets and bank bond spreads had narrowed. Deposit rates had also continued to edge downwards.
Funding conditions for Australian businesses more broadly were accommodative. Three-year bond yields for corporations across all major sectors had declined to record lows, reflecting the decline in both government bond yields and spreads. Bond issuance by non-financial corporations in the first quarter of 2019 had been in line with that of recent years. Growth in bank lending to businesses had remained robust, in part reflecting increased lending by the major banks, although other institutions had accounted for most of the growth. Members observed that the growth in business lending had been entirely to large businesses. Meanwhile, credit conditions for some small businesses were reported to have tightened further recently.
Financial market participants’ expectations of a rate cut had been brought forward following weaker than expected data, most notably the December quarter national accounts. Financial market pricing implied that the cash rate was expected to be lowered in the second half of 2019 and then again in 2020.
Financial Stability
Members were briefed on the Bank’s regular half-yearly assessment of the financial system. Overall, members noted that financial stability risks were slightly higher than six months earlier but were not especially elevated.
Globally, investors were receiving little compensation for taking on risk. Notably, risk-free rates were very low and the term premium in the United States had briefly turned negative. Furthermore, corporate bond spreads remained low. These conditions had contributed to the significant increase in borrowing by businesses since the global financial crisis. However, members noted that debt servicing costs had not increased to the same extent, given the decline in interest rates over this period. The high prices of a range of assets in this environment meant that there was heightened risk of an abrupt repricing in response to news.
Members observed that the profitability of banks globally had generally increased. In part, this reflected above-trend economic growth in the first half of 2018. However, some European banks remained fragile, given large stocks of non-performing loans, high cost structures and overcapacity. The large stock of sovereign debt held by some European banks, along with concerns about sovereign debt sustainability, raised potential issues about the resilience of some banking systems.
In China, the authorities had taken measures to contain risks in the financial system. As a result, the pace of growth in debt had slowed to below the pace of growth in the economy. However, given the earlier rapid growth in debt, China’s ratio of non-financial debt to GDP remained higher than in other economies with comparable income and even higher than in many high-income economies. Members noted that the earlier rapid growth in debt had also raised concerns about the lending standards under which those loans had been made.
In Australia, conditions in the housing market had remained weak. Housing prices had fallen further in the capital cities and regional areas. Over the preceding six months, the falls had been largest in Sydney and Melbourne, but prices in these cities had remained more than 40 per cent higher than in 2012. Falls in housing prices had resulted in some borrowers having negative equity, where the value of their loans exceeded that of their properties. Nationally, just over 2 per cent of borrowers, accounting for less than 3 per cent of housing debt, were estimated to have negative equity. Around 90 per cent of these borrowers were in Queensland, Western Australia and the Northern Territory. Members observed that negative equity by itself was not a concern for financial stability. However, if unemployment were to rise and borrowers were not able to continue to make repayments, then financial institutions would incur increased losses. Members noted that the decline in high loan-to-valuation ratio (LVR) lending in recent years was expected to lessen any losses for lenders. In recent quarters, almost all loans to investors had LVRs less than 90 per cent. By contrast, a decade earlier only 85 per cent of loans to investors had LVRs less than 90 per cent. The share of owner-occupiers with high LVR loans had also declined.
Members noted that total household payments on housing debt as a share of income had been broadly stable in recent years. Within the total, however, an increase in scheduled principal repayments had roughly offset a fall in unscheduled principal repayments. Members noted that households’ excess payments amounted to about two-and-a-half years’ worth of scheduled repayments on average. Housing loan interest payments had increased slightly as housing debt had increased.
Banks’ assets had continued to perform well overall. Although banks’ non-performing housing loans had increased, they remained low at less than 1 per cent of their total housing lending. Members noted that the increase in housing loan arrears had been driven by loans remaining in arrears for longer, on average. Banks’ business loans had been performing well, with non-performing loan rates around their lowest levels in a decade. Banks had continued to accumulate capital, with the capital ratios of the four major banks all exceeding or close to the ‘unquestionably strong’ benchmarks set out by the Australian Prudential Regulation Authority (APRA).
The tightening in banks’ housing lending practices over recent years had been accompanied by an increase in lending by non-banks, although this was still estimated to account for less than 5 per cent of total housing credit. Members noted that, while not subject to prudential regulation by APRA, non-banks’ housing lending is subject to responsible lending obligations. The available evidence suggested that the riskiness of non-bank housing lending had not increased.
Members noted that the International Monetary Fund’s Financial Sector Assessment Program report on the Australian financial system was generally positive about the resilience of domestic financial institutions and the quality of regulatory and supervisory oversight, but made several high-level recommendations for improving current arrangements.
Considerations for Monetary Policy
In considering the stance of monetary policy, members observed that growth in the global economy had slowed over the second half of 2018 and into 2019. Trade tensions and political developments in Europe remained sources of uncertainty. At the same time, though, global financial conditions had eased in preceding months and, in China, the authorities had provided targeted stimulus to support domestic growth. In a number of economies, continued strength in labour market data and moderating GDP growth were sending different signals about the momentum in economic activity. Members noted that this was also the case in Australia. While the labour market had continued to improve in early 2019, GDP growth had slowed over 2018. Continued low growth in household disposable income and the adjustment in housing markets had weighed on household spending.
Members noted that the sustained low level of interest rates over recent years had been supporting economic activity and had contributed to progress in reducing the unemployment rate and returning inflation towards the midpoint of the target, albeit only gradually. The central scenario was for further gradual progress to be made on both unemployment and inflation. Members observed that a pick-up in growth in household disposable income was an important element of these forecasts. Given this outlook for further progress towards the Bank’s goals, members agreed that there was not a strong case for a near-term adjustment in monetary policy. Members recognised that it was not possible to fine-tune outcomes and that holding monetary policy steady would enable the Bank to be a source of stability and confidence.
Members agreed that inflation was likely to remain low for some time. Wages growth had remained low, there continued to be strong competition in the retail sector and governments had been working to ease cost of living pressures, including through their influence on administered prices. In these circumstances, members agreed that the likelihood of a scenario where the cash rate would need to be increased in the near term was low.
Members also discussed the scenario where inflation did not move any higher and unemployment trended up, noting that a decrease in the cash rate would likely be appropriate in these circumstances. They recognised that the effect on the economy of lower interest rates could be expected to be smaller than in the past, given the high level of household debt and the adjustment that was occurring in housing markets. Nevertheless, a lower level of interest rates could still be expected to support the economy through a depreciation of the exchange rate and by reducing required interest payments on borrowing, freeing up cash for other expenditure.
Taking account of the further progress expected towards the Bank’s goals, members assessed that it was appropriate to hold the cash rate steady. Looking forward, the Board will continue to monitor developments, including how the current tensions between the domestic GDP and labour market data evolve, and set monetary policy to support sustainable growth in the economy and achieve the inflation target over time.
The Decision
The Board decided to leave the cash rate unchanged at 1.5 per cent.
Housing Price Falls and Negative Equity
The RBA released their Financial Stability report today, and even with the rose tinted RBA glasses there are a number of worrying issues touched on. Though none new. But their analysis of negative equity is over optimistic. So we will look at what they say, and highlight some additional considerations.
The RBA said:
Domestic economic conditions remain broadly supportive of financial stability. The unemployment rate has remained around 5 per cent since the previous Review and corporate profit growth has also been strong.
However, GDP growth in Australia also slowed in the second half of 2018. In particular, consumption growth eased and the outlook for consumption is uncertain.
Conditions in the housing market remain weak. Nationally, housing prices are 7 per cent below their late 2017 peak, although they are still almost 30 per cent higher since the start of 2013.
Growth in housing credit was slightly lower over the six months to February than the preceding half year, with investor credit hardly growing at all.
Nationally, falling housing prices have been driven by weaker demand and increased housing supply. The tightening in the supply of housing credit from improved lending standards has played a smaller part. Importantly, these more rigorous lending standards have seen the quality of new loans improve in recent years.
Measures of financial stress among households are generally low and households remain well placed to service their debt given low unemployment, low interest rates and improvements to lending standards. However, there has been an increase in housing loan arrears rates. The increase in arrears has been largest in Western Australia, where the decline in mining related activity has seen housing prices fall for nearly five years and unemployment increase.
They did in “deep dive” on negative equity using their securitised loan data.
Large housing price falls in parts of Australia mean some borrowers are facing negative equity – where the outstanding balance on the loan exceeds the value of the property it is secured against. Negative equity creates vulnerabilities both for borrowers and lenders. A borrower having difficulty making loan repayments who has negative equity cannot fully repay their debt by selling the property. Negative equity also implies that banks are likely to bear losses in the event that a borrower defaults. Evidence from Australia and abroad suggests that borrowers who experience an unexpected fall in income are more likely to default if their loan is in negative equity.
At present, the incidence of negative equity remains low. Given the large increases in housing prices that preceded recent falls and the decline
in the share of mortgages issued with high loan to- valuation ratios (LVRs), housing prices would need to fall significantly further for negative equity to become widespread. However, even if this did occur, increased defaults would be unlikely if the unemployment rate remains low, particularly given the improvements in loan serviceability standards over recent years.
Estimating the share of borrowers with negative equity requires data on current loan balances and property values. The RBA’s Securitisation Dataset
contains the most extensive and timely data on loan balances and purchase prices.
The Securitisation Dataset includes about one-quarter of the value of
all residential mortgages, or around 1.7 million mortgages.
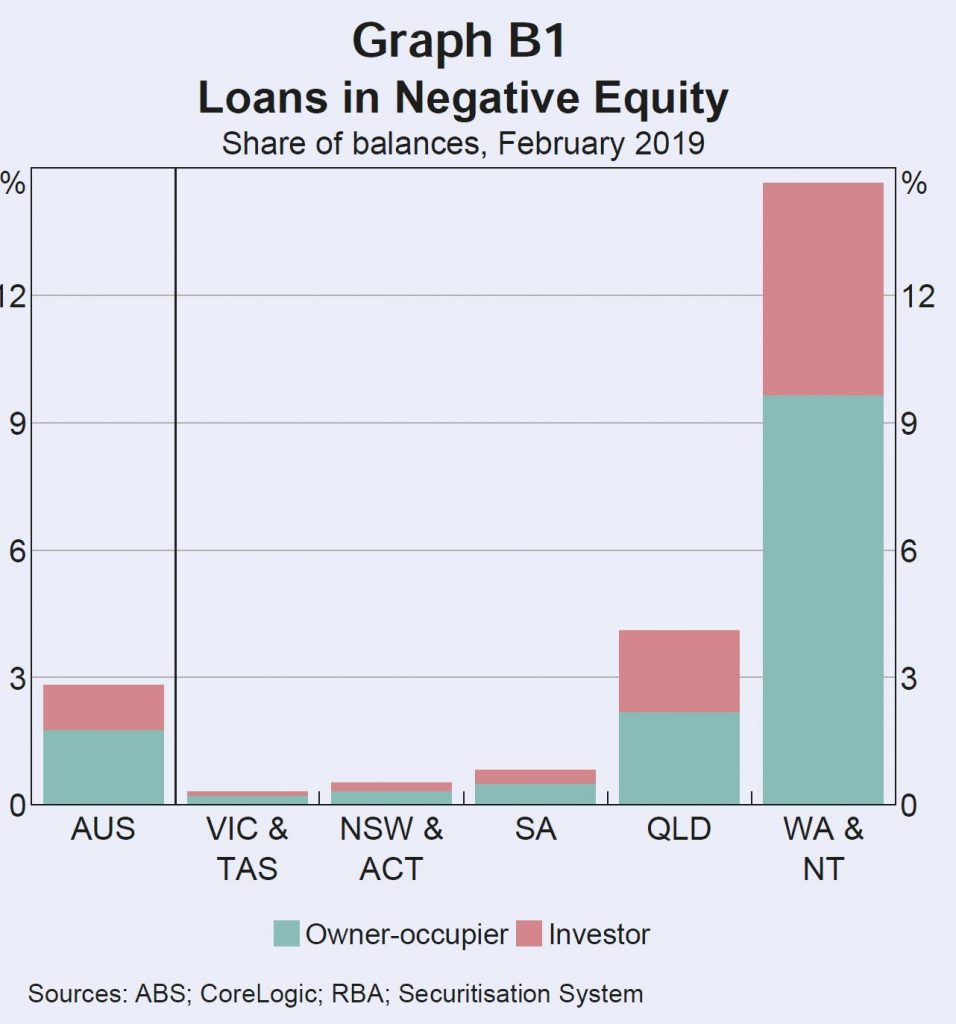
This data can be combined with regional data on housing price movements to estimate the share of loans that are currently in negative equity. This
suggests that nationally, around 2¾ per cent of securitised loans by value are in negative equity (just over 2 per cent of borrowers). The highest
rates of negative equity are in Western Australia, the Northern Territory and Queensland, where there have been large price falls in areas with
high exposure to mining activity. Almost 60 per cent of loans in with negative equity are in Western Australia or the Northern Territory. Rates
of negative equity in other states remain very low.
Estimates of negative equity from the Securitisation Dataset may, however, be under or overstated. They could be understated because securitised loans are skewed towards those with lower LVRs at origination. In contrast, the higher prevalence of newer loans in the dataset compared to the broader population of loans, and not being able to take into account capital improvements on values, will work in the other direction. Some private surveys estimate closer to 10 per cent of mortgage holders are in negative equity. However, these surveys are likely to be an overestimate for a number
of reasons; for instance, by not accounting for offset account balances.
DFA Says: Of course DFA estimates 10% of households in negative equity, after taking offset balances into account, and also adding in the current forced sale value of the property and transaction costs.
Information from bank liaison and estimates based on 2017 data from the Household Incomes and Labour Dynamics of Australia (HILDA) survey suggest rates of negative equity are broadly in line with those from the
Securitisation Dataset.
DFA Says: The HILDA data is at least 2 years old, so before the recent price falls – so this set will understate the current position.
The continuing low rates of negative equity outside the mining exposed regions reflect three main factors: the previous substantial increases in housing prices; the low share of housing loans written at high LVRs; and the fact that many households are ahead on their loans, having accumulated extra principal payments.
Housing prices in some areas of Sydney and Melbourne have fallen by upwards of 20 per cent from their peak in mid to late 2017. But only a small share of owners purchased at peak prices, and many others experienced
price rises before property prices began to fall. Properties purchased in Sydney and Melbourne since prices peaked account for around 2 per cent of the national dwelling stock. Looking further back, properties purchased in these two cities since prices were last at current levels still only account for
around 4½ per cent of the dwelling stock.
Few recent borrowers had high starting LVRs. Over the past five years, the share of loans issued by ADIs with LVRs above 90 has roughly halved. Since 2017, it has averaged less than 7 per cent (Graph B2). Around 80 per cent of ADI loans are issued with an LVR of 80 or less. Around 15 per cent of owner-occupier borrowers and 20 per cent of investors take out a loan with a starting LVR of exactly 80.
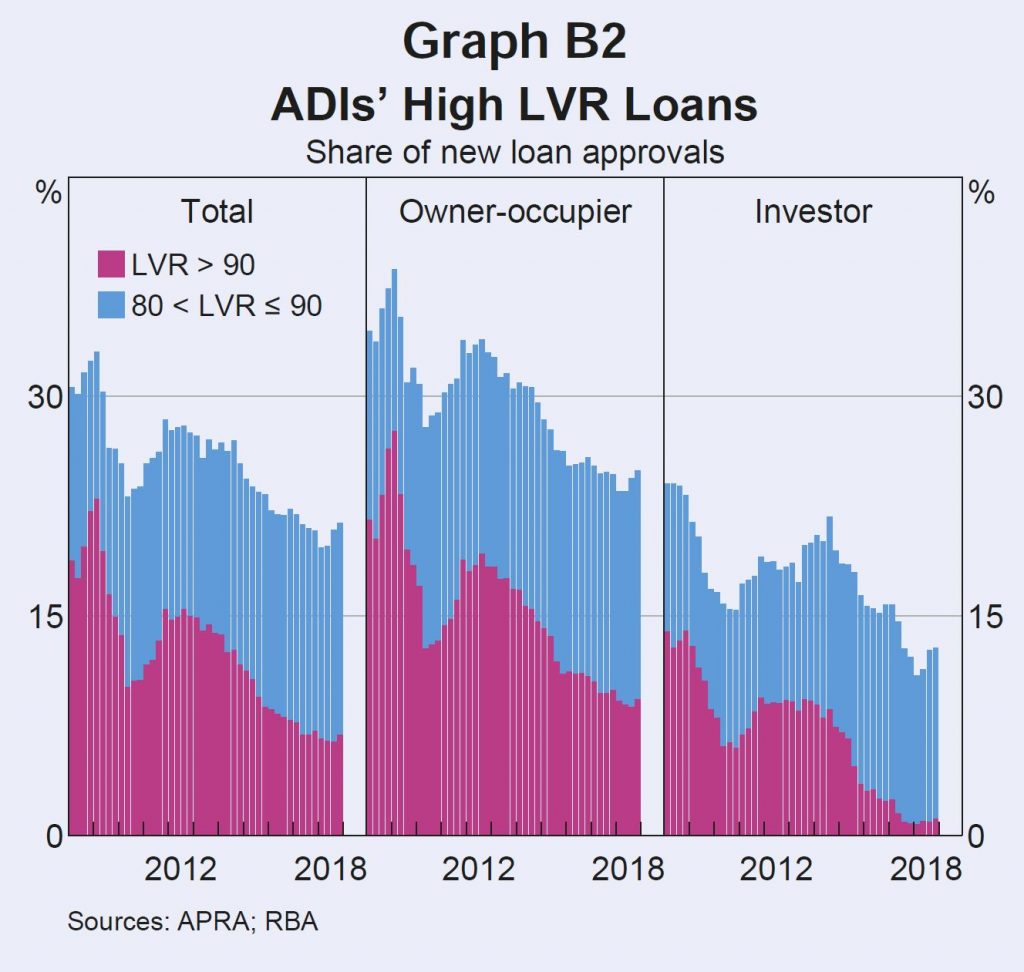
Given most borrowers do not have high starting LVRs, housing price falls need to be large for widespread negative equity. Only 15 per cent of regions have experienced price declines of 20 per cent or more from their peaks. Around 90 per cent of these regions are in Western Australia, Queensland and the Northern Territory.
If a borrower has paid off some of their debt, then price declines will need to be larger still for them to be in negative equity. Most borrowers have principal and interest loans that require them to pay down their debt and
many borrowers are ahead of their repayment schedule. Around 70 per cent of loans are estimated to be at least one month ahead of their repayment schedule, with around 30 per cent ahead by two years or more.
When a borrower is behind on repayments and their loan is in negative equity, banks classify the loan as ‘impaired’. Banks are required to raise provisions against potential losses from impaired loans through ‘bad
and doubtful debt’ charges. Currently the proportion of impaired housing loans is very low, at 0.2 per cent of all residential mortgages, despite having increased of late (Graph B3).
Queensland, Western Australia and the Northern Territory together account for around 90 per cent of all mortgage debt in negative equity. These states have regions that experienced large and persistent housing price falls over several years.
This has often been coupled with low income growth and increases in unemployment, which have reduced the ability of borrowers to pay
down their loans. Loans currently in negative equity were, on average, taken out around five years ago and had higher average LVRs at origination,
of around 85 per cent. This made them particularly susceptible to subsequent falls in property values. Investment loans are also disproportionately represented, despite typically having lower starting LVRs than owner-occupier loans. Investors are more likely to take out
interest-only loans in order to keep their loan balance high for tax purposes. Around 10 per cent of loans in negative equity have interest only
terms expiring in 2019, which is double the share for loans in positive equity. For these borrowers, the increase in repayments from moving to principal and interest may be difficult to manage, especially as loans in negative equity are already more likely to be in arrears. Having more borrowers in this scenario is distressing for the borrowers themselves and for the communities they live in. However, it is unlikely to represent a risk to broader financial stability given it remains largely restricted to mining-exposed regions, which represent a very small share of total mortgage debt.
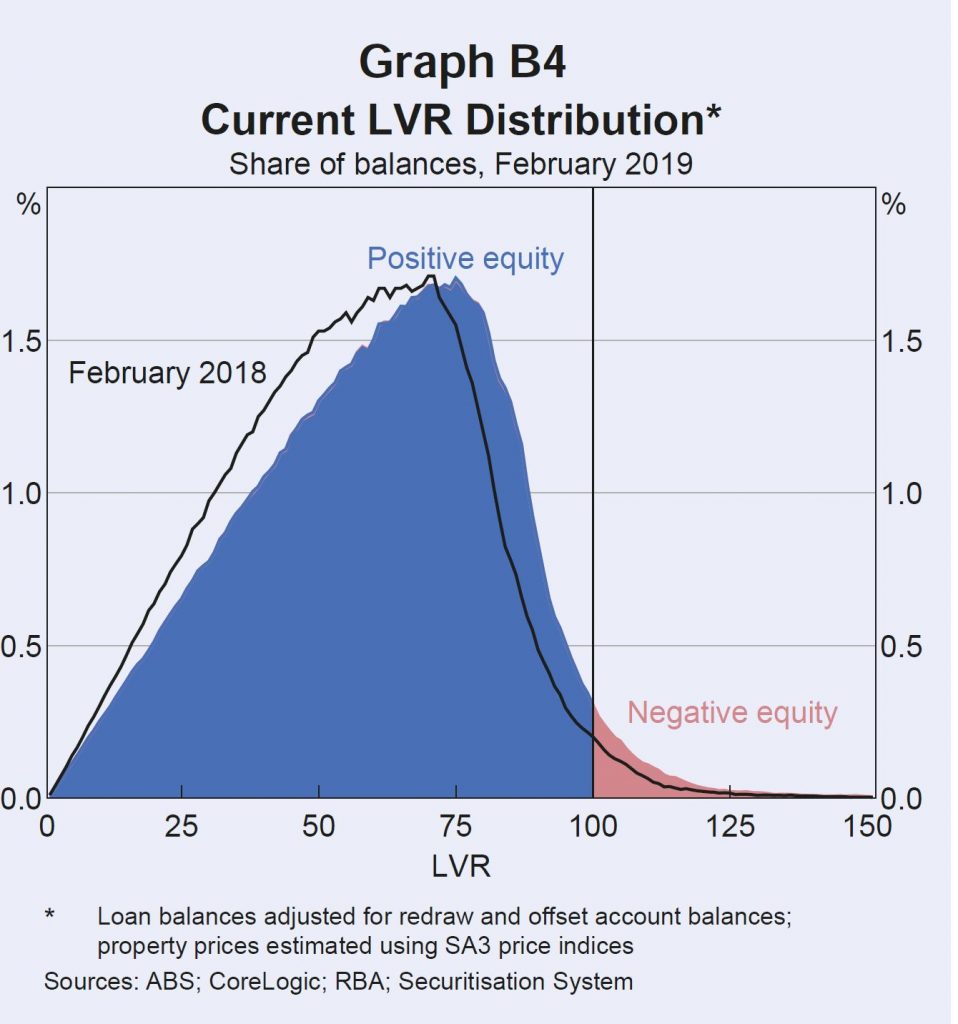
Continued housing price falls would be expected to increase the incidence of negative equity, particularly if they affect borrowers with already high LVRs. Around 11/4 per cent of loans by number (and 13/4 per cent of loans by value) have a current LVR between 95 and 100, making them likely to move into negative equity if there are further housing price falls (Graph B4).
However, compared to the international experience with negative equity during large property downturns, the incidence of negative equity in
Australia is likely to remain low. Negative equity peaked in the United States at over 25 per cent of mortgaged properties in 2012 and in Ireland
it exceeded 35 per cent, as peak to trough price falls exceeded 30 and 50 per cent respectively.
However, high origination LVRs were far more common in these countries than they have been in Australia.
DFA Says: Except we know there were high levels of mortgage fraud and incorrect data supporting loan applications. Higher than in Ireland.
Even if negative equity was to become more common in the larger housing markets of Sydney and Melbourne, impairment rates for banks are unlikely to increase significantly while unemployment and interest rates remain low.
DFA Says: you need to get post code granular to see what is going on. As our earlier heat map showed.
Taking Our Economic Pulse
We review the data from the RBA’s latest chart pack.
The Never-ending Rivers Of Debt
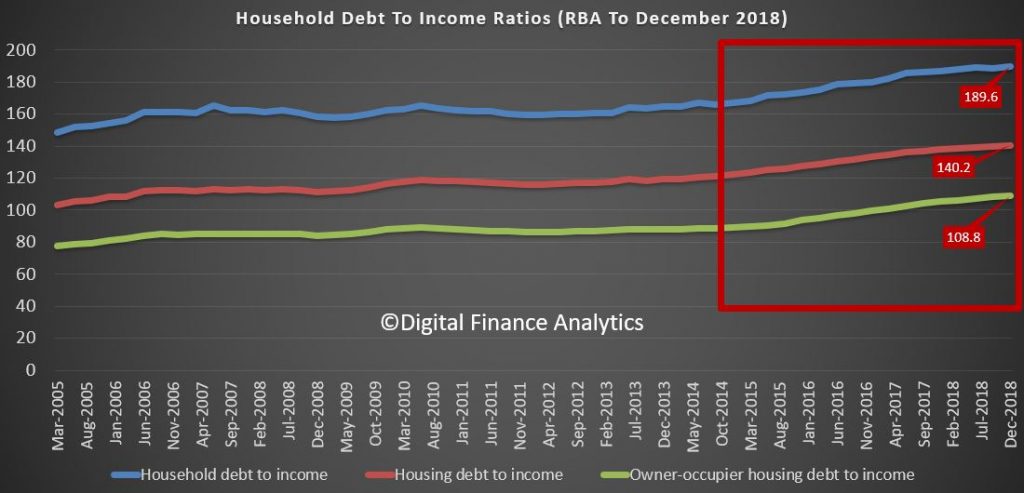
In the latest RBA data series (E2) we get an update on household debt to income and debt to asset ratios, and they are ALL moving in the wrong direction. This is to December 2018.
The household debt to income moved higher to a new record of 189.6, and housing debt to income to a new record of 140.2.
The change in trajectory from 2014/5 is significant, as lending standards were weakened, and interest rates cut (forcing home prices higher).
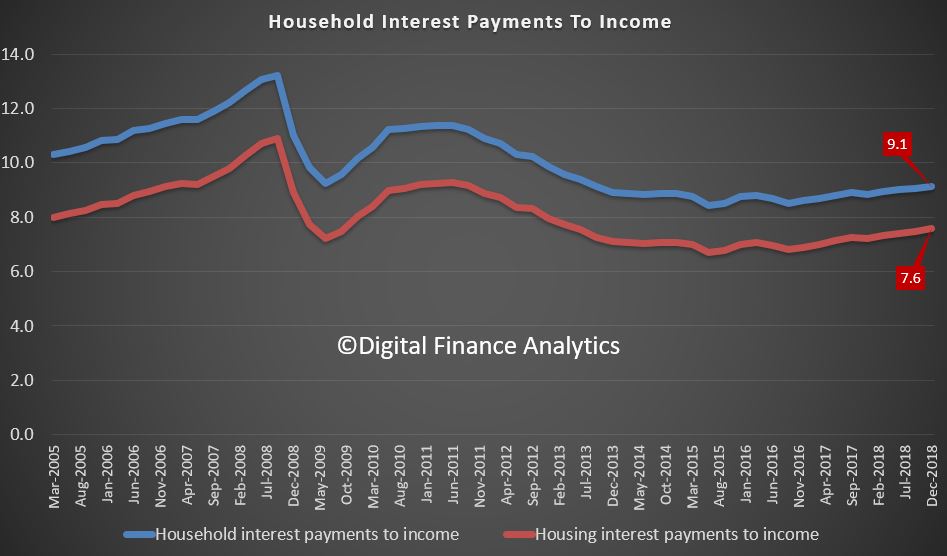
The interest payments to income also rose, thanks to bigger mortgages, slightly higher interest rates, and little income growth.
But in contrast, the asset values are falling, so the asset to income ratios are falling. Housing assets in particular are dropping.
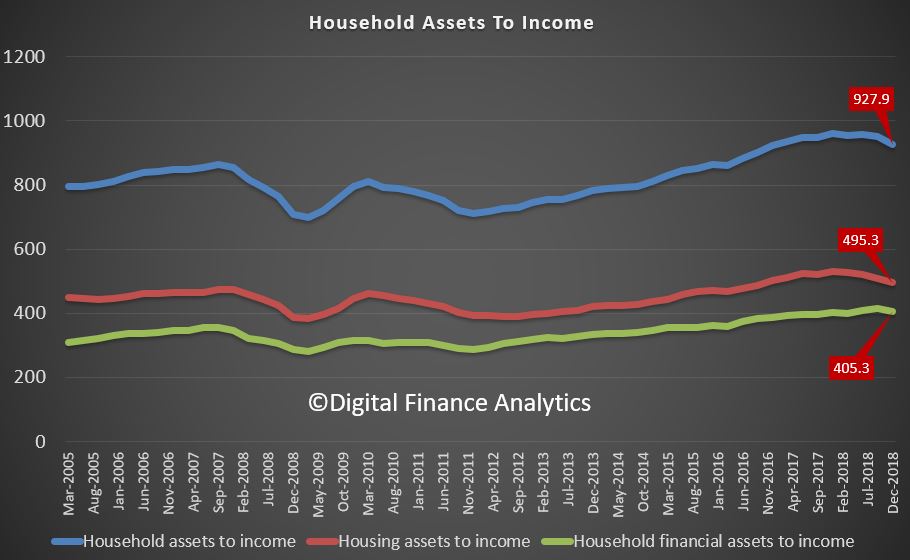
All pointing to a higher burden of debt on households. And remember only one third, or there about, have a mortgage, so in fact the TRUE ratios are much much worst. But the trends do not lie in relative terms, and by the way these are extended ratios compared with most western economies. We are drowning in rivers of debt!
Non Banks Bloom As Credit Impulse Slows Again
The February data from APRA for ADI’s and the credit aggregates from the RBA were released today. The headline news is the rate of housing credit growth continued to slow.
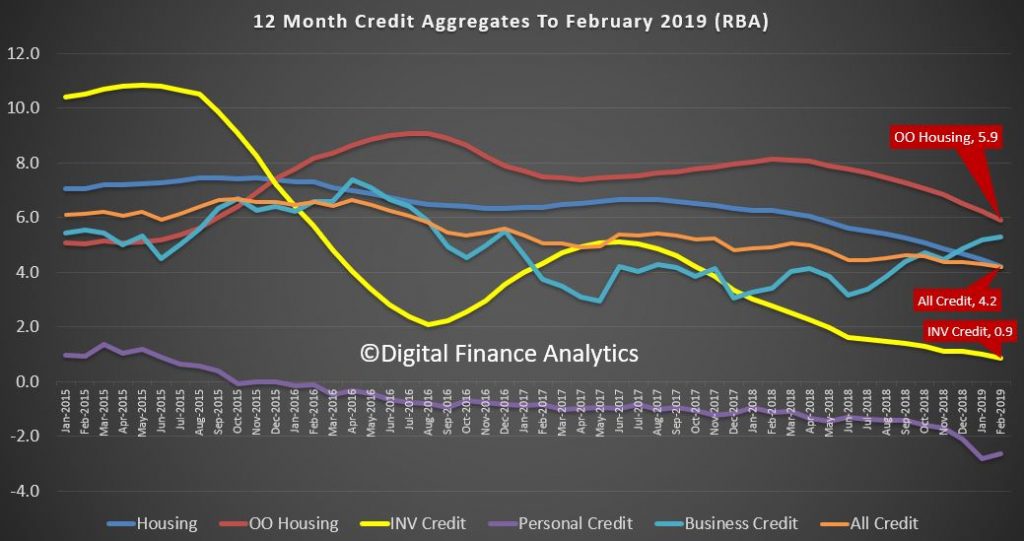
This is quite starkly shown in the RBA’s 12 month series, with total credit annualised growth now standing at 4.2%. Housing credit also fell to the same 4.2% level, from 4.4% a month ago. The fall continues. Within the housing series, lending for owner occupation fell below 6% – down to 5.9% and investment housing lending fell to 0.9% annualised.
The seasonally adjusted RBA data showed that last month total credit for housing grew by 0.31%, up $5.6 billion to $1.81 trillion, another record. Within in that owner occupied lending stock rose 0.42%, seasonally adjusted to $1.22 trillion, up $5.11 billion. Lending for investment property rose 0.09%, or $0.5 billion to $595 billion. Personal credit fell slightly, down 0.07% and business credit rose 0.42% to $960 billion, up $4.06 billion.
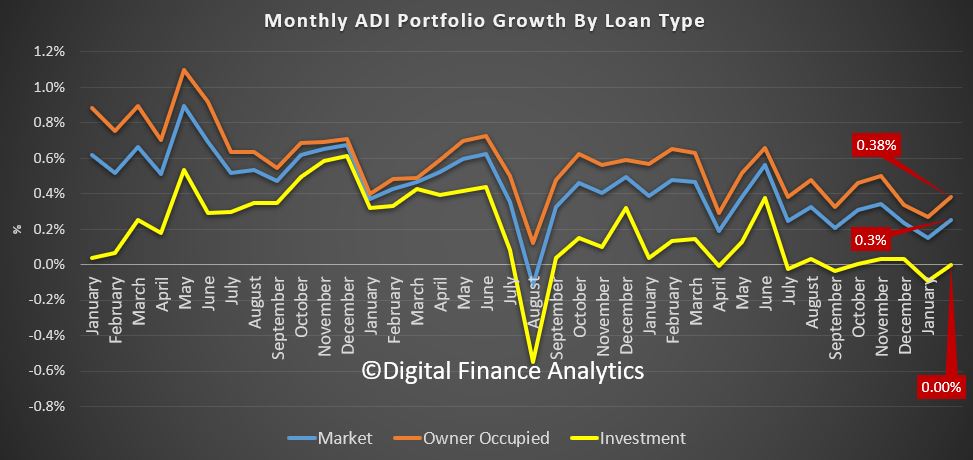
The APRA data revealed that ADI growth was lower than the RBA aggregates. Some of this relates to seasonal adjustments plus, as we will see a rise in non-bank lending. The proportion of investment loans less again to 33.3% of loans outstanding.
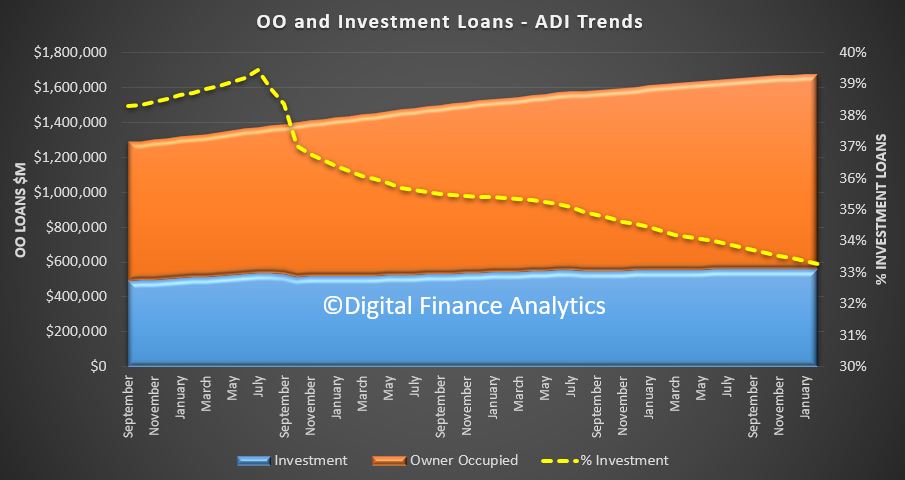
Total owner occupied loans were $1.11 trillion, up 0.38%, or $4.2 billion, while investor loans were $557 billion, flat compared with last month. This shows the trends month on month, with a slight uptick in February compared to January, as holidays end and the property market spluttered back to life. The next couple of months will be interesting as we watch for a post-Hayne bounce in lending and more loosening of the credit taps, but into a market where demand, is at best anemic.
The portfolio movements are interesting (to the extent the data is reported accurately!), with HSBC growing its footprint by more that one billion across both investor and owner occupied lending. Only Westpac, among the big four grew their investor loans, with ANZ reporting a significant slide (no surprise they said they had gone too conservative, and recently introduce a 10-year interest only investor loan). Macquarie and Members Equity grew their books, with the focus on owner occupied loans.
The overall portfolios did not vary that much, with CBA still the largest owner occupied lender, and Westpac the largest investor lender.
The 12 month investor tracker whilst obsolete in one sense as APRA has removed their focus on a 10% speed limit, is significant, in that the market is now at 0.6% annualised.
But the final part of the story is the non-bank lending. This has to be derived, and we know the RBA data is suspect and delayed. But the gap between the RBA and APRA data shows the trends.
Non Bank annualised owner occupied credit is growing at 17.6%, and investor lending at 4.8%. It is clear the non-banks, with their weaker capital requirements, and greater funding flexibility are making hay. Total non bank credit for housing is now around $142 billion or around 7.8% of housing lending. This ratio has been rising since December 2016, and kicked up in line with the tighter APRA rules being applied to the banks.
We have out doubts that APRA is looking hard enough at these lending pools, especially as we are seeing the rise of higher risk “near-prime” offers to borrowers who cannot get loans from the banks.
So to conclude the rate of credit momentum continues to ease – signalling more home prices ahead. The non-banks sector, currently loosely regulated by APRA is growing fast, and just the before the US falls around the GFC, risks are higher here. And finally, and worryingly, household debt is STILL growing… so more stress and financial pressure ahead.
Household Finances According To The RBA
RBA’s Luci Ellis, Assistant Governor (Economic) spoke yesterday “What’s Up (and Down) With Households?“. We examined the conundrum that labour markets are strong, yet the economy is weaker. The disconnect is the household sector – which of course DFA examines closely in our surveys.
One of the most interesting comments relates to household spending slowing, especially on cars and household goods. We regard this as an important indicator. Income of course is under pressure in real terms, costs are rising, and home prices are falling. Households are hunkering down. As the RBA says ” at some point they might conclude that this is not temporary and that low income growth will persist. At that point they would be likely to adjust their spending plans. Consumption growth would then slow“.
This is what she said:
For a little while now, the team at the Bank has been grappling with how one might reconcile apparently weak national accounts figures with the noticeably stronger labour market data.
The disconnect can be traced to the household sector. Many other parts of the national accounts measure of output – gross domestic product (GDP) – are actually doing reasonably well. Outside the mining sector, where some large projects are still winding down, business investment is growing at a solid pace. Transport and renewable energy projects have been quite important. Public demand, both consumption and investment, is supporting growth.
There are also some areas of weakness outside the household sector, such as the drought-affected rural sector, which is weighing on exports at the moment. Droughts and other recent natural disasters clearly pose difficulties for those directly affected. But the underlying trends in the broader economy are not determined by these events. So in the main, outside the household sector, the economy is not doing too badly.
The Labour Market has Unambiguously Improved
This makes sense, because employment has been strong and someone must be hiring all those extra workers. Over the past year, total employment has increased by more than 2 per cent. The unemployment rate declined by ½ percentage point over 2018, reaching the level of 5 per cent before our forecasts implied it would (Graph 1). This is a good outcome. Youth unemployment has declined and most measures of underemployment have also come down a bit.
Some industries are doing better than others, but overall the strength in employment has been across a diverse range of sectors (Graph 2). We can see this either by looking at the industry that people say they work in, or we can use the ABS’s new Labour Account to triangulate this information with what firms say their industry is. Either way, we see jobs being added in a range of industries. Employment in health care and social assistance has been increasing for a while; the rollout of the NDIS is an important driver of this, but not the only one. More recently, we have also seen employment increase in a number of business services industries. Construction employment had also been strong for a while, reaching the highest share of total employment in more than a century of records.
One can be reasonably confident in the steer the labour market data are giving us, because it is coming from multiple, independently collected data sets. The employment and unemployment data come from the ABS’s survey of households. But a survey of businesses, also from the ABS, tells us that the number of job vacancies has been a very high share of the total jobs available. Separate private-sector surveys of businesses tell us that many firms plan to hire more workers. Many of our own liaison contacts also tell us that they are hiring.
And as the labour market gradually tightens, we are beginning to see the effects in wages growth. This has been low for some time, but is gradually trending up now, especially in the private sector (Graph 3). Part of this shift is that fewer workers are subject to wage freezes than was the case a year or so ago. Minimum and award wage rises have also increased. Along with other countries, it’s taking longer and a lower unemployment rate to start seeing faster wages growth than historical experience might have suggested. Indeed, we still think Australia is a little way off the levels of the unemployment rate that would induce materially faster wages growth. But as the experience of other countries has also shown, if the labour market tightens enough, wages growth does eventually pick up.
Household Consumption Spending is Slowing
In contrast to the positive picture implied by the labour market, growth in household income has been slow, and growth in consumption has weakened recently (Graph 4).
If we drill down to see which kinds of spending have slowed the most, we can see that spending on cars and household goods has been particularly affected (Graph 5). Spending on less discretionary items like food has been less affected.
There has been a deal of talk about the possibility that ‘wealth effects’ from declining housing prices might be weighing on spending. It’s important to remember, though, that people’s reaction to a fall in prices is likely to depend partly on how far prices had increased previously.
Some recent work by colleagues at the Bank suggests that the link is a bit more subtle than simply that increases in wealth boost spending directly (May, Nodari and Rees 2019). It isn’t so much that people wake up one morning, realise their home is worth more, and decide to go out shopping. Rather, if their home is worth more, they can borrow more against it, which matters for some people’s decisions to buy a car. And because rising housing prices usually occur in the context of high rates of transactions in the market, spending on home furnishings tends to rise and fall with housing prices. So when housing prices decline, turnover also declines. This means there are fewer people moving house and realising their old couch doesn’t fit or they need new furnishings in the extra bedroom.
Slow Income Growth is a Drag on Household Spending
Beyond this specific link to housing turnover, some slowdown in consumption spending is not entirely unexpected. For several years now, we have been calling out the issue of weak income growth and how it might test the resilience of household consumption spending. This is a particular issue in the context of high household debt and the need to service that debt.
One aspect of economic theory that actually works in practice is the observation that people try to smooth their consumption in the face of fluctuating incomes. Income growth is noticeably more volatile than consumption growth. So the usual pattern is that gaps between the two resolve with shifts in income growth, not shifts in consumption growth.
But there might be limits to how long households can continue expanding their consumption faster than their income is rising. People are still saving, and they can do so at a slower rate. But at some point they might conclude that this is not temporary and that low income growth will persist. At that point they would be likely to adjust their spending plans. Consumption growth would then slow.
So we need to establish how household income growth might indeed return back towards current rates of consumption growth or even higher. To do that, we need to understand why it has been so weak.
Labour Income Growth Has Recovered Somewhat
For some time, part of the story had been that labour income growth was weak. This has been true across several dimensions. First, the growth of wage rates for particular jobs has been slow (Graph 6). This is the measure of wages growth captured by the ABS’s Wage Price Index (WPI). It captures changes in wages paid for a fixed pool of jobs. As I already mentioned, growth in this measure has started increasing, though only gradually. It is still well below what one might expect in the longer run, if inflation is to average between 2 and 3 per cent and if productivity maintains a similar average growth rate to its average over the past decade or so.
People’s actual incomes include bonuses and other non-wage labour income, and average labour income depends on whether the mix of jobs in the economy is changing. For a number of years, these factors combined to make average earnings per hour, as recorded in the national accounts, increase much more slowly than the mix-adjusted WPI measure. It isn’t unusual for growth in this measure of earnings to differ from growth in the WPI. They are compiled on different bases. But in the years following the end of the mining investment boom, this gap was persistently negative, and quite large.
Some of the compositional change might have been because people were moving out of higher-paid jobs in mining-related activity, and had gone back to lower-paying work. It’s hard to pinpoint how important this effect was, because the weakness in average earnings growth was seen in some industry-level data as well. So at least some people would have had to be switching to lower-paid jobs in the same industry. Another factor that might have been at work was that fewer people were actually switching jobs than in the past. Surveys that track people through time, such as the HILDA survey, show that people who change jobs often see faster income growth in the year they switched, than people who didn’t change jobs (Graph 7).
This lower rate of job churn accords with some of the evidence we see in business surveys and the messages coming out of our business liaison program. Many firms report that they find it hard to find suitable labour, at least for some roles, and that this is a constraint on their businesses, though usually not a major one (Graph 8). But when we ask our contacts what they are doing about this problem, paying people more is not the first solution they think of. Even poaching someone from another firm by enticing them with higher pay is not that common. The evidence from our liaison program suggests that it has long been the case that firms first resort to other strategies to deal with labour shortages, and only turn to faster wage increases when the shortages are severe and persistent (Leal 2019).
But whatever the underlying drivers, the gap between the growth rates of the WPI and average earnings has closed more recently. Slow wages growth is still a concern, but in terms of its contribution to income growth, it is less of a puzzle than it was a few years ago. Instead we need to seek the source of the more recent weakness elsewhere.
Non-Labour Income Remains Weak
If we break household disposable income growth into its components, we can see the drivers of the more recent weakness (Graph 9). Labour income is not especially strong, but it no longer seems at odds with growth in employment and other information about wages growth. Rather, growth in other sources of income has been weak for some time, and this has continued more recently.
Within non-labour income, the main components are social assistance, rental income, other investment income, and the earnings of unincorporated businesses. It turns out that a confluence of factors has resulted in growth in most of these categories of income being weak recently. In some cases, this is a trend change that is likely to persist. Some others are driven by shorter-term factors that could reverse in coming years.
Social assistance payments have been relatively flat for a number of years (Graph 10). As the labour market has strengthened and unemployment has come down, it is not surprising that some forms of social assistance have not been growing. But there are a few other things going on at the same time. Firstly, the rate of growth of age pension payments has slowed, though it is still positive. There are a number of probable drivers of this, including the increase in the eligibility age, as well as more people above the (higher) eligibility age remaining in the workforce rather than drawing a pension. It is also possible that, as time goes on and the people who are retiring have had longer to accumulate superannuation balances, more people are receiving a part-pension together with an income stream from their superannuation.
Secondly, in recent years, growth in social welfare spending by the government has come from new programs (like the NDIS) that are counted as government consumption, not household income, in the national accounts. So while both disability payments and other payments to families with children have been broadly constant in dollar terms for several years, government consumption has been growing strongly over the same period. If we adjusted for this, the growth in the social assistance component of household income would look much closer to its average over the past, rather than well below average.
These factors all relate to the design of programs assisting households, and how they are classified in the national accounts. So we would not expect them to reverse all of a sudden. This implies that we should also not expect that measured household income from this source will bounce back strongly any time soon.
Rental income has also been a bit weak (Graph 11). This is not surprising considering that rents have been rising only slowly in most cities, and falling for a few years in Perth. But rental income is only earned by 15 per cent of taxpayers, and lower cash rental income for landlords is also lower rent paid by renters, leaving them with more money to pay for other things.[1] So the weakness in rental income is unlikely to be a large driver of any slowdown in consumer spending. Income from other kinds of investments has also been a bit weak, but has recovered a bit lately.
Unincorporated business income has also been weak of late. This can be a volatile type of income and sensitive to conditions in particular sectors. The farm sector represents a large share of unincorporated business income, compared with their share of the economy. So one reason this type of income has fallen has been the effect of the drought on farm incomes. A recovery here will depend on how soon normal seasonal conditions return. Much of the rest of unincorporated business income comes from sectors related to the property market, including building tradespeople and real estate agents. They are also seeing lower incomes, as both construction activity and the volume of sales of existing homes decline. Again, it can be envisaged that these sources of income might recover at some point, but not in the very near term.
Tax and Other Payments are Dragging on Disposable Income
When we think about household income available for consumption and saving, economists usually talk about household disposable income. This is income net of taxes, net interest payments and a few other deductions like insurance premiums. Income payable – the things deducted from gross income to calculate disposable income – increased by nearly 6 per cent in 2018. This was significantly faster than growth in gross household income.
Despite the relatively weak picture for household income growth, the tax revenue collected from households has grown solidly in recent years. It’s normal for growth in tax revenue to outpace income growth a bit: that is how a progressive tax system works. A useful rule of thumb is that, in the absence of adjustments to tax brackets to allow for bracket creep, for every one percentage point of growth in household income, taxes paid by households will on average increase by about 1.4 percentage points. That’s an on-average figure, though. The actual ratio can vary quite a bit.
In the past year, taxes paid by households increased by around 8 per cent, more than double the rate of growth in gross household income of 3½ per cent. So the ratio is more like a bit over two-to-one at the moment, rather than 1.4 to one. That is at the high end of the range this ratio reaches, but as this graph shows, it is not unprecedented (Graph 12). But this effect has cumulated over time, so that the share of income that is paid in tax has been rising (Graph 12, bottom panel).
What is noteworthy is that for all of the past six years, growth in tax paid has exceeded income growth by an above-average margin, at a time when income growth itself has been slow (Graph 13).
There are likely to be several things going on here. Aside from the usual bracket creep, some deductions and offsets have declined, boosting the overall tax take. Interest rates on investment property loans are now higher than for owner-occupiers, but overall the interest rate structure on mortgages is lower than it was a few years ago. So landlords will have lower tax deductions for interest payments on loans on investment properties. At the same time, the significant run-up in housing prices in some cities over the past decade will have increased the capital gains tax liability paid by investors selling a property. Turnover in the housing market has declined. But as best we can tell, the price effect has dominated the effect of declining volumes, and total capital gains tax paid has increased.
Compliance efforts and technological progress in tax collection have boosted revenue collected from a given income. The Tax Office reports that its efforts to raise compliance around work-related deductions have boosted revenue noticeably (Jordan 2019). The next wave of this effort, focused on deductions related to rental properties, could result in further boosts to revenue.
Some of these drivers boosting tax paid could persist for a while, but they aren’t permanent. For example, the earlier period of strong housing price growth will only increase capital gains tax revenue if the asset was owned during that period. It can be expected to become less important, the further into history it passes. Similarly, increased compliance increases the level of tax paid on a given level of income. It is not a change in the trend growth rate in tax paid. That said, the effect could last for a while as efforts shift to different aspects of compliance.
Some Recent Policy Changes Might Mitigate the Drag on Consumption
The net of all these effects is that household income growth has remained slow even as labour market conditions have been improving. Unlike slow wages growth, though, it is less clear how much weak non-labour income growth will weigh on consumer spending. As I already noted, slow growth in rental income for landlords means that tenants have more money to spend on other things. Some of the weakness in social assistance payments is because new programs are being delivered differently from existing ones, and so they are classified as government consumption. The net benefit to the recipients could be the same or higher.
So there might be reasons to think that weak non-labour income growth is less worrisome than weak wages growth. But you would not want to rely on that possibility to underpin your views on the outlook for consumption. So this is an area we need to watch closely. Household consumption spending is a large part of economic activity. A significant retrenchment there would lower growth and feed back into a weaker labour market, as well as into decisions to purchase housing.
Parting Thoughts
My talk today has deliberately not overlapped with what the Bank has recently said about the housing market. But I think it’s clear that conditions in the household sector more broadly are highly consequential for the housing sector and thus this audience. Whatever other forces might be affecting housing market developments, fundamentally demand for housing rests on the household sector’s confidence and capacity to take on the financial commitments involved in the purchase or rental of a home. Without enough income, and so without a strong labour market, that confidence and capacity would be in doubt. This is not the only reason we are watching labour market developments closely. But the nexus between labour markets, households and housing are crucial to our assessment of the broader outlook.
Thank you for your time.
Adams/North: It’s Too Late – Bail-In Has Already Happened!
Economist John Adams and Analyst Martin North discuss the latest on Deposit Bail-In and John reveals its all been done before.