ANZ ” to prudently increase volumes in the investor space”

ANZ today released its scheduled APRA APS330 report covering the quarter to 31 December 2018. Credit Quality remains stable with a Provision Charge of $156 million tracking below the FY2018 quarterly average.
The Group loss rate was 10 basis points1 (14 bps 1Q18). Group Common Equity Tier 1 (CET1) was 11.3% at the end of the quarter.Consistent with usual practice, ANZ also released a chart pack to accompany the Pillar 3 disclosure.

The chart pack once again includes an update on Australian housing mortgage flows and credit quality. Australia home loan system growth was 4.2%2 in the 12 months to end December 2018. ANZ’s Australian home loan portfolio grew 1.0% ($2.7 billion) in the same period with the Owner Occupier portfolio up 3.5% ($6.1billion) and the Investor portfolio down 3.8% ($3.2 billion). In the 12 months to the end of January 2019, ANZ’s home loan portfolio grew 0.4%.

ANZ’s home lending growth trends are attributable to lower system growth, ANZ’s preference for Owner Occupier/Principal and Interest lending which drives faster amortisation, together with policy and process changes implemented in the second half of calendar year 2018.

ANZ Chief Executive Officer Shayne Elliott said: “Consumer sentiment has remained generally subdued with uncertainty around regulation and house prices impacting confidence. While we are maintaining our focus on the Owner Occupier segment, we acknowledge we may have been overly conservative in our implementation of some policy and process changes. We are also taking steps to prudently increase volumes in the investor space”.

Switching volumes for those moving from Interest Only to Principal and Interest during the quarter was $6 billion, of which $4 billion was contractual. The total amount of contractual switching scheduled for the reminder of FY19 is $12 billion. Customers choosing to convert ahead of schedule during the first quarter was in line with the quarterly average for FY18 ($2 billion). Total switching in FY18 was $24 billion.

A Quick Reminder And Some More Updates

We discuss the latest data from Westpac and Bank of Queensland, look at off the plan building and consider financial advice versus general advice in the ASIC case.

Plus a quick reminder of tomorrows live streaming event where we update our scenarios.

Feb 2019: https://youtu.be/BNrTHJ2MWjo

Mortgage Delinquencies Higher At Westpac

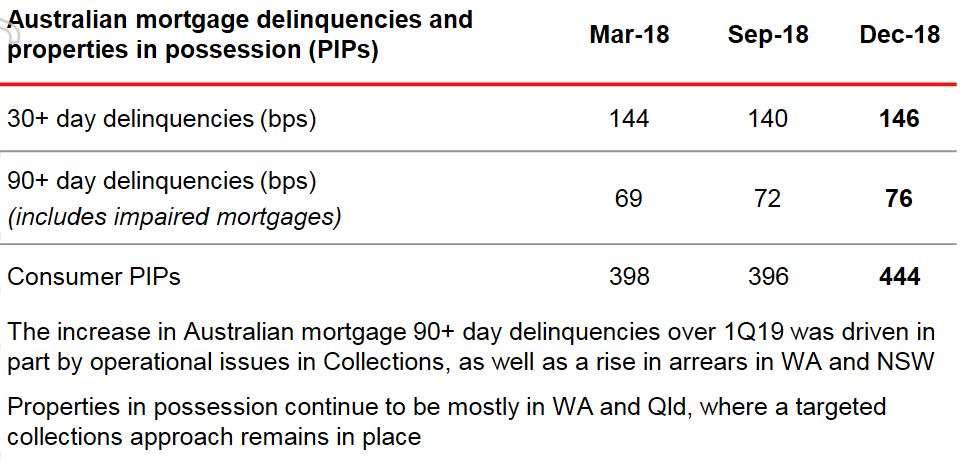
Westpac released their Pillar 3 report for December 2018, plus data on asset quality funding and capital. Of most interest to me was their mortgage data, which shows loan volume growth slowing, and rising delinquencies. The number of properties in possession rose from 396 to 444 in a quarter!

They said their audited statutory net profit for 1Q19 was $1.95 billion, comparable to 2H18.

They reported net interest margins excluding treasury was higher following repricing last year. There was a weaker contribution from treasury.

Provisions were $4,066 million compared with Sep 18’s $3,053.

On 1 October 2018 Westpac adopted AASB 9 and AASB 15. The models for implementation of these standards are still to be finalised and so current changes associated with implementation are preliminary and may change. These will be finalised with Westpac’s First Half 2019 results.

Some transitional impacts from the adoption of AASB 9 have included: i) an increase in collectively assessed provisions of $974 million; ii) a reduction in retained earnings and an increase in deferred tax assets; iii) a $3.9 billion reduction in risk weighted assets; iv) a rise in reported stressed assets; and• v) a 2 basis point increase in the CET1 capital ratio.

Impairment charge was $204 million. $30m pre-tax in insurance claims for Sydney hailstorms are expected.

Westpac showed the slowing in mortgage lending we are seeing across the majors.

Mortgage Interest only lending was 32% of portfolio at 31 Dec 2018 (down from 35% at 30 Sep 2018). Investor lending growth, using APRA extended definition, 0.8% pa

They have a portfolio of IO loans, some at 10 years plus. 16% expire this year.

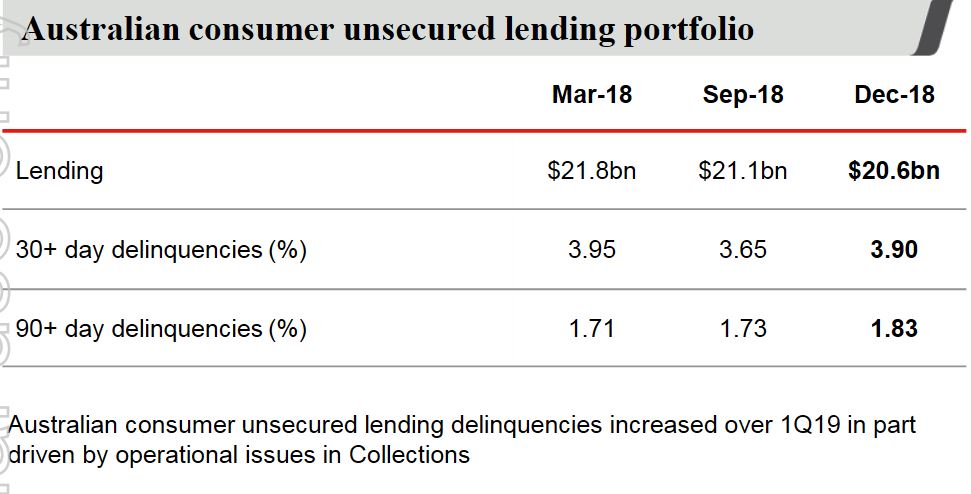
Australian mortgage delinquencies were 4 basis points higher over the quarter while Australian unsecured delinquencies were also higher, up 10 basis points. The number of properties in possession rose from 396 to 444 in a quarter!

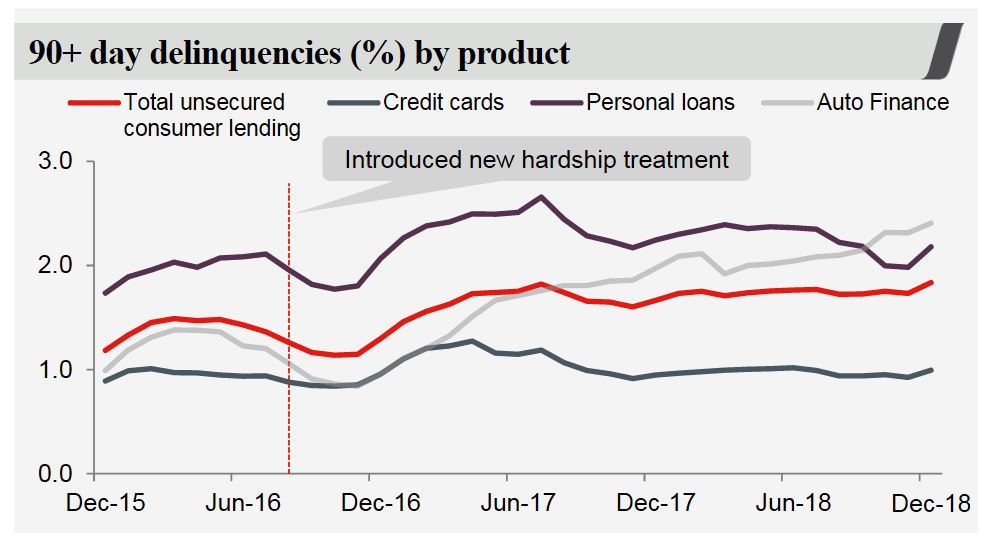
Australian unsecured 90+ day delinquencies increased to 1.83% (up 10bps over the quarter)

The Group’s common equity Tier 1 (CET1) capital ratio was 10.4% at 31 December 2018. The ratio was lower than the 10.6% reported for September 2018 after payment of Westpac’s final dividend (net of DRP), which reduced the CET1 capital ratio by 69 bps. Excluding the dividend payment, the CET1 capital ratio increased 49 basis points.

Liquidity coverage ratio (LCR) 128%, net stable funding ratio (NSFR) 112%

$16bn of term funding was raised during 4 months to 31 January 2019

Finally, a warning about capital.

Australia’s big banks may struggle to raise the amount of extra capital they require under new rules proposed by the country’s banking regulator, a senior executive at Westpac Banking Corporation said in an interview published on Monday.

The mooted requirements, which the country’s four largest lenders said would mean they need to raise between A$67 billion and A$83 billion over four years ($48 billion to $60 billion) are sound in principle but tough to achieve, Westpac treasurer Curt Zuber told the Australian Financial Review newspaper.

“As we go through cycles, it is potentially problematic for the banks to get the volumes they need in an economic way for the system which allows for the balance we want to achieve,” he said.

Bank Of Queensland Warns

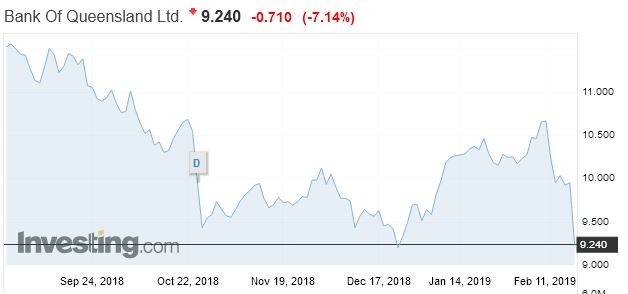
The Bank of Queensland released a trading and earnings update today, ahead of the half year results on 11 April 2019. Their shares dropped significantly and are ~18% lower than a year back.

They said the cash earnings will be in the range of $165-170m, compared with 1H18 cash earnings after tax of $182m.

This is driven by a fall in non-interest income, down $8-10m that $75m in 1H18, thanks to lower fee, trading, insurance and other income lines.

Plus net interest margin will be in the range 1.93% to 1.95% compared with 1.97% in 1H18, and will be around $475m.

There will be more non-recurring expenses, so expenses will be higher.

Loan impairments are expected to be int eh range of 11-13 basis points of gross loans. They say underlying quality remains good.

CET1 capital will be above 9.1% reported last time.

The say conditions will remain challenging with an increasing regulatory burden, including the outfall from the Royal Commission.

The Bendigo Bank Conundrum

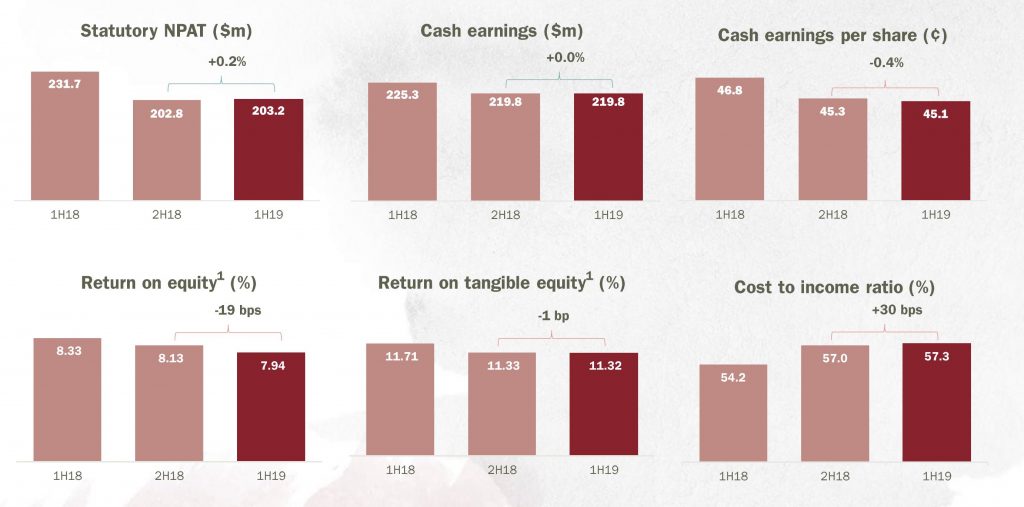
Yesterday Bendigo and Adelaide Bank released their results for the half year to December 2018. The after tax statutory profit was $203.2 million up 0.2% on the prior half, but significantly lower than the $231.7 million in 1H18. The cash earnings was flat at $219.8 million, but again lower than $225.3 million in 1H18. The earnings per share was 45.1 cents, down 0.2 cents and the fully franked dividend was 35 cents per share. The return on equity fell 19 basis point half on half.

They are positioning as “Australia’s fifth largest retail bank” and they saw a rise of 18% in new customers joining and according to research are the 9th most trusted brand in Australia. Have no doubt the franchise and “local” approach is attractive to some customers, but the question is, can the current formula work in the current tight margin, highly competitive market at a time when home loan momentum is falling. One signal is cost to income, which is rising – a reflection of the high touch model.

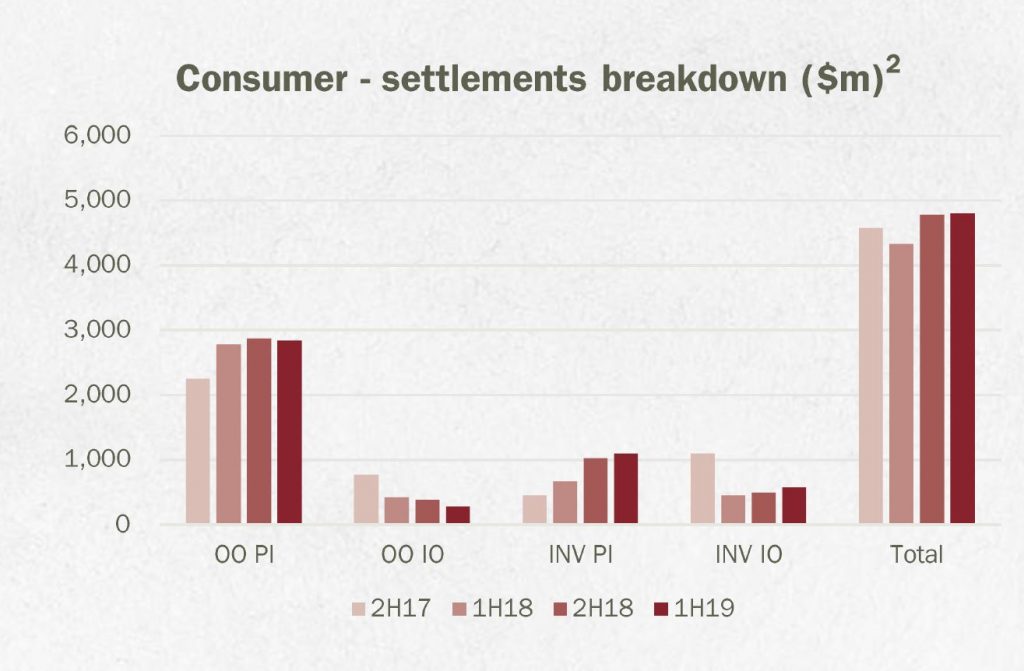
Mortgage book growth was 2.7%, compared with system growth of 3.3% with a portfolio of $23.1 billion. They saw more growth in investor loans than owner occupied loans.
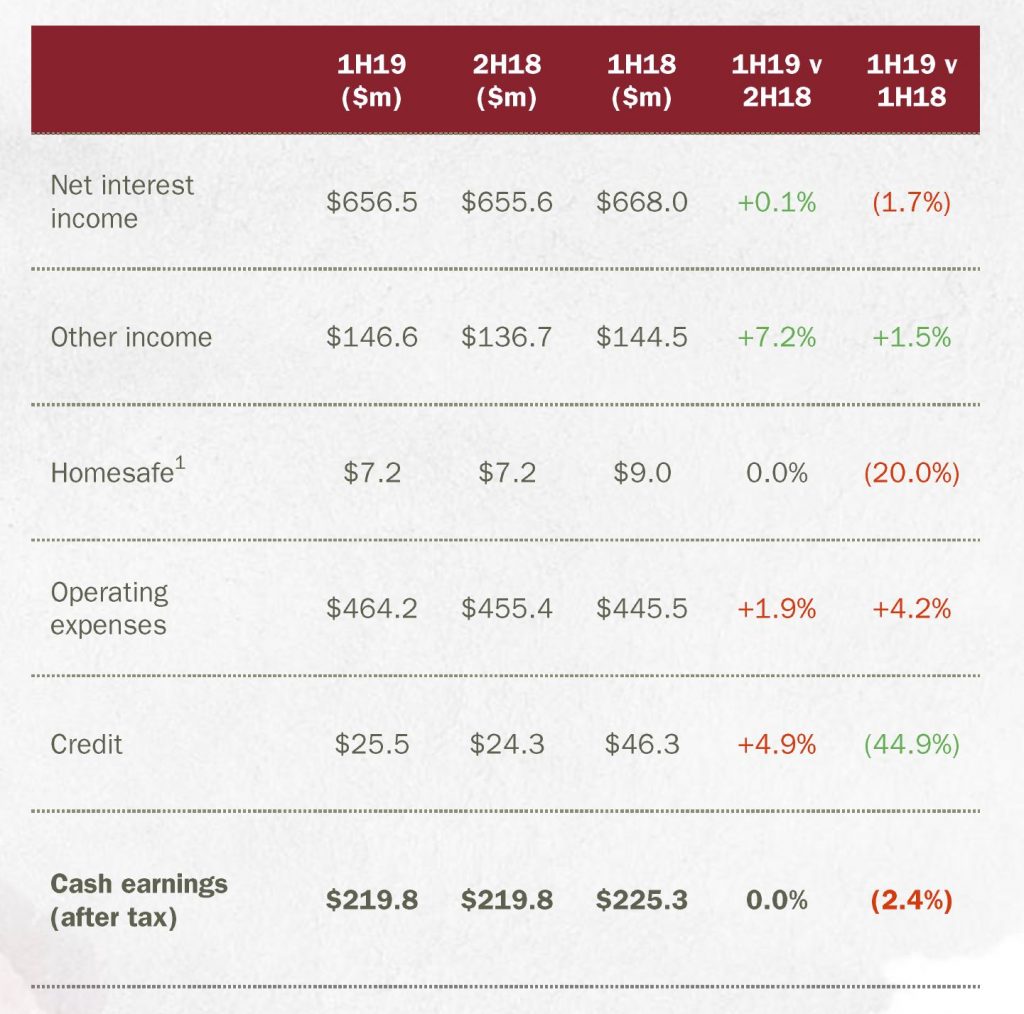
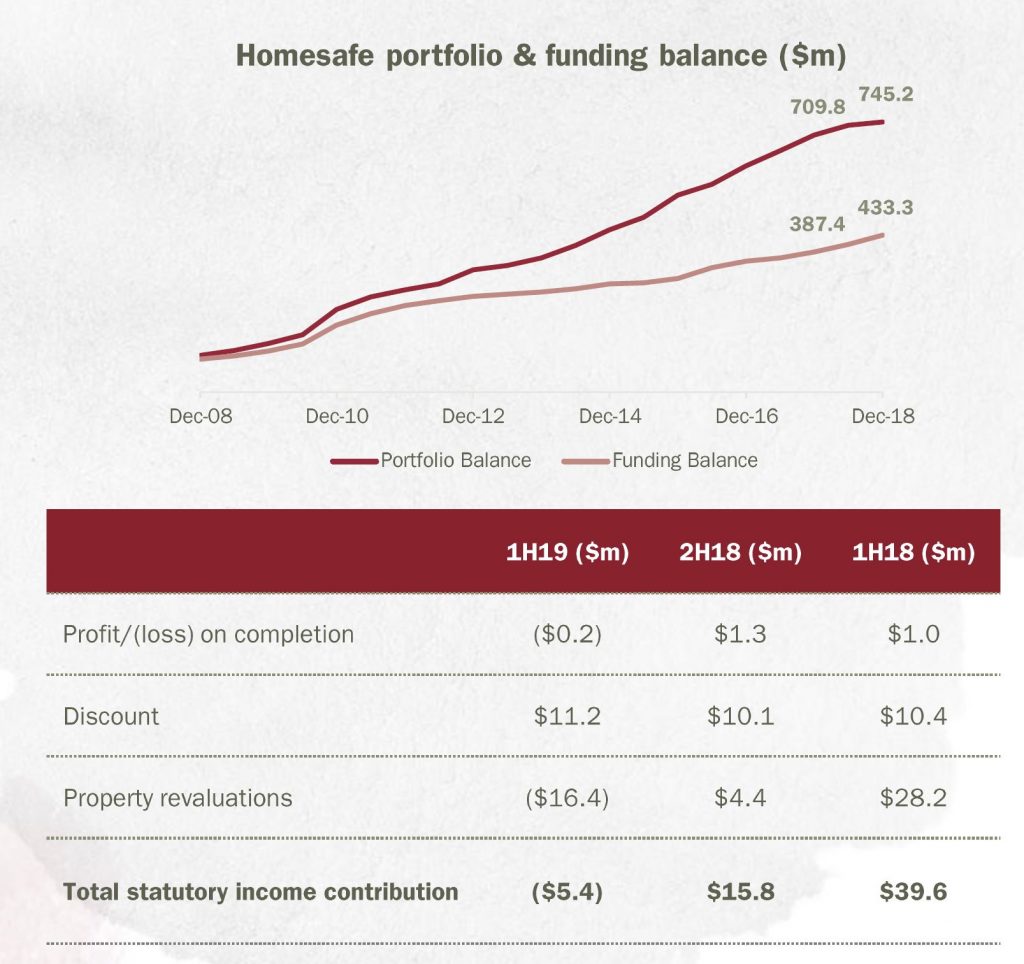
Earnings were support by other income (card activity and commissions on managed funds plus FX transactions), but net interest income was flat and Homesafe reflects changes to its accounting treatment.

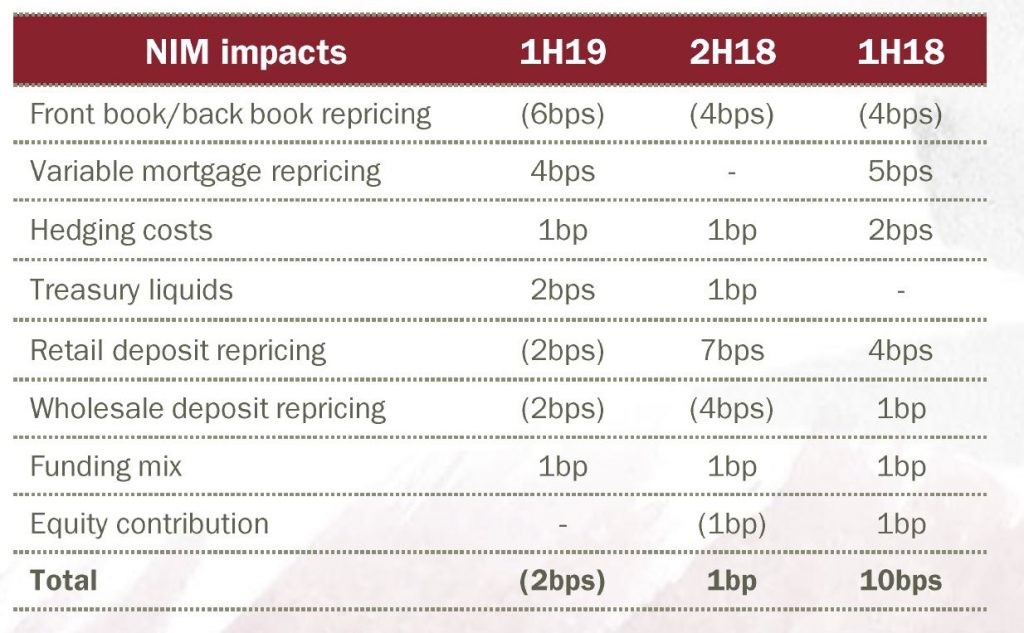
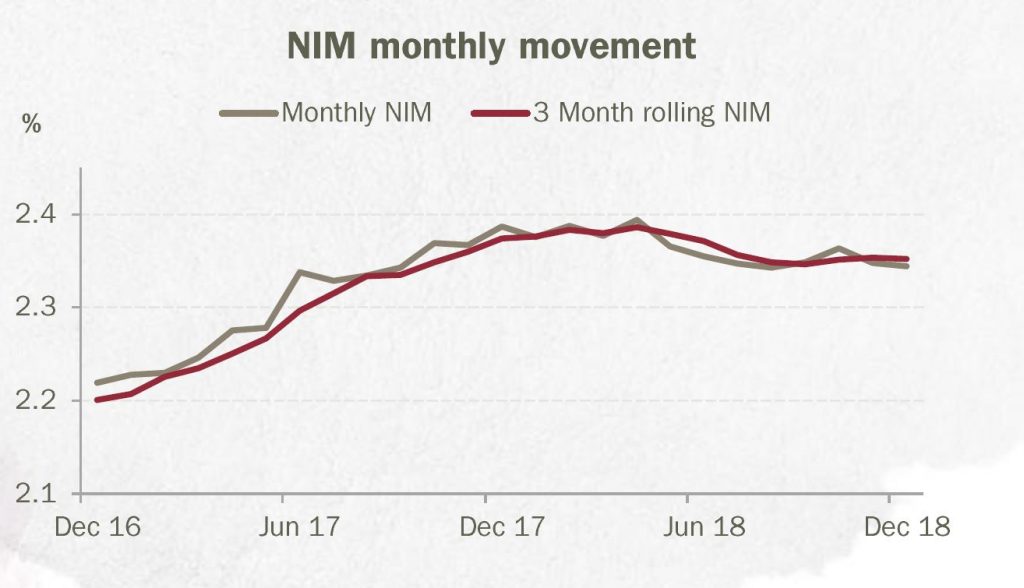
Net interest margin was down 2 basis points reflecting discounting for new loans, higher funding costs and deposit repricing.

The exit margin was 2.34% and will remain under pressure ahead.

Homesafe contribution was subject to a review of their portfolio valuation methodology, as a result they removed the overlay and revised down valuation growth rates to 0% in year 1, 3% year 2 and 4% year 3 and beyond. The result was a $1.9m change to the valuation. Essentially, they tweaked the property valuations lower (from 6% growth) but then changed the discount rate to mask the effect. A little sneaky! We said last year their home price projections were heroic… but there is still more downside risk here in our view.

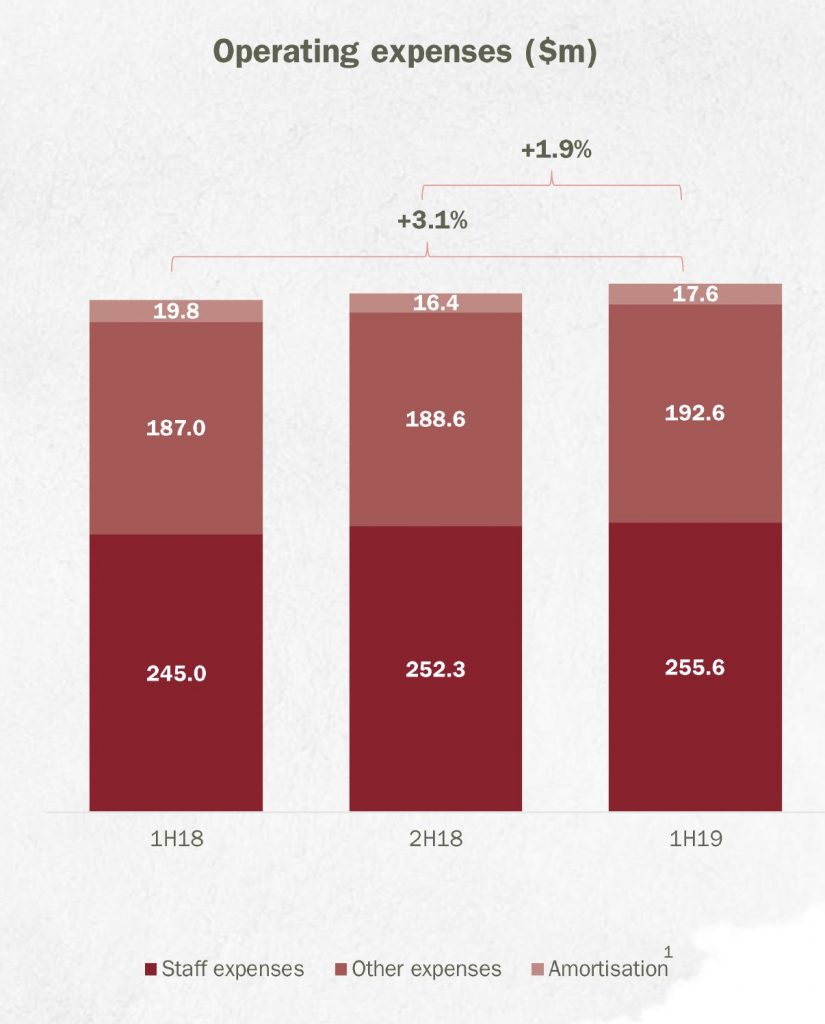
Their costs were higher, up 30 basis points to a cost income ratio of 57.3%, including higher staff costs, technology and legal and compliance.

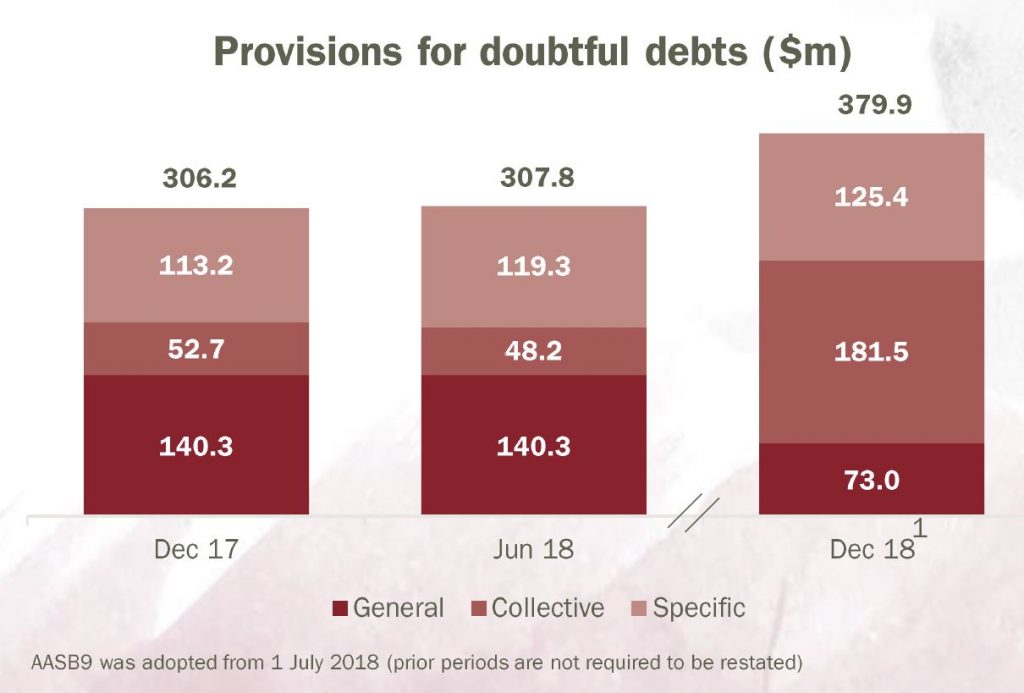
Along with the other banks, they continue to adjust their provisions to AASB9 which has lifted the collective provisions. It stands at 8 basis points, below the long term average.

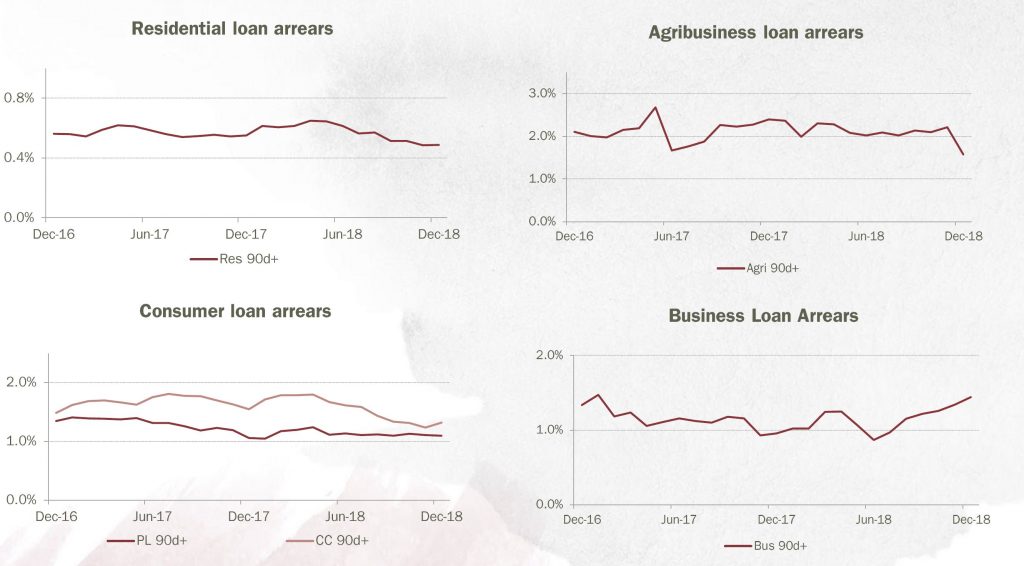
Arrears appears well contained at the moment. There was a small spike in 90 days plus credit card arrears, and business loans. Note though these figures EXCLUDE impaired loans over 90 days.

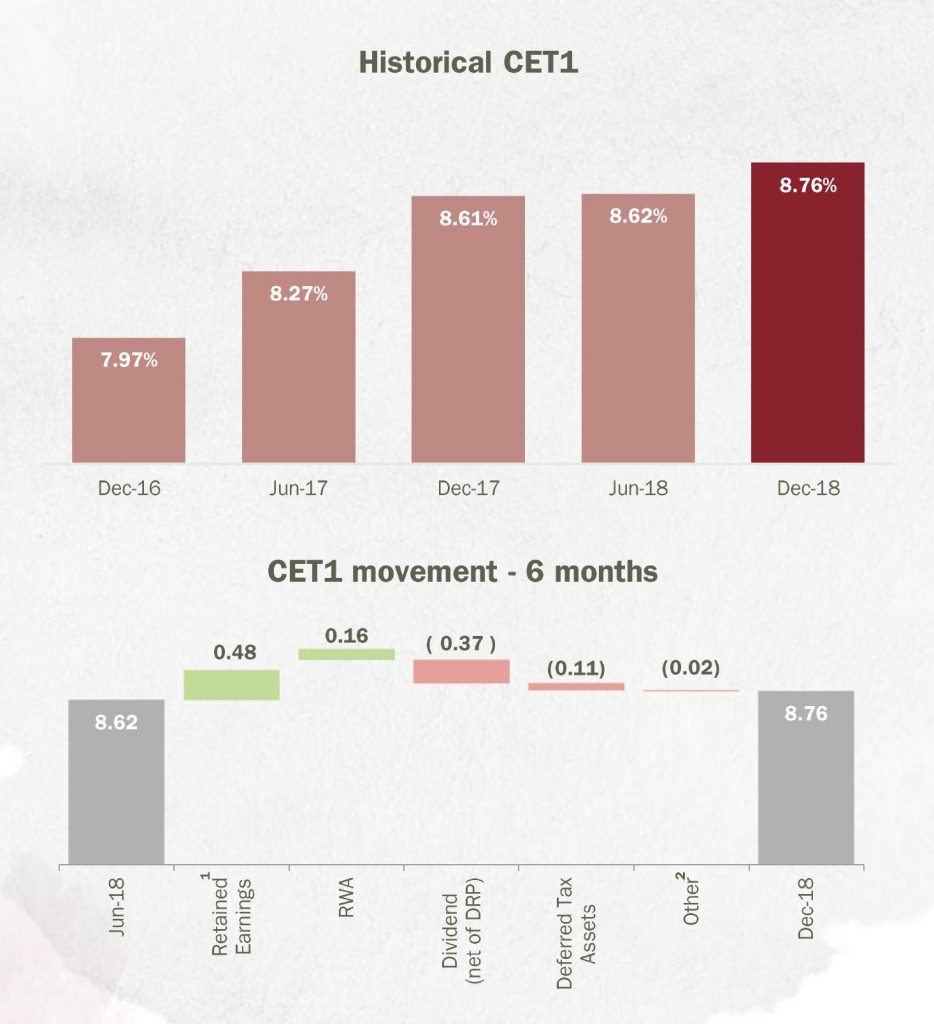
Capital position is 8.76% CET1, up 14 basis points. They are still working on advanced APRA accreditation (though the benefit looks increasing questionable in my view given APRA’s moves to lift the advanced ratios, relative to standard approaches.

Funding from deposits increased to 82.4% but they noted that higher BBSW impacted the cost of wholesale and securitisation funding.

So to conclude, we wonder about ongoing margin compression and the slowing housing sector and mortgage growth. Their cost base appears to contain significant fixed elements, which means they may have ongoing cost ratio issues. The benefit of advanced capital accreditation may be lower as APRA turns the screws. A tricky time for a player which gets the consumer, but has difficulty in competing in the current environment.

CBA 1H Results Shows Margin Pressure, But Strong Capital

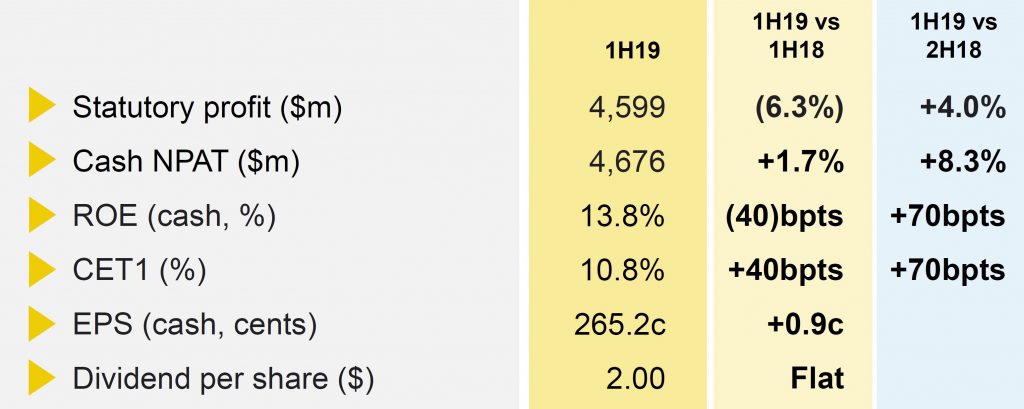
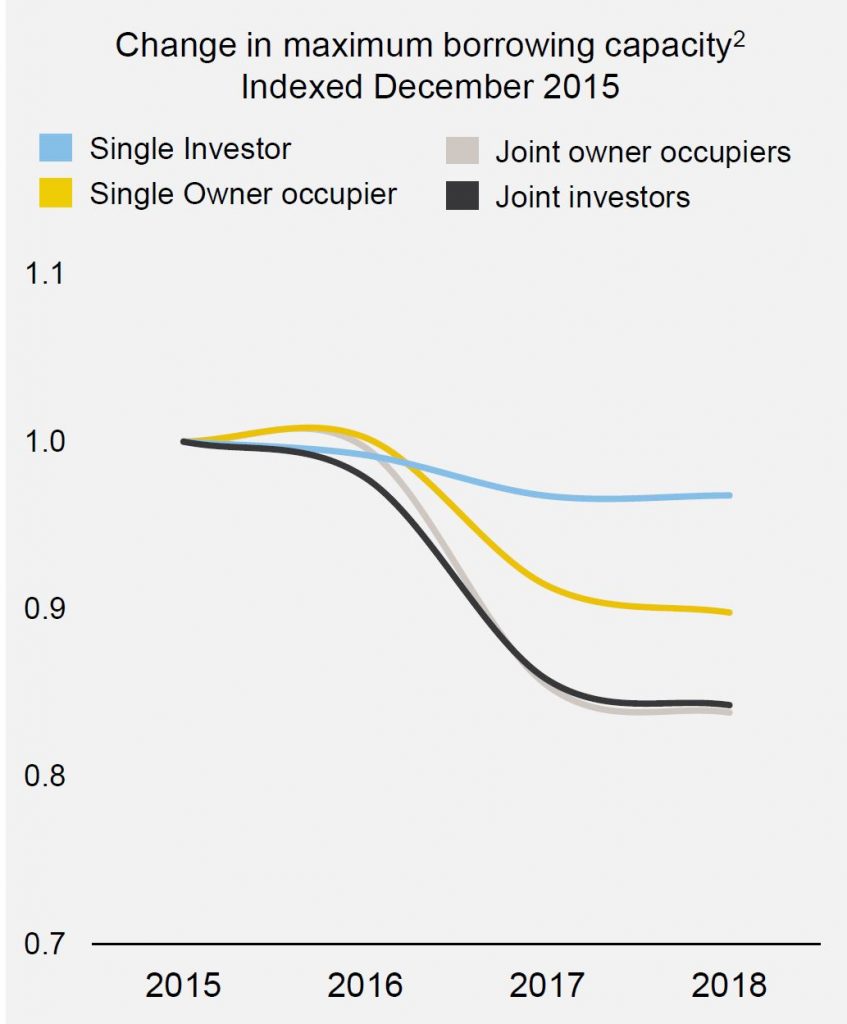
CBA released their IH19 results today and reported a statutory net profit after tax (NPAT) including discontinued operations of $4,599 million, down 6.3% on 1H18, but 4% up on 2H18. We see signs of stress in higher consumer loan defaults and margin pressure despite higher capital ratios. Its going to interesting to see how the other banks perform – generally CBA does better than some of its peers. They reported a drop in mortgage borrowing power of more than 15% compared with 2015, thanks to tighter standards.

Cash NPAT from continuing operations was $4,676 million, up 1.7% on IH18.

ROE was 13.8% (continuous operations), was down 40 basis points on prior comparative period (pcp).

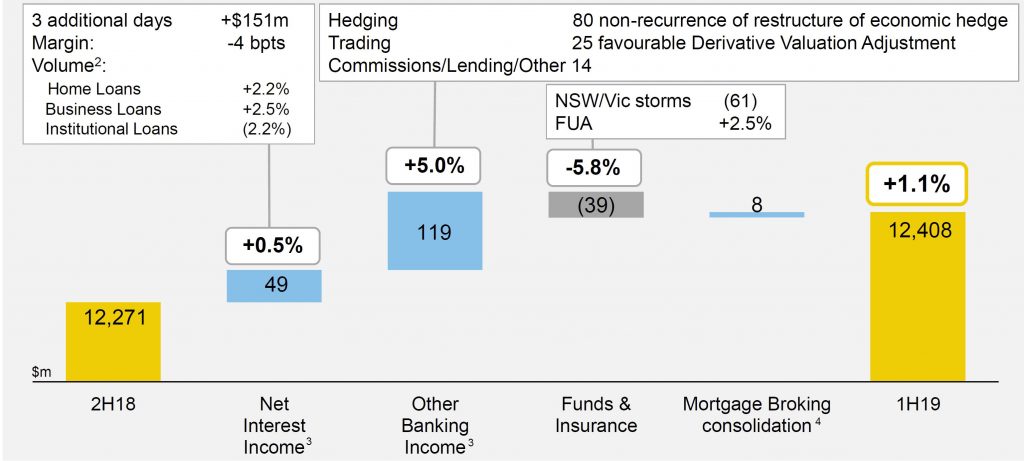
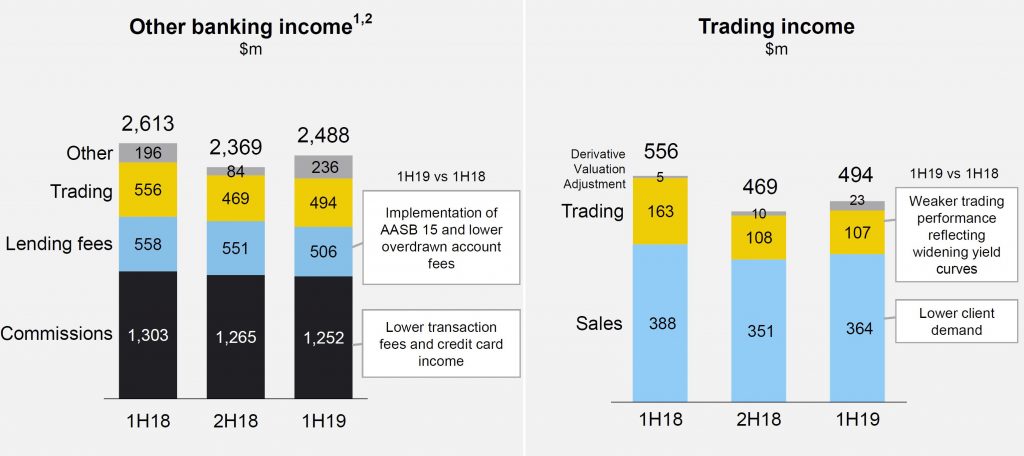
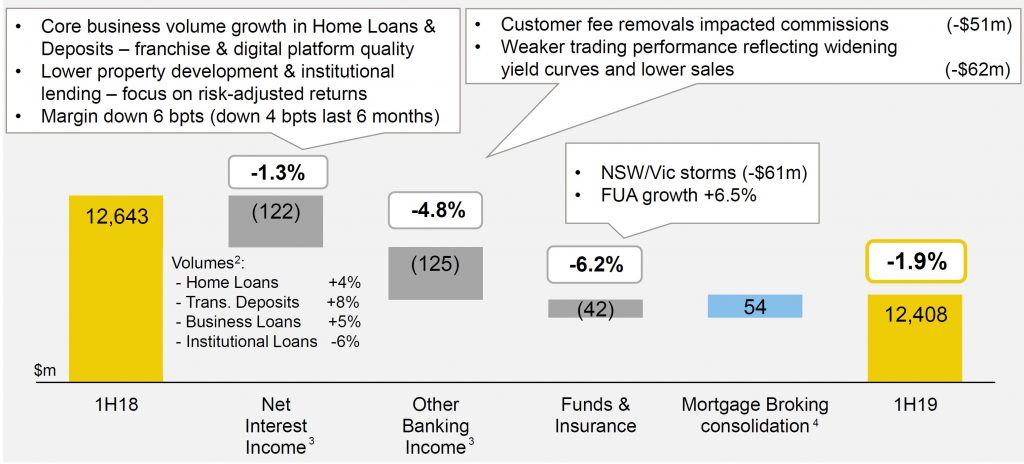
Operating income of $12,408 million, down 1.9%, with volume growth offset by lower net interest margin, lower Markets and fee income, and the impact of weather events.

Trading income dropped from $556 million 1H18 to $494 million 1H19.

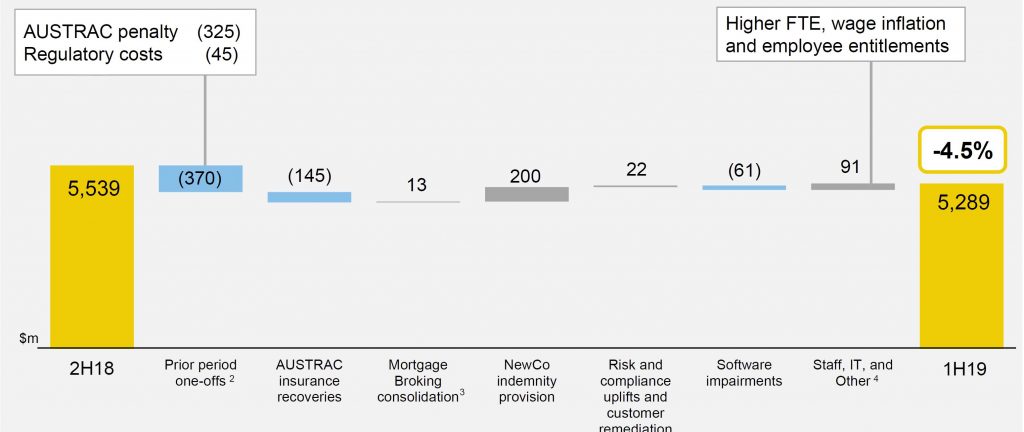
Expenses were down 4.5%, helped by one offs.

The cost to income ratio was 42.6%, down 60 basis points on pcp.

Net interest margin of 2.10%, 4 basis points lower than 2H18, due to higher funding costs and home loan switching and competition. The pressure was from higher funding, basis, discounting and offset by deposit repricing. Retail Banking margin fell from 277 1H18, to 260 basis points in 1H19, driven by higher funding costs and home loan margin pressures.

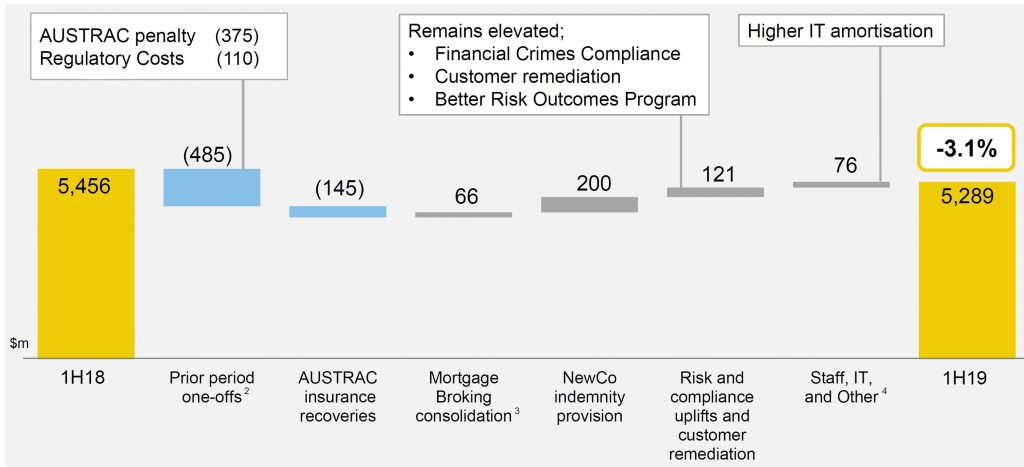
Operating expenses of $5,289 million, a reduction of 3.1%, with elevated risk, compliance and remediation costs offset by prior period one-offs.

Home lending in Australia grew at 3.5% in total, with investment loans at 0.1%, and at 0.9 times system growth in 1H19. They had less reliance on mortgage brokers. They have increased loan underwriting standards significantly.

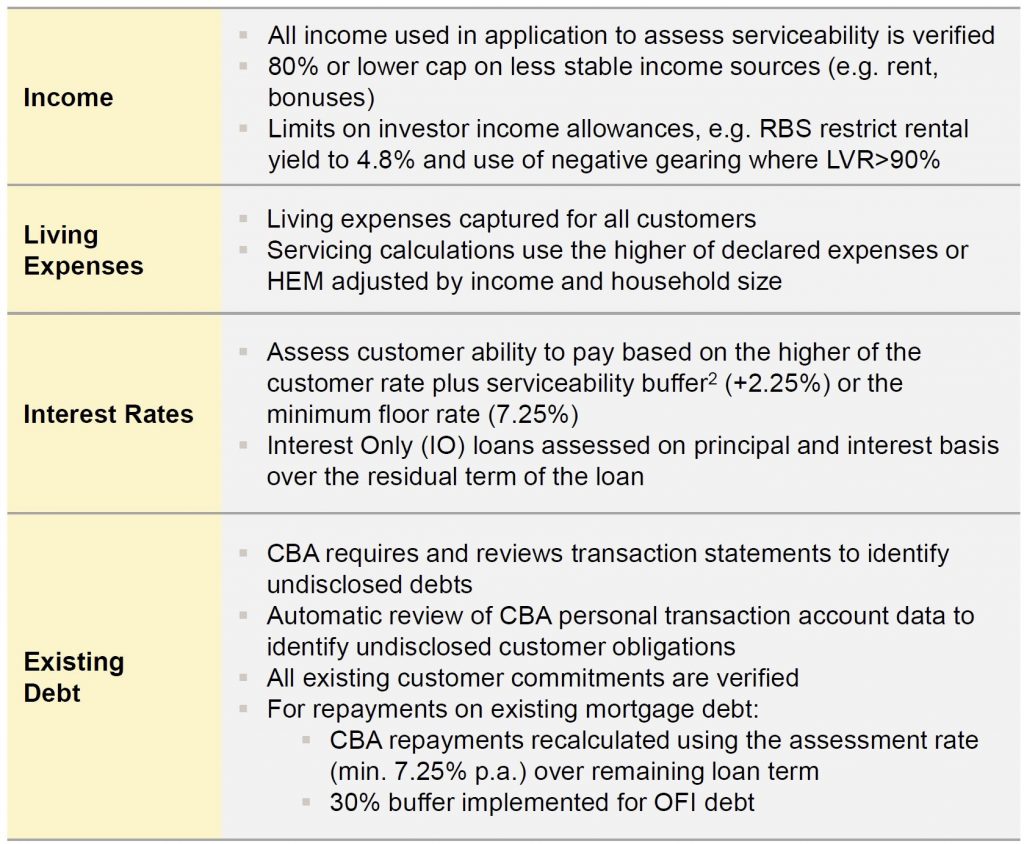
Borrowing capacity has dropped by around 15% on average, compared with 2015. Current serviceability tests include an interest rate buffer of 2.25% above the customer rate, with a minimum floor rate of 7.25%

Standards are higher now.

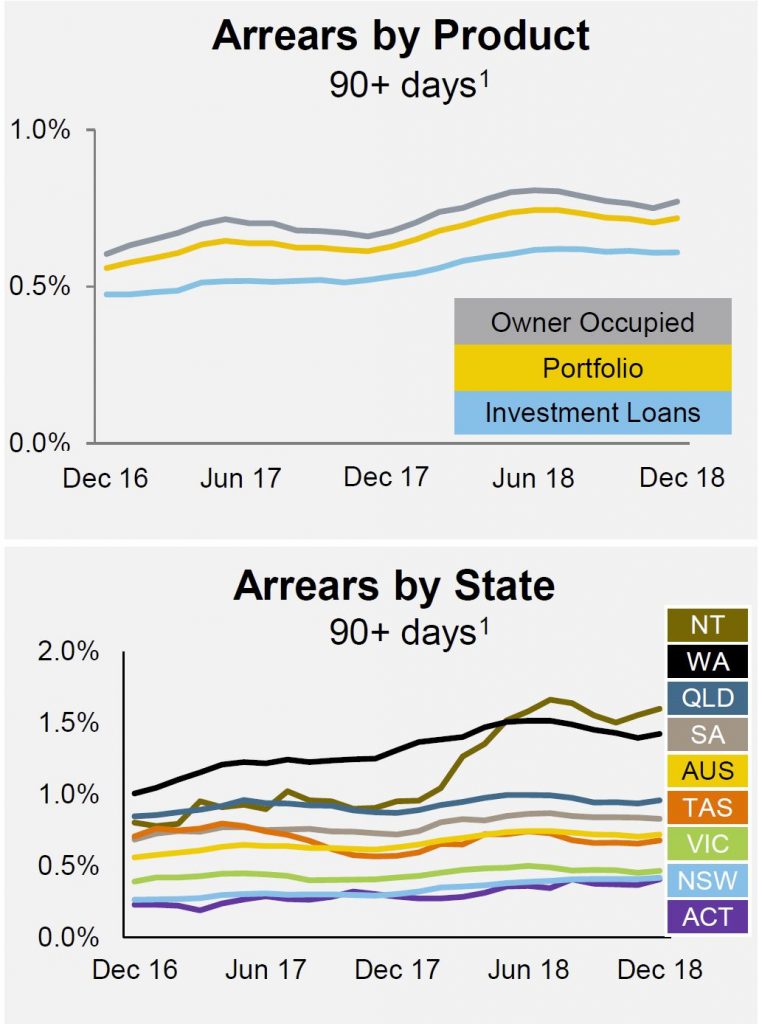
Mortgage arrears are rising, with WA and NT leading the way.

A severe stress test scenario is modelled on an ongoing basis. Scenario includes stresses to house prices (31% decline), unemployment (11%), cash rates (reduced to 0.5%). Losses are estimated over three years: Gross 3-year losses of $3.85b, or $3.06b net of insurance.

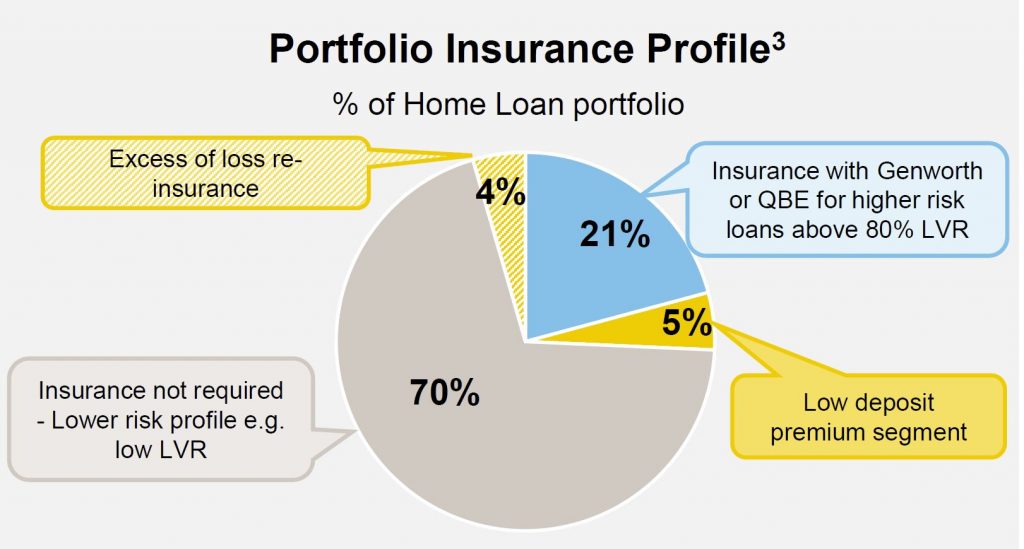
21% are insured with Genworth or QBE.

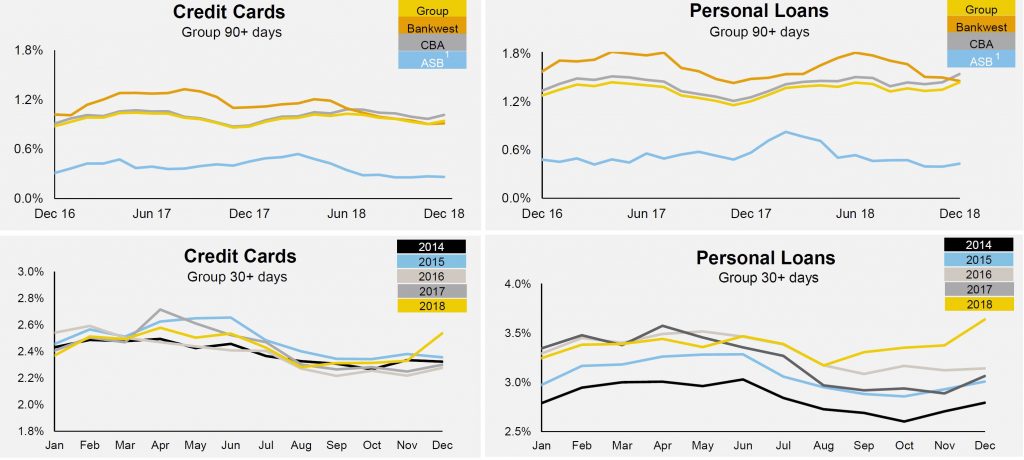
Consumer debt is also under pressure.

Loan impairment expense of $577 million, equivalent to 15 basis points of average gross loans and acceptances annualised, down from 16 basis points.

Funding costs continue to rise, as expected.

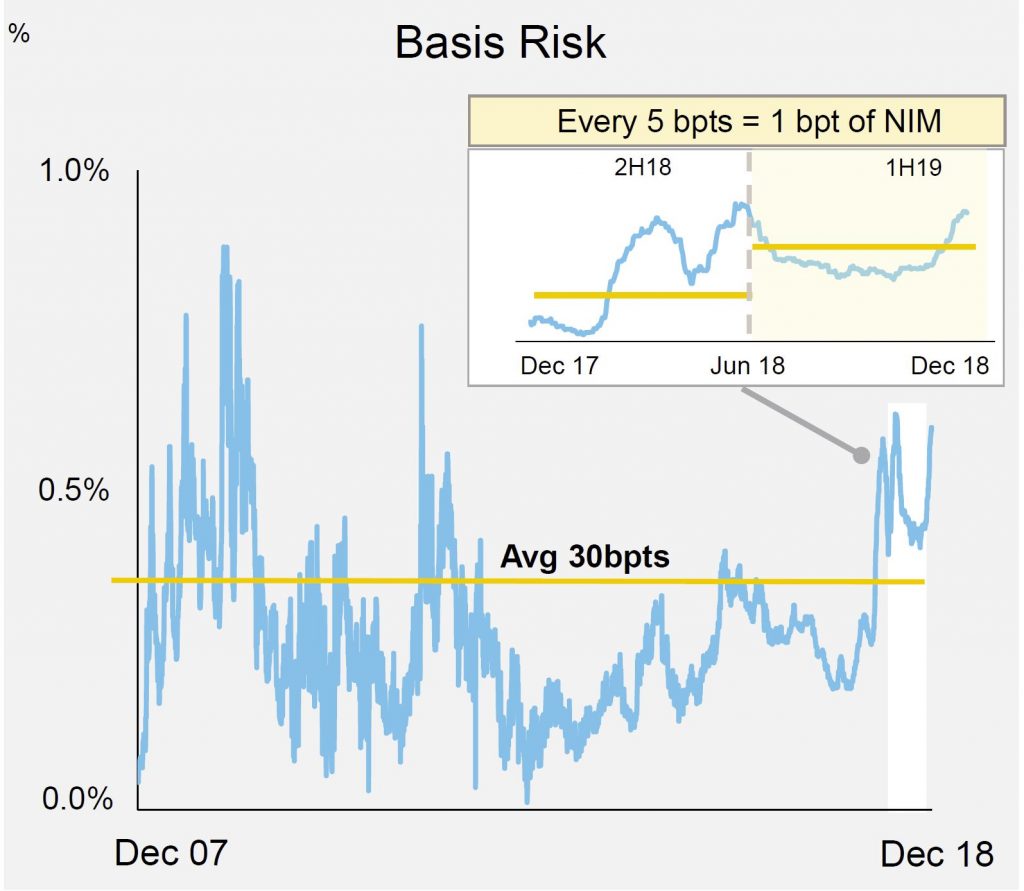
Every 5 basis points of basis risk equates to 1 basis point of net interest margin.

Effective tax rate of 28.5%, expected to rise to approximately 29% for FY19. Interim dividend per share flat at $2.00. The Dividend Reinvestment Plan is anticipated to be satisfied in full by an on-market purchase of shares.

Earnings per share (cash basic) of 265.2 cents, an increase of 0.9 cents per share. Return on equity (cash) of 13.8%, down 40 basis points.

Common Equity Tier 1 (CET1) capital ratio on an APRA basis of 10.8%, up from 10.1% as at June 2018.

AMP Shareholders Brace For $0.04 Dividend Payment

Ahead of its full year 2018 financial results – due to be published on 14 February – AMP expects to report an underlying profit of “around $680m” and profit attributable to shareholders of “approximately $30m”; via Australian Broker.

Regarding shareholders, in a statement, AMP said, “Recognising the 2H 18 performance of the business, the related capital impacts and the uncertainties in the operating environment, the board anticipates declaring a final dividend of 4 cents per share.”

AMP’s 2018 interim dividend stood at $0.10 per share (50% franked), compared to a final dividend of 14.5 cents in 2017 (90% franked) and 14 cents in 2016 (90% franked). In 2007, the final value reached 24 cents (84% franked).

Payment of the 2018 full year dividend is due on 28 March.

The news is the latest in a series of blows to AMP shareholders. Last year, they staged the largest known “first strike” ever recorded by a top 50 Australian company when, during AMP’s annual meeting, 61.5% of investors voted against the firm’s executive pay structure.

In 2018, AMP was hit with five shareholder class actions, brought by Slater & Gordon, Quinn Emanuel Urquhart & Sullivan, Phi Finney McDonald, and Shine Lawyers.

In a statement AMP said its total business unit operating earnings for the second half of 2018 are expected to be approximately $220m, comprising around $325m from the retained businesses, Australian wealth management, AMP Capital, AMP Bank and New Zealand wealth management and advice.

A net operating loss of around $105m from the businesses is subject to a sale agreement with Resolution Life.

The firm’s 2019 AGM is scheduled for Thursday 2 May.

Australian Banks’ Earning Pressure to Continue in 2019

The earnings of Australia’s four major banks are likely to fall further in the near term due to slowing credit growth, especially in the residential mortgage segment, and further remediation and compliance costs associated with inquiries into the financial sector, including the Royal Commission, says Fitch Ratings. The banks reported an aggregate decline in profitability in their latest full-year results.

Slower growth puts pressure on the banks to increase lending margins to maintain profitability. However, intense regulatory and public scrutiny of the sector, as well as strong competition, may make it difficult for the banks to reprice loans and pass on the recent increase in wholesale funding costs, as evidenced from the latest financial results. Net interest margins are therefore unlikely to improve in the short term.

The major banks made provisions for client remediation costs during the last financial year in response to the initial findings from the Royal Commission. Fitch expects some remediation costs to flow into the 2019 financial year as the banks continue to investigate previous behaviour. Meanwhile, compliance and regulatory costs to address shortcomings are likely to rise, despite the banks simplifying their business and product offerings. The banks also remain susceptible to fines and class actions as a result of the banking system inquiries.

The four major banks – Australia and New Zealand Banking Group (ANZ, AA-/Stable/aa-), Commonwealth Bank of Australia (CBA, AA-/Negative/aa-), National Australia Bank (NAB, AA-/Stable/aa-) and Westpac Banking Corporation (Westpac, AA-/Stable/aa-) – reported aggregated statutory full-year profit of AUD29.4 billion, a decrease of 0.8% from a year earlier, while cash net profit was down by 6.5%. CBA’s financial year ended June 2018, while ANZ’s, NAB’s and Westpac’s ended September 2018. The drop in aggregate profit was driven by slower lending growth, customer remediation charges and higher funding costs, especially in the second half of the financial year, as expected by Fitch. These pressures were partly offset by a benign operating environment that limited impairment expenses across the board.

All four banks reported lower or steady loan impairment charges during the reporting period. However, 90-day-plus past-due loans increased slightly, reflective of pressure on household finances from sluggish wage growth. Impairments are likely to rise from current historical lows due to the cooling housing market and high household leverage, which make households more susceptible to shocks from higher interest rates and unemployment. The ongoing tightening of banks’ risk appetites and underwriting standards should, however, support asset quality in the long term.

Common equity Tier 1 (CET1) ratios are broadly in line with the 10.5% threshold that regulators define as “unquestionably strong”. Banks have to achieve this level by 1 January 2020. ANZ reported a CET1 ratio of 11.4%, the highest of the major banks. ANZ is undertaking a share buyback and is likely to announce further capital management plans once it has received proceeds from recent divestments and asset sales. Westpac recorded a CET1 ratio of 10.6% and therefore already meets the new minimum requirement ahead of the deadline.

CBA reported a CET1 ratio of 10.1% at June 2018, which incorporates the AUD1 billion additional operational risk charge put in place following an independent prudential inquiry published in May 2018. However, this will translate to a pro forma CET1 ratio of 10.7% after already-announced divestments. NAB’s CET1 ratio is 10.2%, but we expect it to meet the 2020 deadline, with its capital position likely to be supported by an announced discounted dividend reinvestment plan and the potential sale of its MLC wealth-management business.

Suncorp Also Feels The Heat

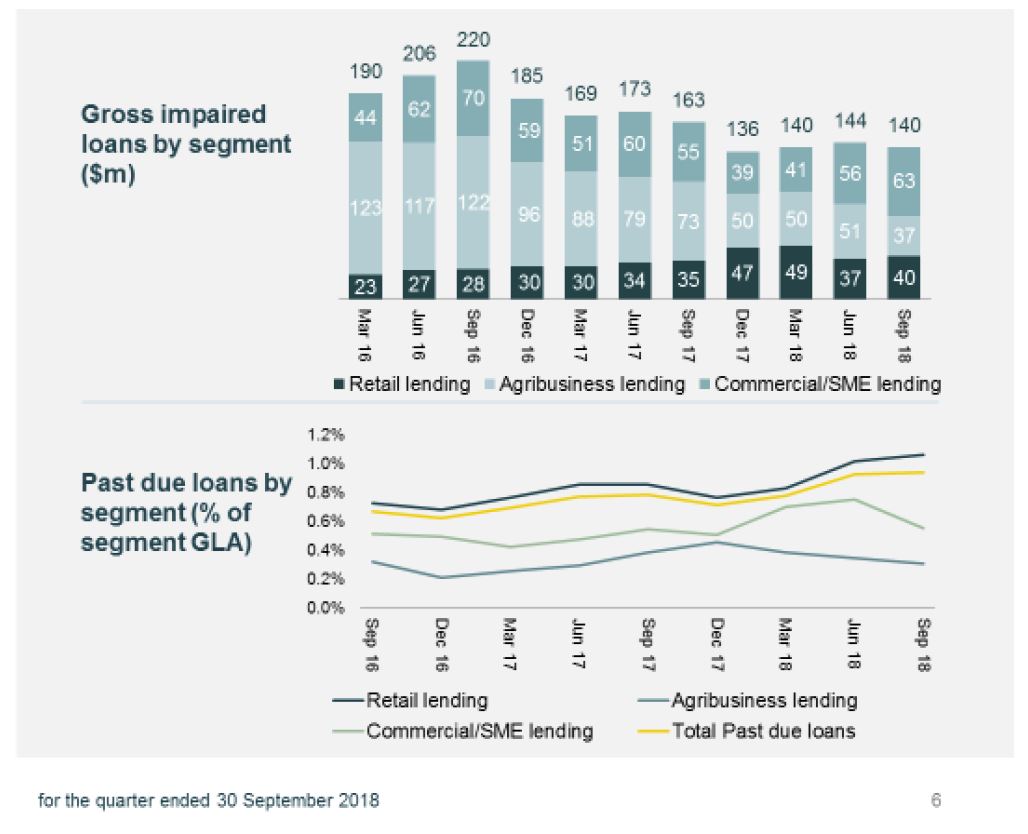
Suncorp released their APS 330 report for the quarter ended September 2018.  Like the majors, funding pressure and slow loan growth are impacting the results.  There was a rise in 90-day plus past due. They expect the moderation of home lending growth to continue. Sustained pressure from price competition and elevated funding costs is expected to result in a FY19 net interest margin at the low end of the 1.80% to 1.90% target range.

During the September quarter, total lending growth was $265 million or 0.5%. The home lending portfolio grew $361 million, up 0.8% over the quarter, within a competitive and slowing mortgage market. The home lending portfolio remains comfortably within macroprudential limit settings as Suncorp continues to be selective in its target markets. The business lending portfolio contracted $90m or 0.8% over the quarter, with moderate growth in the commercial and small business portfolios offset by a reduction in agribusiness lending following customers repayment of debt.

The transition to AASB 9 Financial Instruments (AASB 9) increased the collective provision in the balance sheet by $20 million on 1 July 2018. Following the adoption of AASB 9, provisions are expected to be more variable from period to period reflecting the increased sensitivity of the modelling to changes in economic conditions and the risk profile of Suncorp’s lending portfolio; and the movement of exposures across credit stages.

A net positive movement in impairment losses was driven by a small number of one-off customer recoveries and an improvement in the risk profile of the lending portfolio, as assessed under AASB 9.

Gross impaired assets of $140 million remained broadly stable over the quarter. Past due retail loans grew by 5.2% to $510 million over the quarter, primarily driven by an increase in customer tenure in late stage arrears. Suncorp’s approach to management of arrears is continually reviewed to improve outcomes for all stakeholders.

Wholesale funding costs continue to be impacted by the elevated Bank Bill Swap Rate (BBSW). During the quarter, Suncorp continued to support its sustainable and diversified funding base by issuing a five-year $750m covered bond. Suncorp also achieved a strong increase in at-call deposits, growing 4.7 times system over the quarter. The Net Stable Funding Ratio (NSFR) was 111% as at 30 September 2018.  The LCR was 128%.

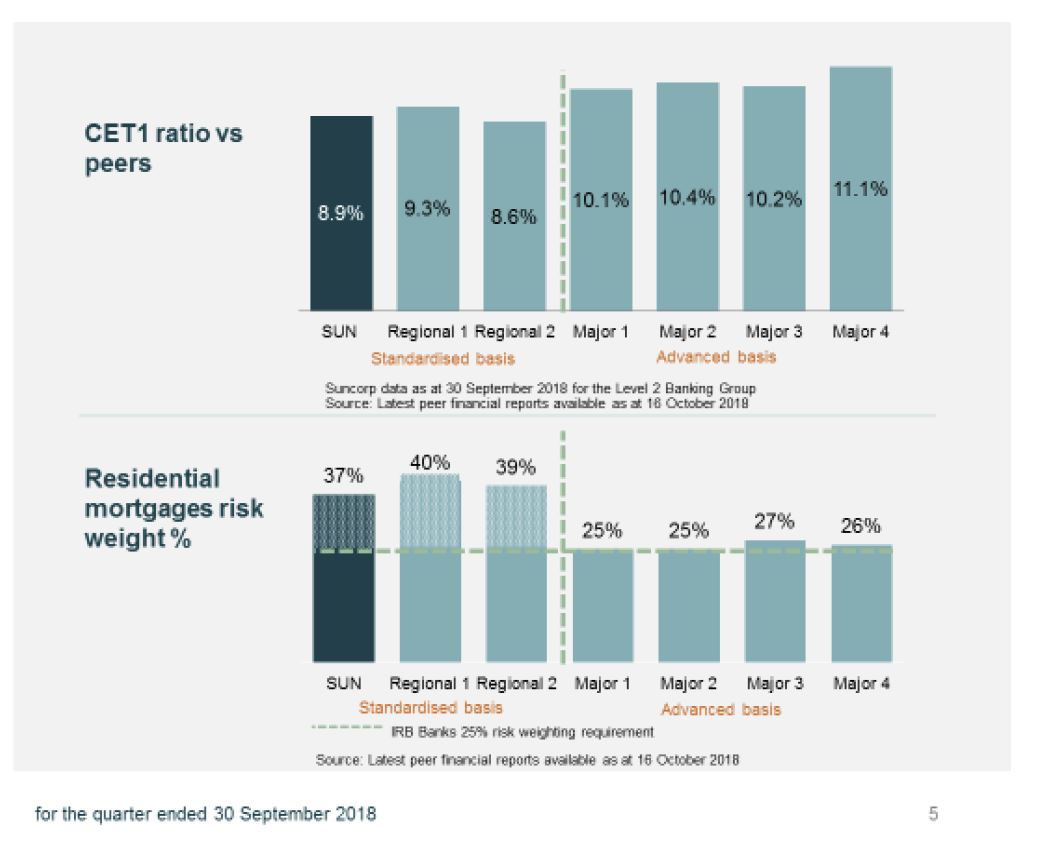
Following payment of the 2018 financial year final dividend to Suncorp Group, Banking’s Common Equity Tier 1 (CET1) ratio of 8.9% reflects a sound capital position towards the upper end of the target operating range of 8.5% to 9.0%.

The moderation of home lending growth is expected to continue, driven by a slowing market and impacts associated with regulatory reforms. Balances of vanilla housing loans dropped by 1.7% compared with the previous quarter, but this was offset by a rise in securitised housing loans and covered bonds, up 16.3%. They grew more in Queensland  than outside the state.

They said they will target above system growth in both home lending and business lending for the financial year, provided that pricing and lending criteria remain within the portfolio tolerance settings, noting the impact that ongoing drought conditions may have on the agribusiness portfolio.

Suncorp will continue to maintain a conservative risk appetite, with no material changes in any segment. While impairments could be impacted by economic factors and ongoing drought conditions, they are expected to remain below the bottom end of the through-the-cycle operating range of 10 to 20 basis points of gross loans and advances.

Suncorp continues to target above system growth in at-call customer deposits, leveraging the investments made in enhanced digital and payment capabilities. Sustained pressure from price competition and elevated funding costs is expected to result in a FY19 net interest margin at the low end of the 1.80% to 1.90% target range.

They say the expected impacts of the Basel III reforms and APRA’s roll-out of unquestionably strong benchmarks cannot be confirmed until APRA releases the draft standards, which is assumed to be in early 2019.

CBA Takes A Margin Hit

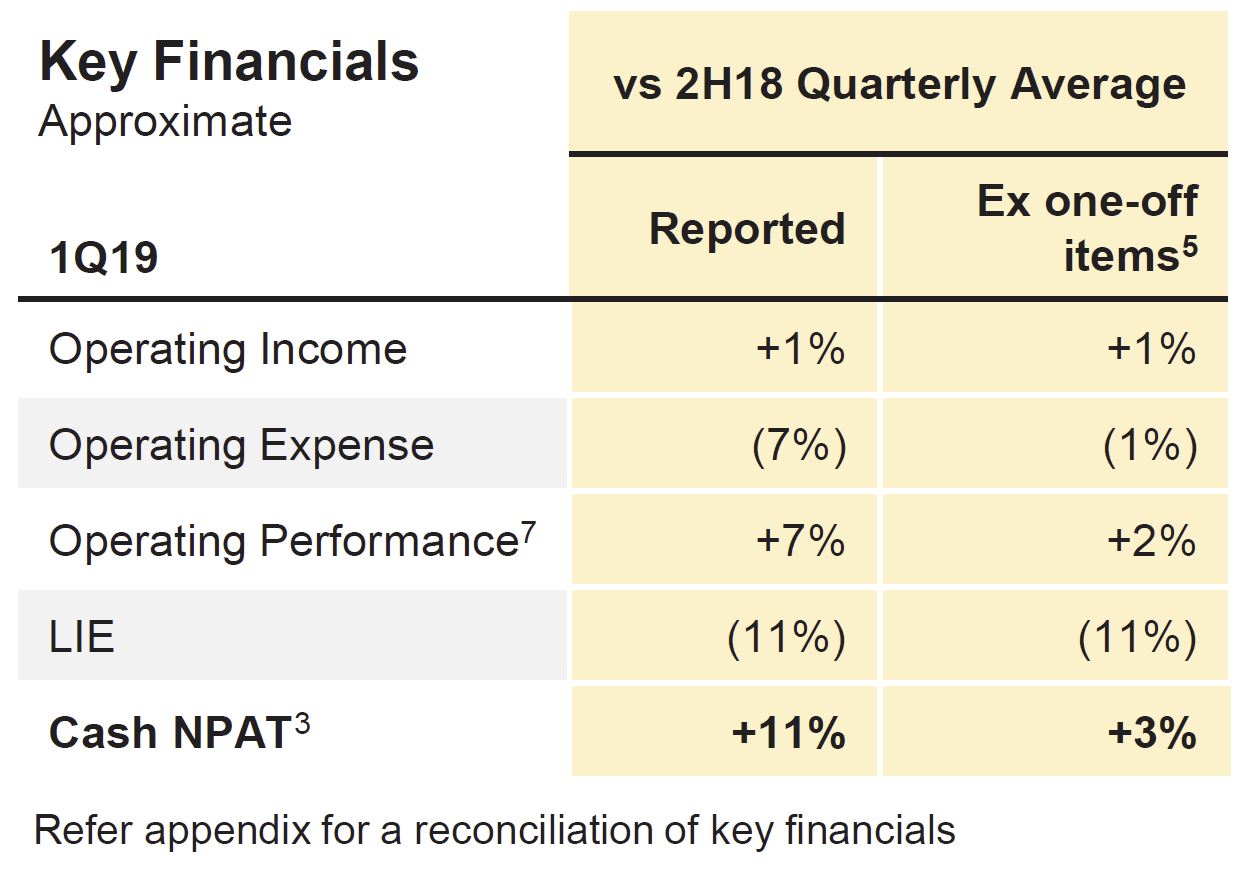
CBA released their 1Q19 trading update today. Their unaudited statutory net profit was approximately $2.45bn in the quarter and unaudited cash net profit was approximately $2.50bn in the quarter, both rounded to the nearest $50 million. The cash basis is used by management to present a clear view of the Group’s operating results. CBA did not include any further customer remediation charges in the quarter.
Their operating Income up 1%, with higher other banking income offsetting flat net interest income. But the Group Net Interest Margin was lower in the quarter due to higher funding costs (including basis risk which arises from the spread between the 3 month bank bill swap rate and 3 month overnight index swap rate; and replicating portfolio) and home loan price competition.
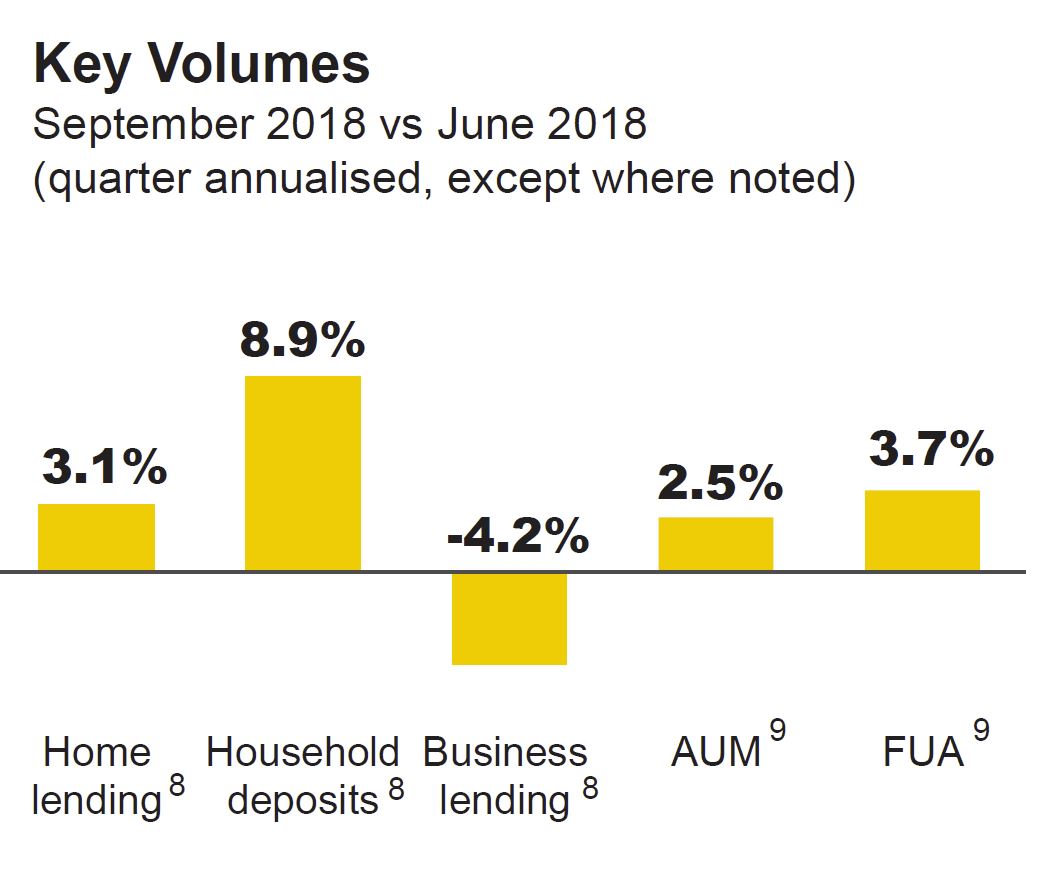
Volume growth included 8.9% quarter annualised growth in household deposits. Home lending growth of 3.1% was below system growth of 3.6% (both quarter annualised). Business lending reflected continued portfolio optimisation in the institutional book.

Operating Expenses ex one-off items were down 1% due to timing of investment spend and software impairments in the comparative period.

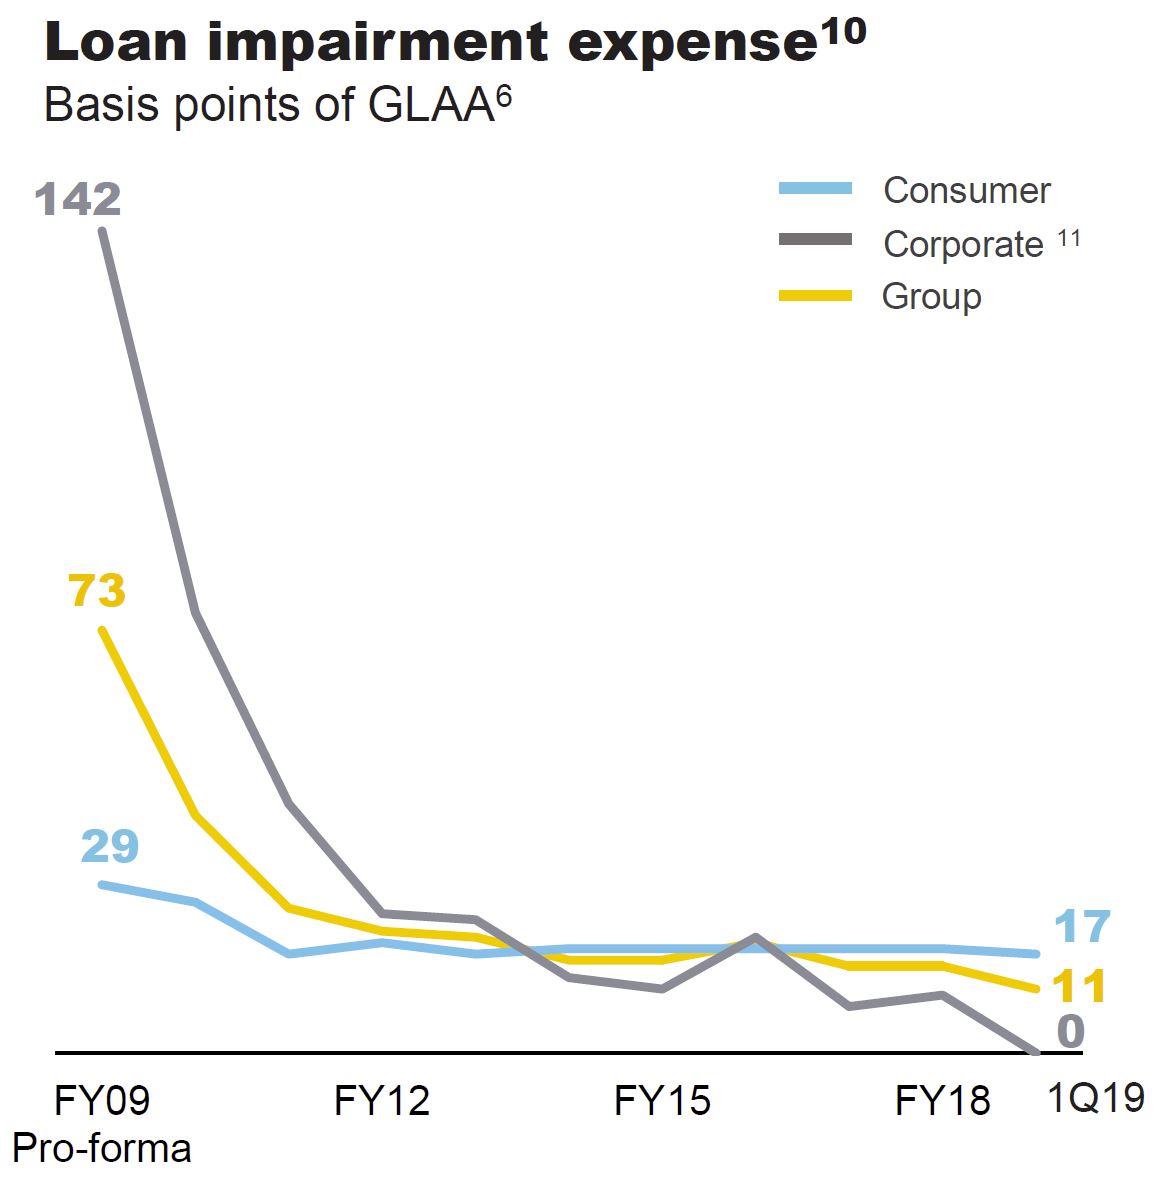
Loan Impairment Expense (LIE) were $216 million in the quarter or 11bpts of GLAA and equated to 11 basis points of Gross Loans and Acceptances, compared to 15 basis points in FY18. Low corporate LIE reflected some single name improvements, sound portfolio credit quality and continued IB&M portfolio optimisation.
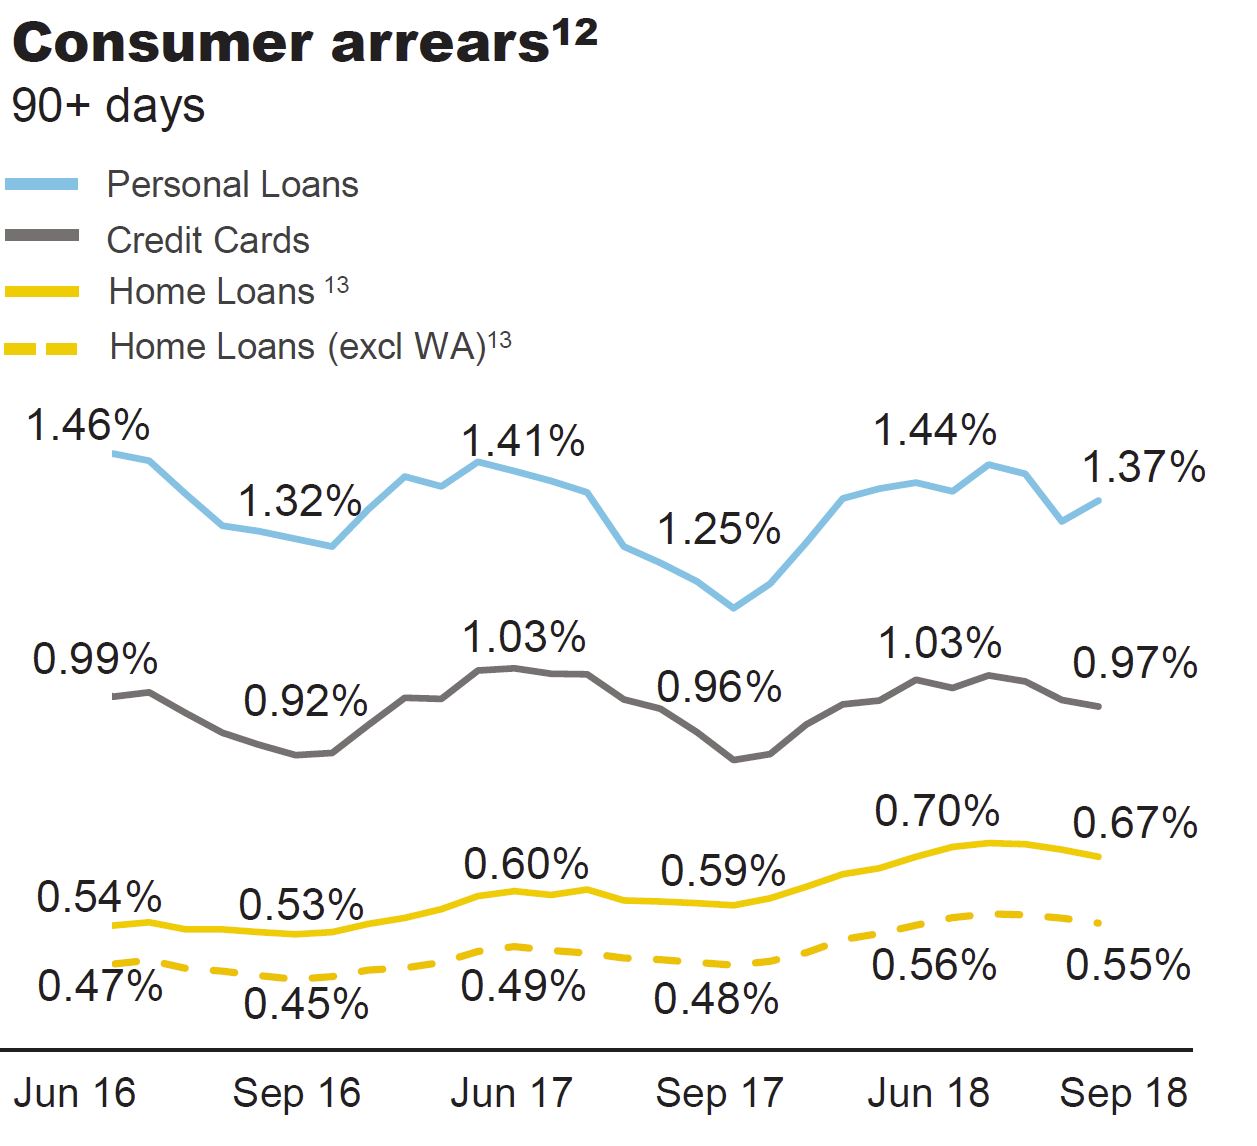
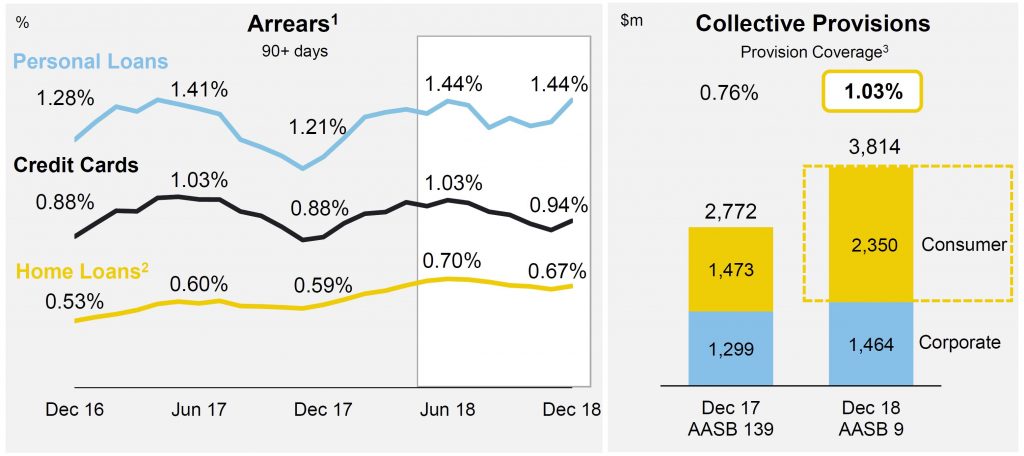
Consumer arrears were seasonally lower in the quarter. Whilst there was a moderate improvement in home loan arrears, some households continued to experience difficulties with rising essential costs and limited income growth.
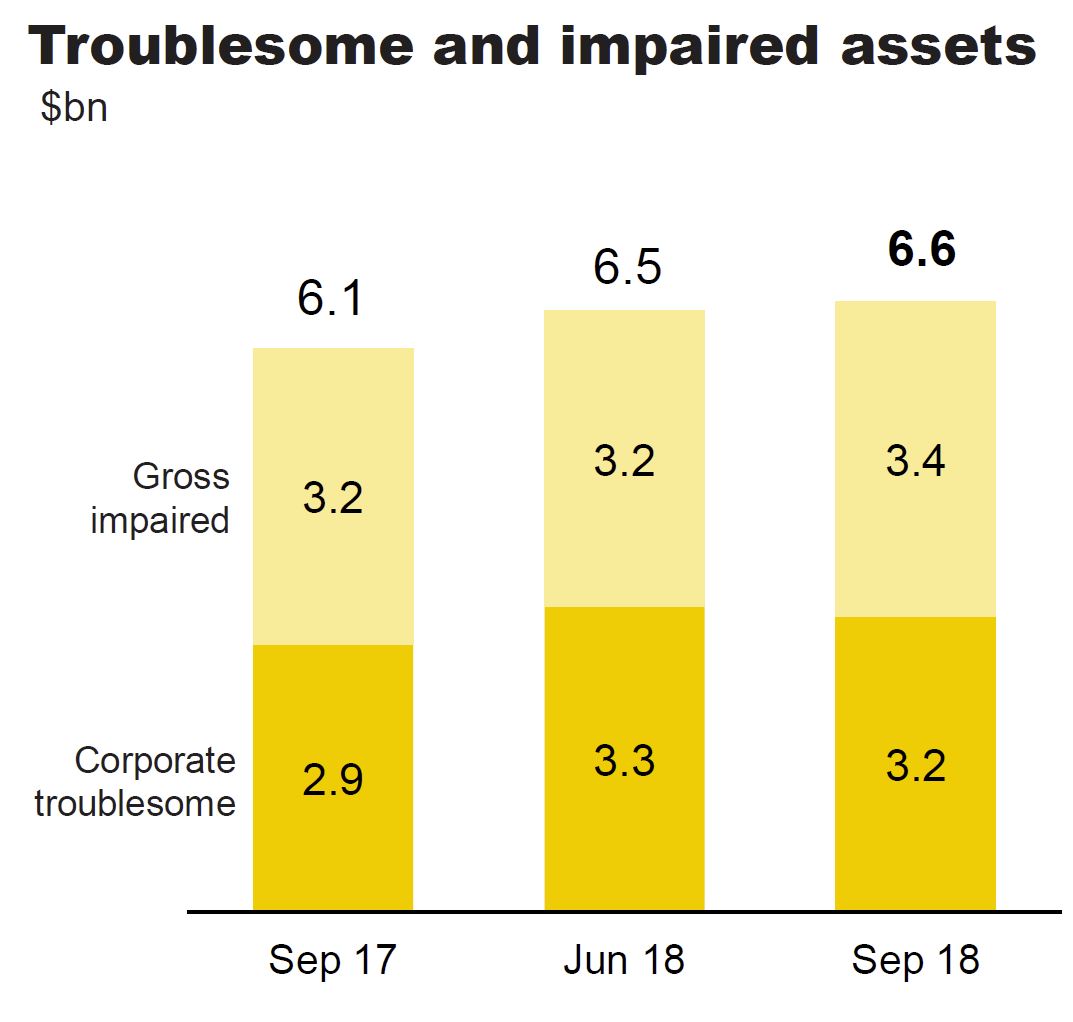
Troublesome and impaired assets increased from $6.5 billion at June 2018 to $6.6 billion in September, driven by an increase in home loan impaired assets and a small number of individual corporate impairments.

Troublesome exposures were broadly stable in the quarter.

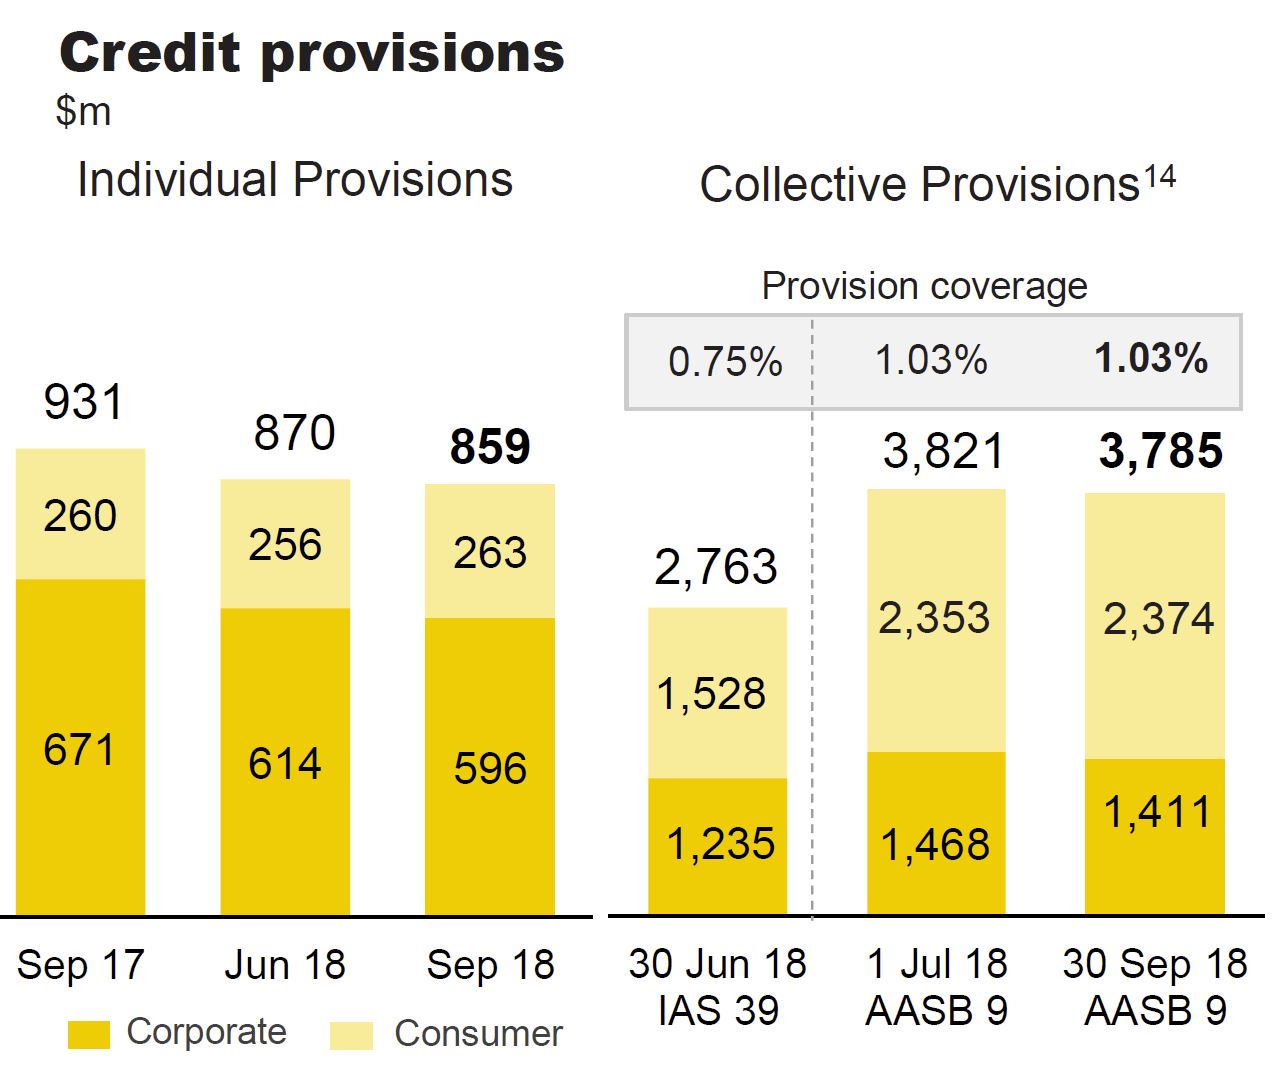
The Group adopted AASB 9 from 1 July 2018 resulting in a $1.06 billion increase to collective provisions and a 28 bpt increase in collective provision coverage to 1.03% (collective provisions to credit risk weighted assets).

Total Provisions were broadly stable in the quarter.

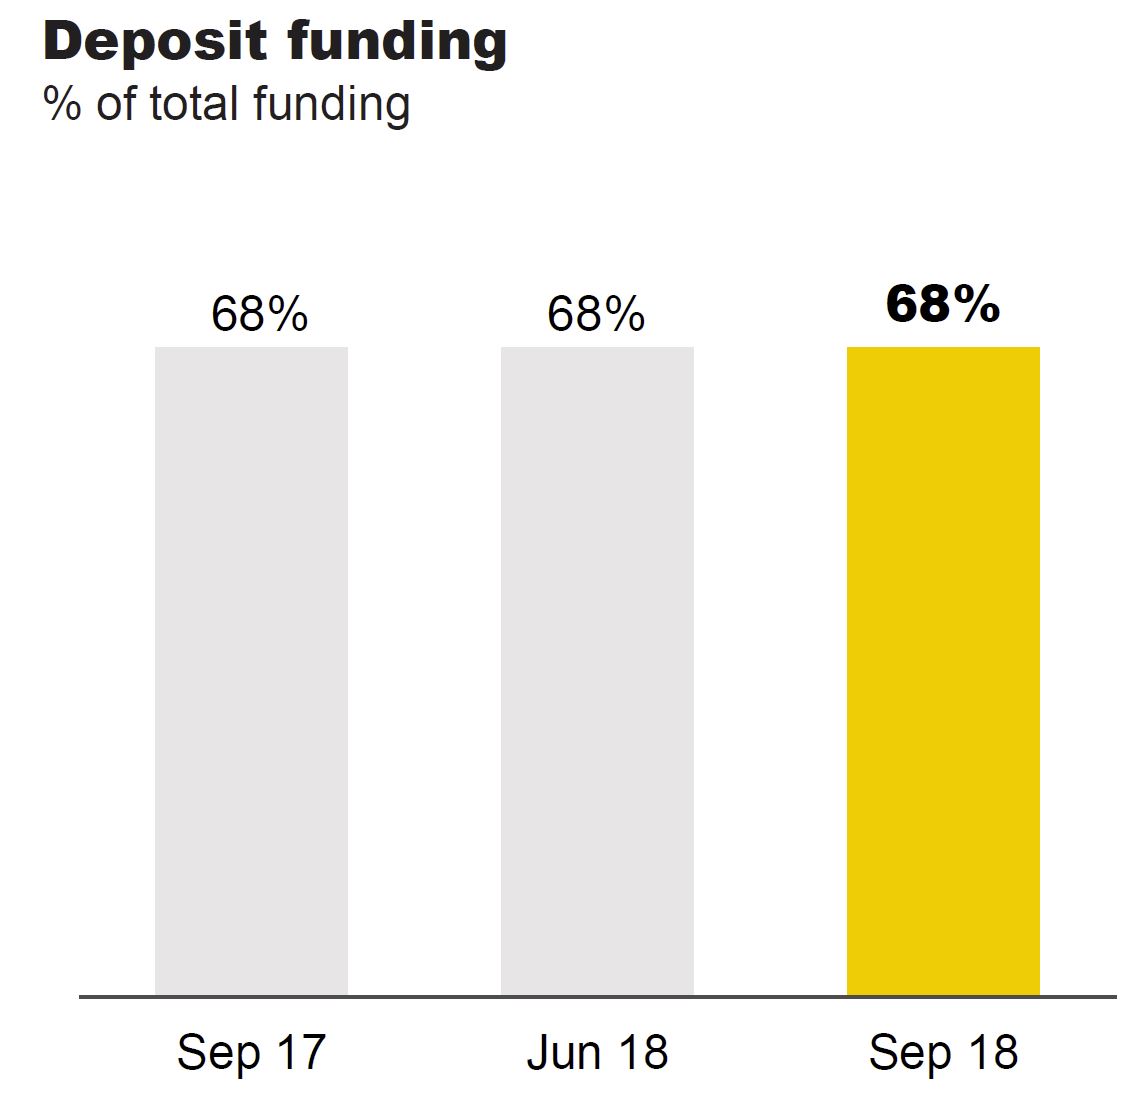
Customer deposit funding remained at 68%.

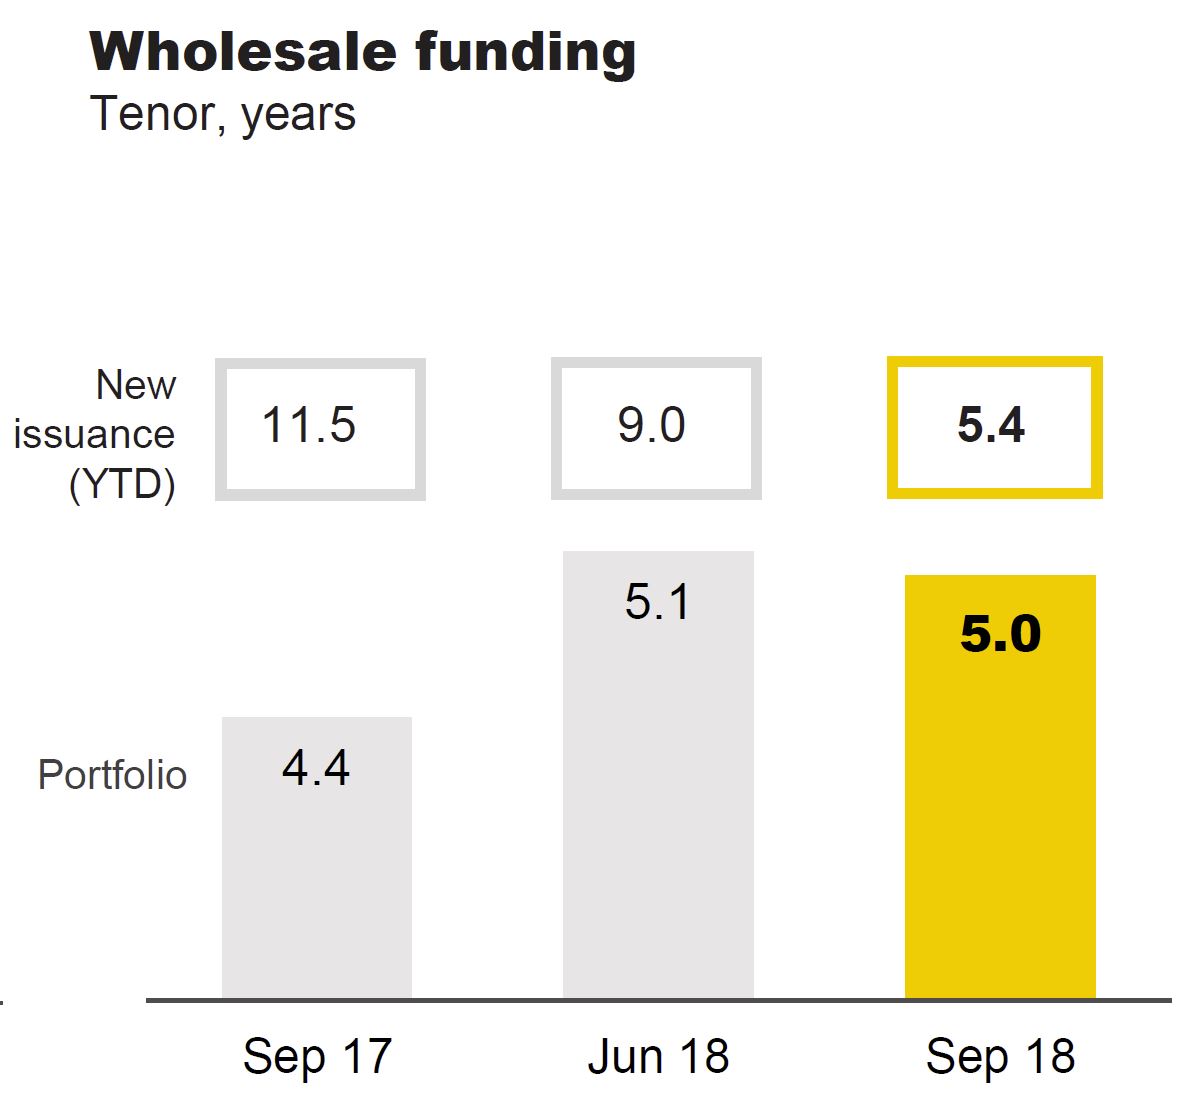
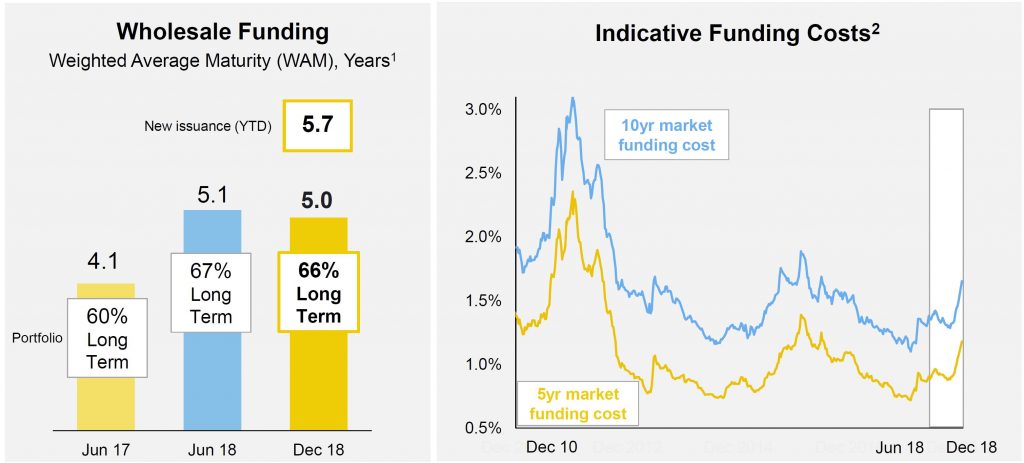
The average tenor of the long term wholesale funding portfolio at 5.0 years.

The Group issued $8.8 billion of long term funding in the quarter.

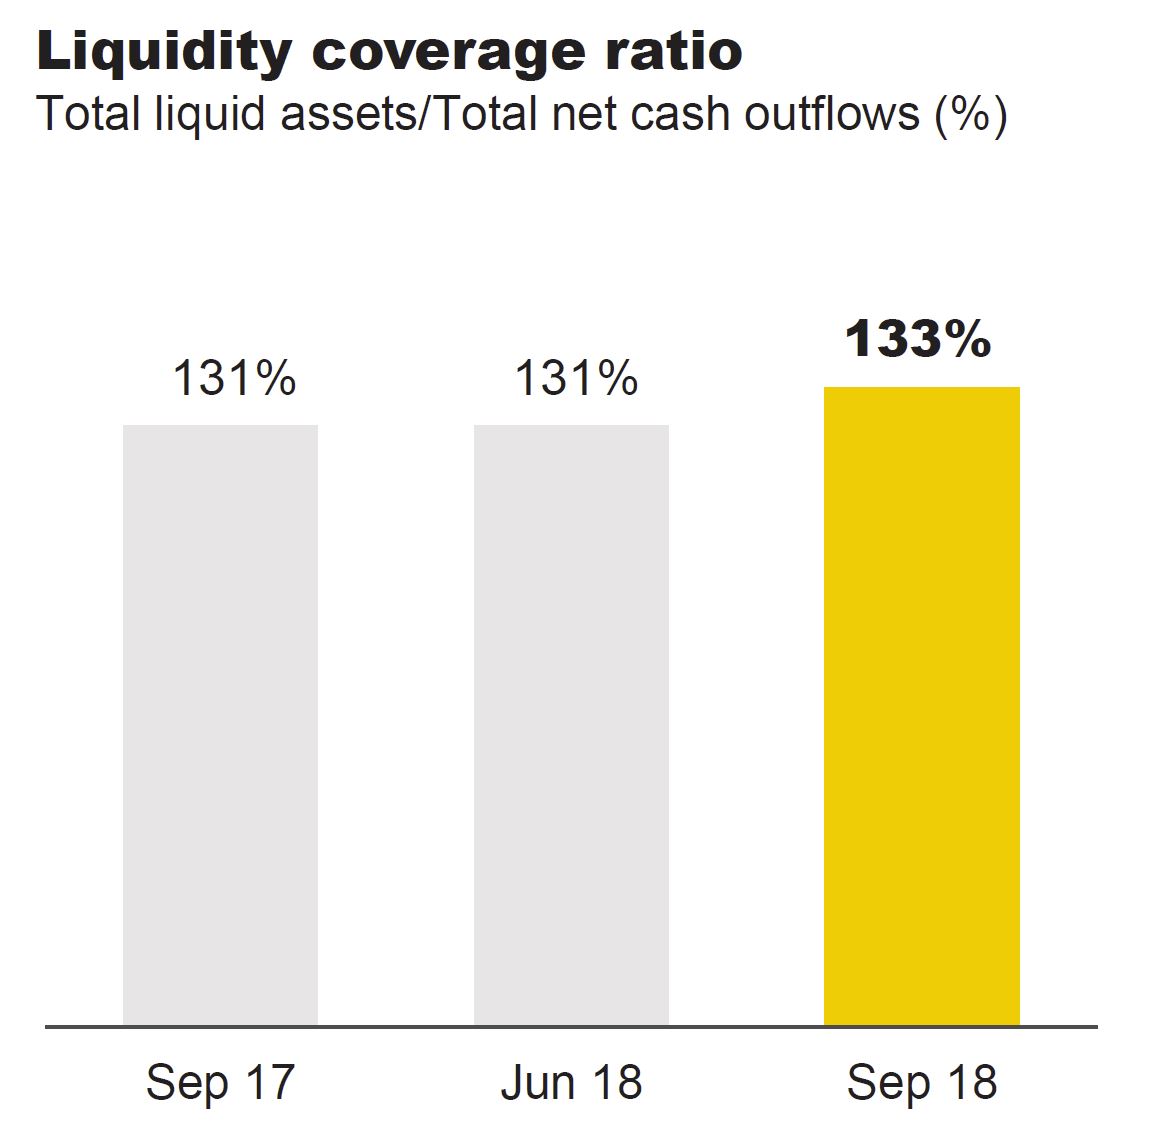
The Liquidity Coverage Ratio (LCR) was 133% at September 2018, up from 131% at June 2018.

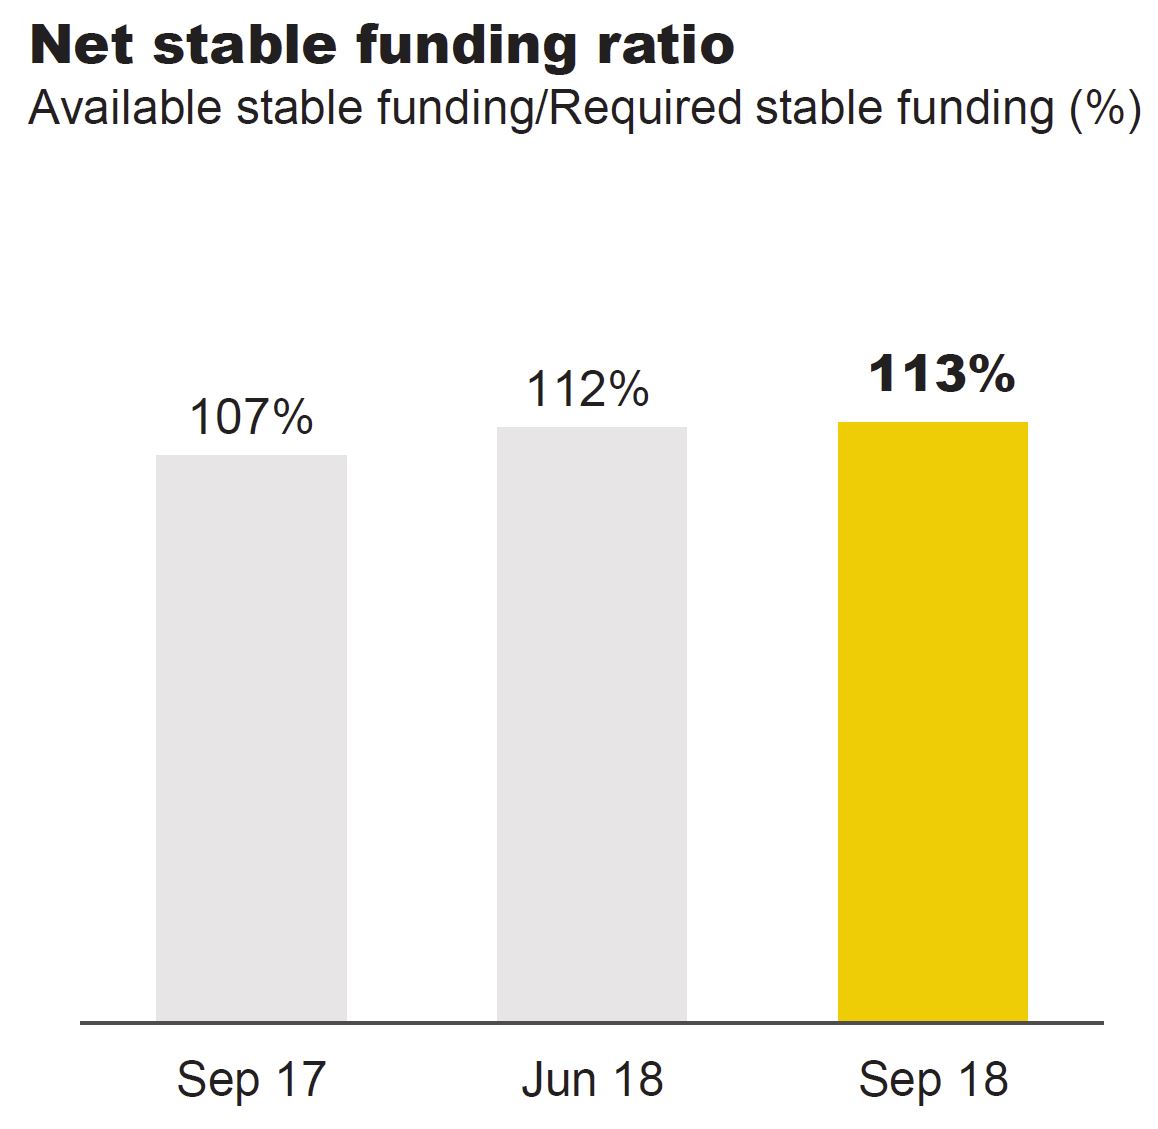
The Net Stable Funding Ratio (NSFR) was 113% at September 2018, up from 112% at June 2018.

The Group’s Leverage Ratio remained relatively stable across the quarter at 5.5% on an APRA basis and 6.2% on an internationally comparable basis.

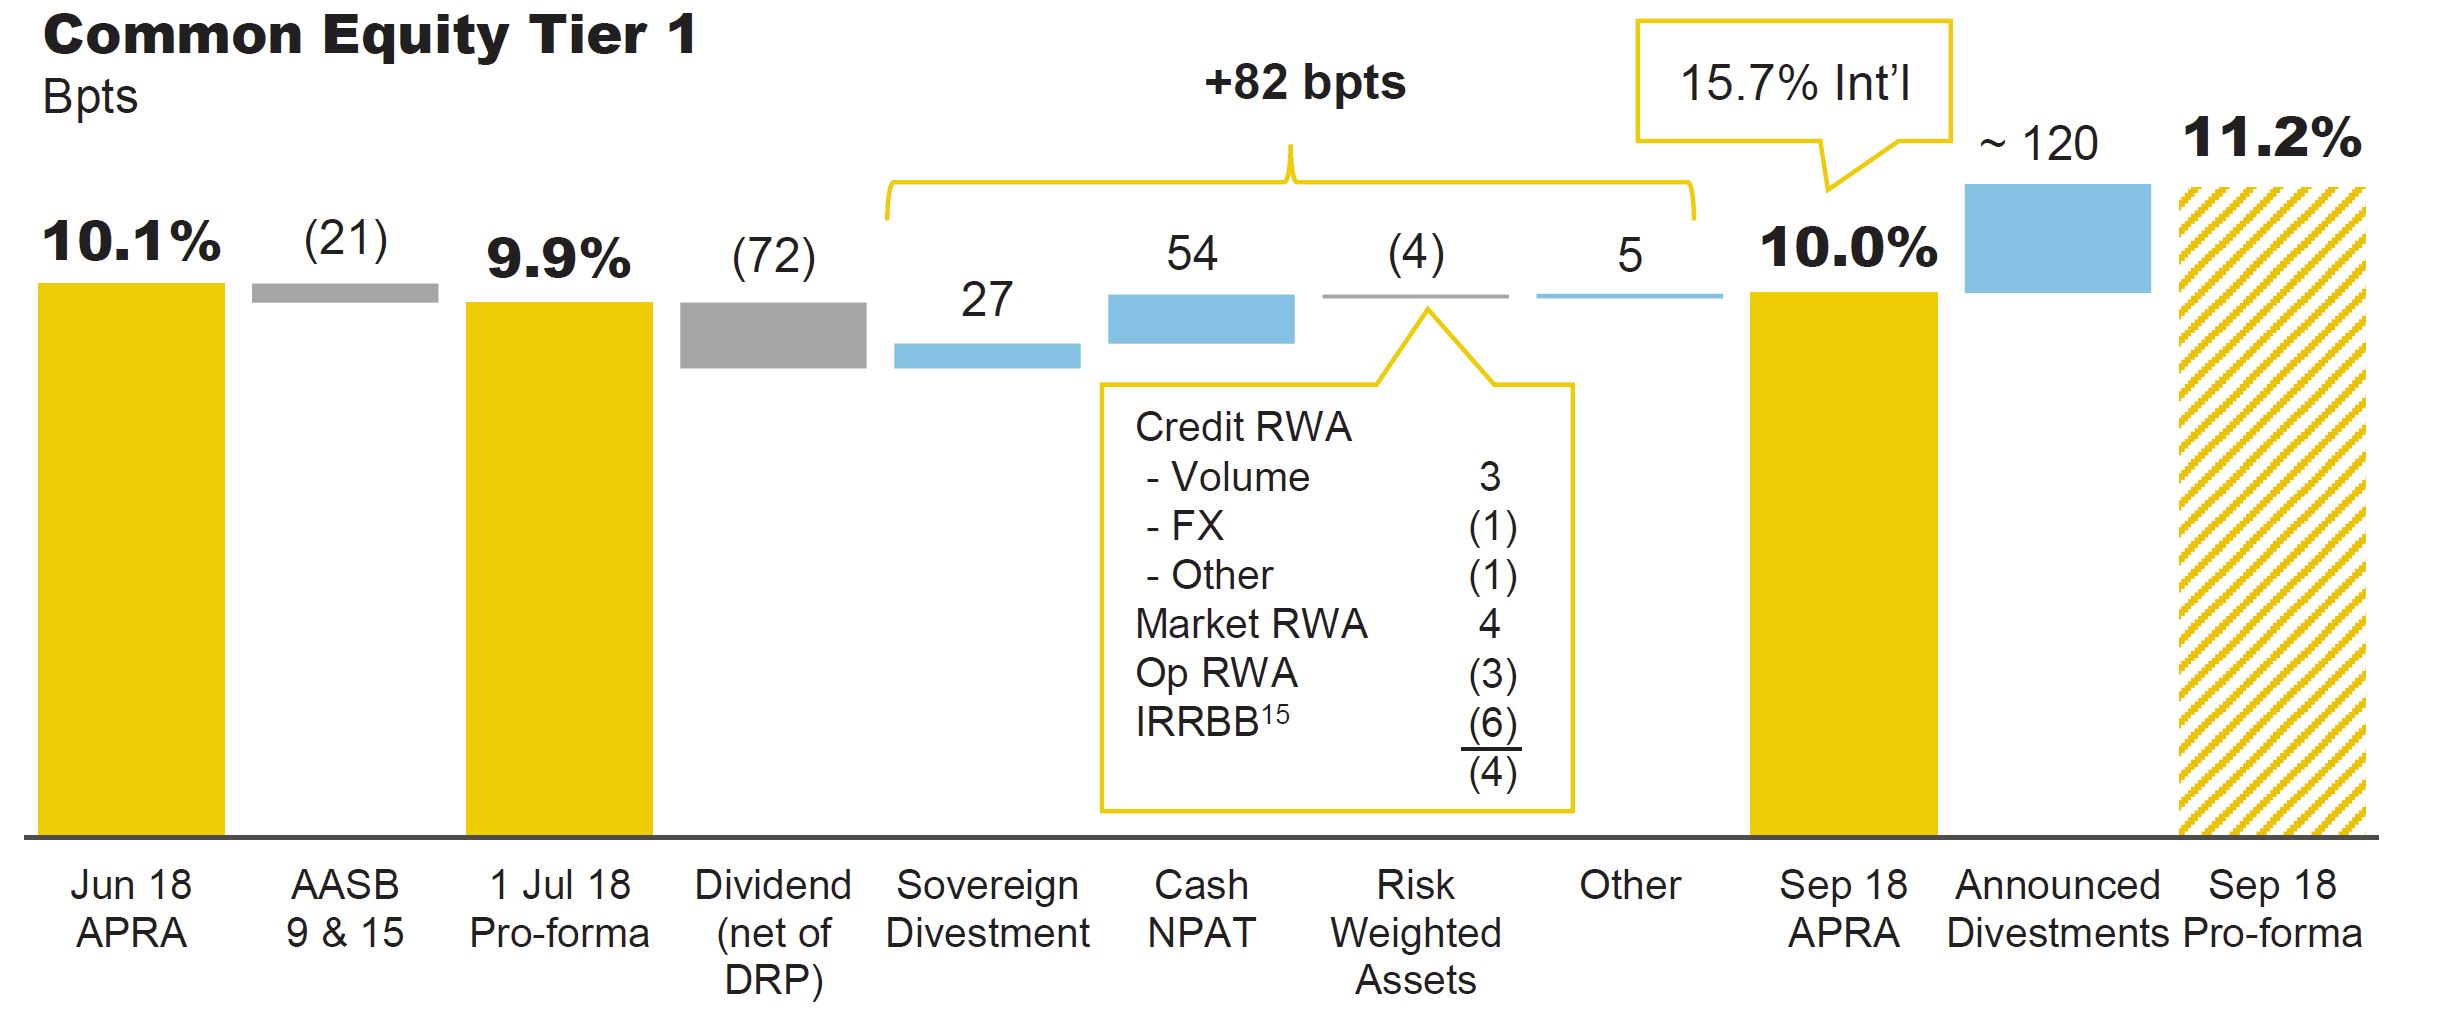
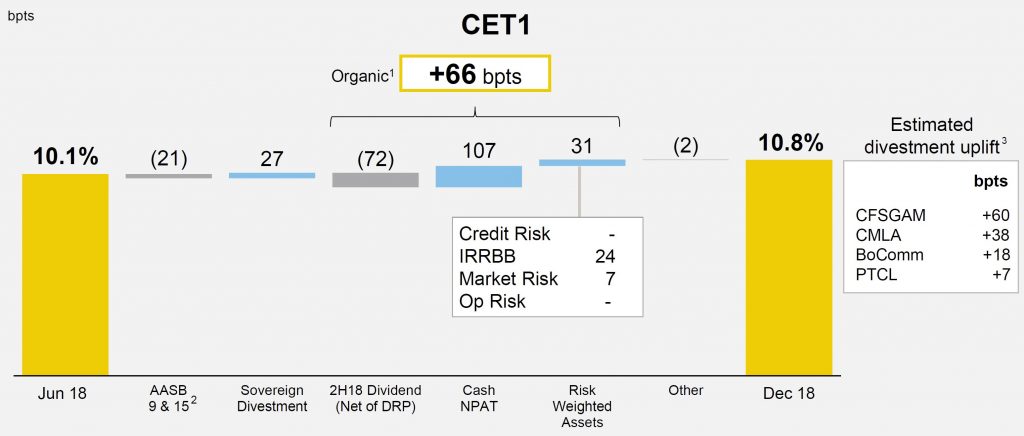
The Common Equity Tier 1 (CET1) APRA ratio was 10.0% as at 30 September 2018. After allowing for the impact of the implementation of AASB 9 and 15 on 1 July 2018, and the 2018 final dividend (which included the issuance of shares in respect of the Dividend Reinvestment Plan), CET1 increased 82 bptsin the quarter. This was driven by a combination of capital generated from earnings and the benefit from the sale of the Group’s New Zealand life insurance operations.

CBA has previously announced the divestment of a number of businesses as part of its strategy to build a simpler, better bank. These divestments are subject to various conditions, regulatory approvals and timings, and include the sale of the bank’s global asset management business, Colonial First State Global Asset Management (CFSGAM, expected completion mid calendar year 2019) and the sales of its Australian life insurance business (“CommInsureLife”), its non-controlling investment in BoCommLife and its 80% interest in the Indonesian life insurance business, PT Commonwealth Life (all expected to complete in the first half of calendar year 2019). Collectively, these divestments will provide an uplift to CET1 of approximately 120 bpts, resulting in a 30 September 2018 pro-forma CET1 ratio of 11.2%.

In June 2018, CBA announced its commitment to the demerger of NewCo, which includes Colonial First State, Count Financial, Financial Wisdom, Aussie Home Loans and CBA’s minority shareholdings in ASX-listed companies CountPlusand Mortgage Choice. The demerger process is expected to be completed by late calendar year 2019, subject to shareholder and regulatory approvals. CFSGAM will no longer form part of NewCo, following the recent announcement of an agreement to sell this business to Mitsubishi UFJ Trust and Banking Corporation.