The Calm Before The Storm – The Property Imperative Weekly – 23 June 2018

Welcome to the Property Imperative weekly to 23th June 2018, our digest of the latest finance and property news with a distinctively Australian flavour.

Watch the video, listen to the podcast, or read the transcript.

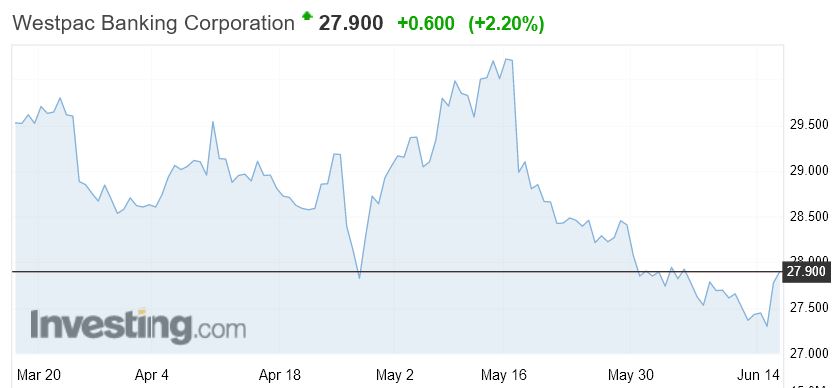
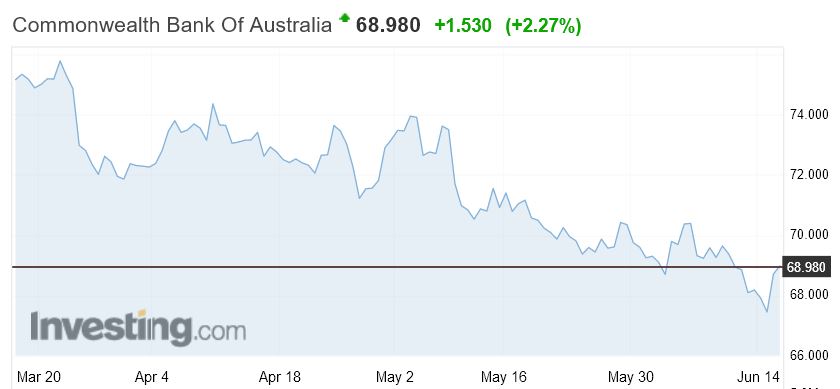
There is something weird going on at the moment. This week bank stocks rose significantly, with CBA up 1.2% on Friday as the AUSTRAC issue was finally put to be in court; Westpac up 1%, NAB up 1.2% and ANZ up a massive 2.8% as the bank announced a further stock buyback. The banks comprise more than a quarter of our market, so no surprise the ASX 200 went higher in the week, though fell back slightly by Friday, reflecting further concerns about the escalating trade wars. Potentially traders closing out their positions, the end of the financial year have driven prices higher but next week a number of key stocks go ex-dividend, suggesting this we may have seen the top.  The lower Aussie dollar may also be helping, (expect it to continue to fall) as it makes Australian stocks cheaper on an international basis, and yields are still pretty good, representing better value to investors than many emerging markets which are entering a difficult phase.

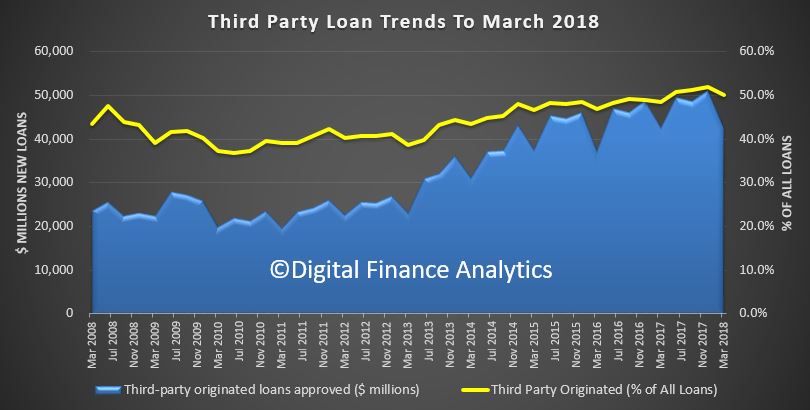
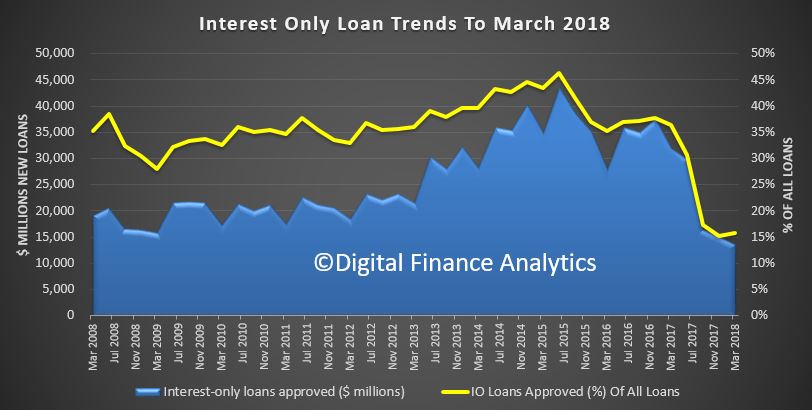
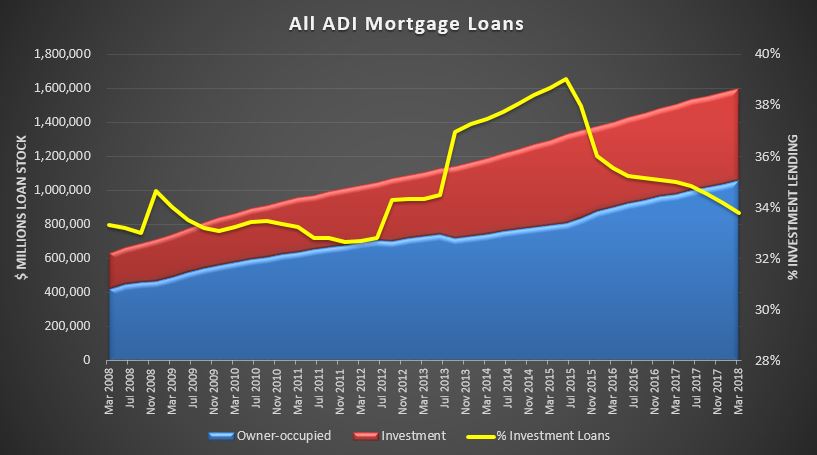
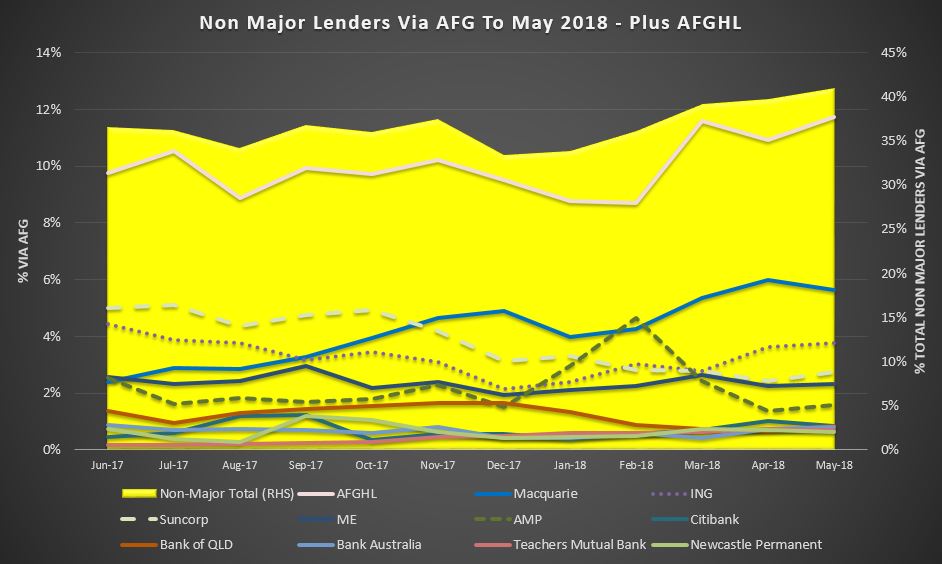
But scratch below the surface and things look less certain. For example, APRA’s March 2018 property exposure data showed a significant fall in investment lending, and a massive fall in interest only loans, at 16%, dropping the stock of loans by $93 billion, plus more loans are being approved outside normal serviceability criteria, and lending standards tighten. We discuss this in more detail in our post “The State of Mortgage Lending In Three Slides”.  Remember that our analysis shows that around $120 billion of interest only loans will require refinancing each year for the next few years, and many – around 20% – won’t pass muster, meaning they have to switch to more expensive loans, or sell.  ABC’s 7:30 did a segment on IO Loans this week.

As UBS put it, the data signals the “end of the beginning of the housing market correction” and the risks of a credit crunch is rising. Mortgage underwriting standards continue to tighten, as lenders finally comply with the existing legalisation and guidelines, the Royal Commission will not necessarily need to recommend tighter rules, the question in our view is compliance with the existing ones – APRA please note!

UBS also made the point that Debt To Income has been in focus since APRA directed ADI’s to develop “internal risk appetite limits on the proportion of new lending at very high DTI levels [>6x], and policy limits on maximum DTI levels for individual borrowers” in April 2018. Prior to this, DTI was not a focus, largely because neither APRA nor the banks had reliable data available. However, that will soon change with the introduction of Comprehensive Credit Reporting (CCR – the first phase of Open Banking) expected on July 1 2018. They conclude that If APRA does decide to impose a hard cap on loans to customers with a DTI > 6x we should expect a further tightening in credit availability.

Morgan Stanley discussed what they call Macroprudential 3.0 saying that this is consistent with international trends restricting consumer leverage in a low interest rate environment.  They say the adoption of DTI limits provides a further restriction and may become a binding constraint for customers who have very low assumed living expenses or purchased multiple investment properties. The sustainability of Sydney house prices at >9x median income and Melbourne at ~8x median income become problematic when borrowing limits are restricted to 6x income. A 6x DTI limit assuming a 20% deposit would put the median Sydney house out of range for the median buyer.

The ABS home price data confirmed falls in the major centres. We discussed this in our post “Property Prices are Officially falling”. You can watch our video on this, or listen to our podcast, (our podcasts by the way are being well received, judging by the number of listens).  As the ABS said “Sydney recorded the third consecutive quarter of falling property prices down 1.2 per cent and the first annual price fall down 0.5 per cent since the March quarter 2012, while Melbourne property prices fell 0.6 per cent, the first quarterly price fall since September quarter 2012”. We also contributed to a piece on ABC’s The Business, discussing the future outlook for prices.

More recent data from CoreLogic continues to confirm falls, with weekly drops in Sydney, Melbourne, Brisbane and rises in Adelaide and Perth. But of course, Sydney prices on average are still up 66.8% from their previous lows, Melbourne 56.3% Brisbane 20.9%, Adelaide 18.9% and Perth 0.9%. This suggests that further falls in the eastern states are likely as credit dries up. And elsewhere CoreLogic made the point that more property is being listed, its taking longer to sell, and it has become a buyers’ market saying “Overall as the housing market is slowing, the number of properties for sale is climbing in Sydney and Melbourne, providing for less urgency amongst buyers and more time to negotiate. As stock levels rise, buyers become more empowered and vendors may need to rethink their pricing expectations and marketing strategies.”

SQM research also released this week showed that rental vacancies decreased over the year in Adelaide down 0.4%, Perth down -1.0%, Brisbane down 0.6% and Canberra down 0.2%, but significantly, increases were recorded in Sydney up 0.8%, Darwin up 0.2% and Hobart up 0.2%, and Melbourne’s vacancy rate was flat. Annual asking rents are rising faster than incomes in Melbourne, Canberra and Hobart, while weak or falling asking rents were recorded in Sydney, Adelaide, Brisbane, Perth and Darwin. SQM said “there are considerably more vacancies in Sydney now compared to a year ago, so landlords have lowered their asking rents slightly, which is favouring renters”.  More pressure on investors then.

Macquarie said that they expect the current modest rate of decline in national dwelling prices to continue for some time, but they suggest a fall of only around 2% over the course of 2018. Over the next couple of years, they expect national prices to have fallen 4-6% from the peak, with Sydney prices forecast to be down around 10% from the mid-2017 peak. Australia has had six previous episodes of declining housing prices since 1980, with the peak-to-trough range of 2.5% to 8%. Nearly all previous corrections occurred following interest rate rises, a drag unlikely to be repeated anytime soon in this cycle. To which I reply, credit tightening is continuing and the BBSW rate is rising, so past performance may not be helpful here.

ANZ also opined on home prices. We now expect to see peak-to-trough price declines of around 10 per cent in Sydney and Melbourne, with smaller declines elsewhere. This cycle is being driven by tighter credit, rather than higher interest rates. Exactly. Sydney and Melbourne are expected to be the primary drivers of this fall, as their high prices and highly leveraged households will be more sensitive to tighter credit conditions and rising interest rates.

It’s also worth noting here the heroic assumptions in the NSW state budget which was out this week, and included a projection of future stronger auction clearance rates, after a small blip. Lower stamp duty flows will lead to a shortfall, as Moody’s observed when they said “NSW is projecting average revenue growth of 2.5% from fiscal 2019 to 2022, reflecting a drop in growth for transfer duties, particularly from housing, where the state forecasts that residential turnover will drop around 8% in fiscal 2019 and price growth will moderate. Additionally, at 2.5%, average revenue growth is expected to fall below the average expenditure growth of 3.2%. This imbalance would lead to growth in debt over the forecast period, challenging NSW’s credit profile”. So recovering home prices, and interest rate cuts are required to bring this home. As I say, heroic!

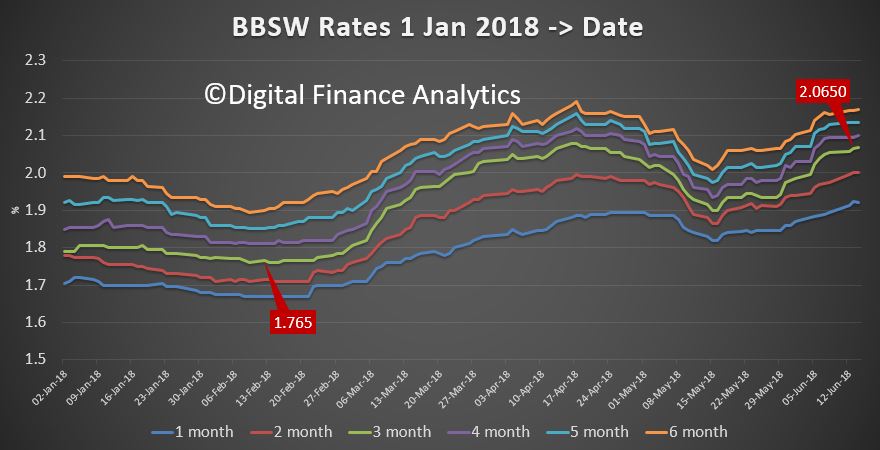
There was some interesting commentary on the ever rising benchmark Bank Bill Swap Rate (BBSW). The AFR reported that Nomura rates strategist Andrew Ticehurst, observed that multinationals outside the US are holding fewer US dollars and there is a global dimension to this starting with the US”.  Tamar Hamlyn, portfolio manager at fixed income boutique Ardea said “There’s nothing to suggest that it’s sinister just yet, we expect these things to be high as we get to quarter-end as the historical pattern shows,”. But we suspect its more about rising concerns in the risk profile of the banks, as the spread movements are larger here than in other countries.  This will put pressure on bank margins, and may force them to lift mortgage prices, or further trim rates on deposits.  Oh, and commendatory this week from the RBA suggests that official rates are not going anywhere, despite the fact that the latest minutes omitted the oft repeated clause that the next move will be up.

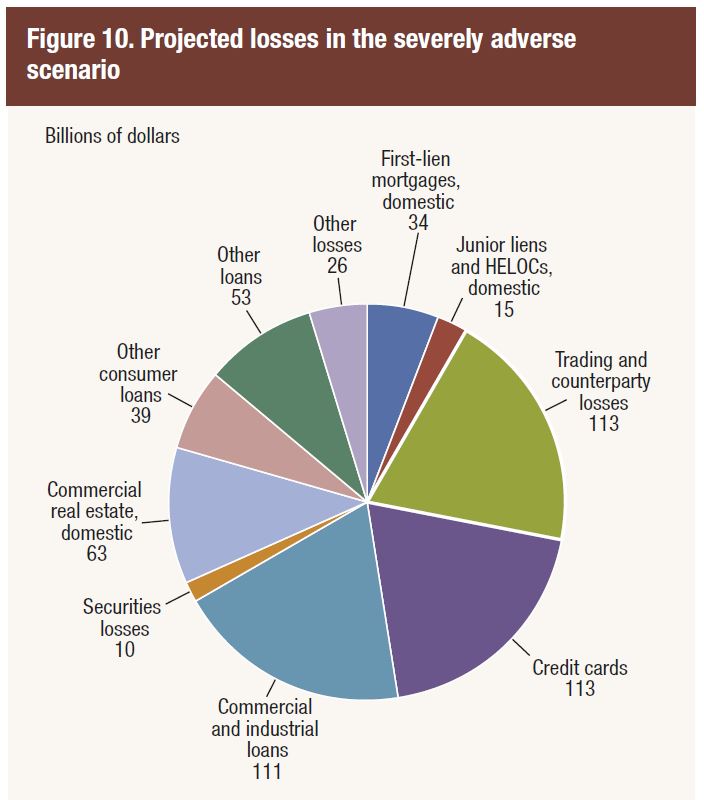
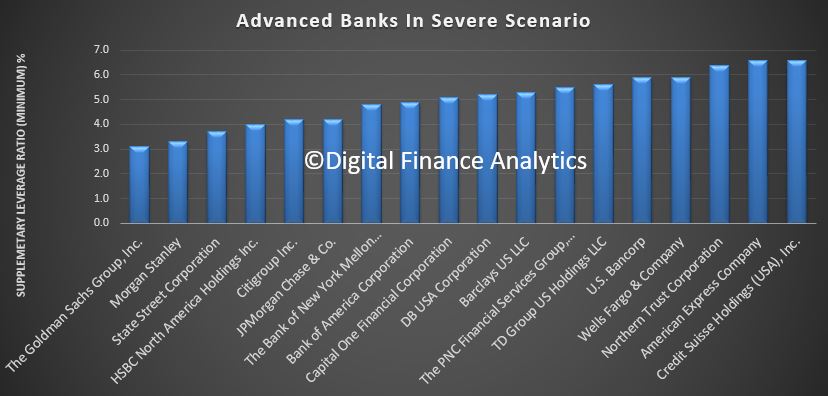
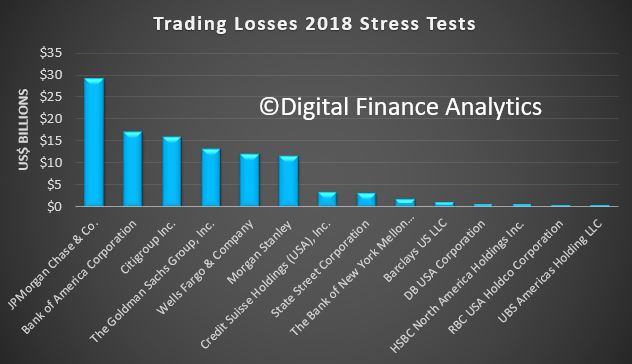
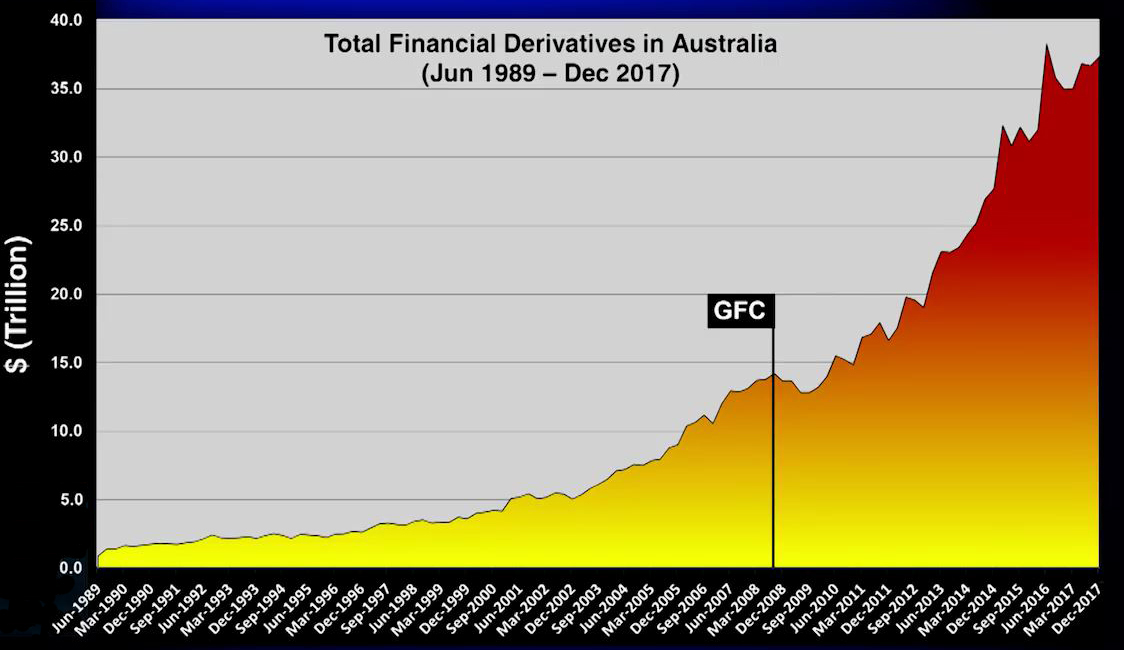
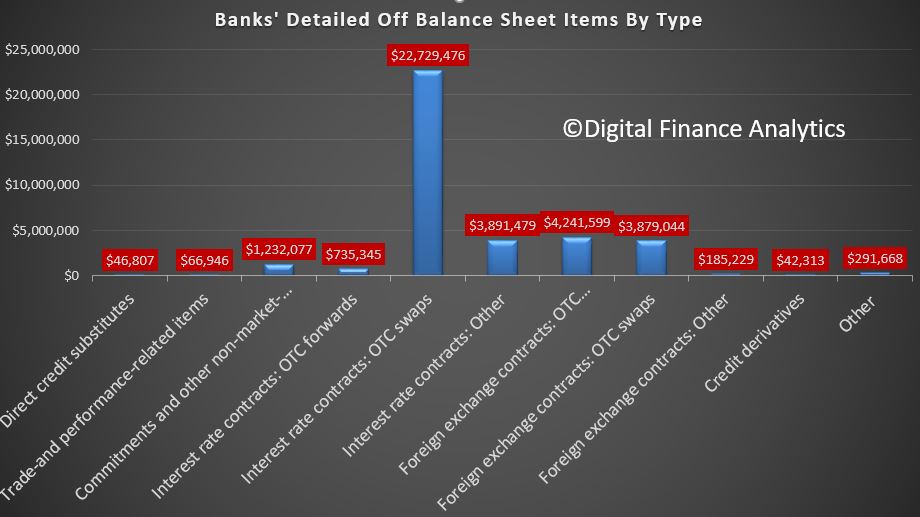
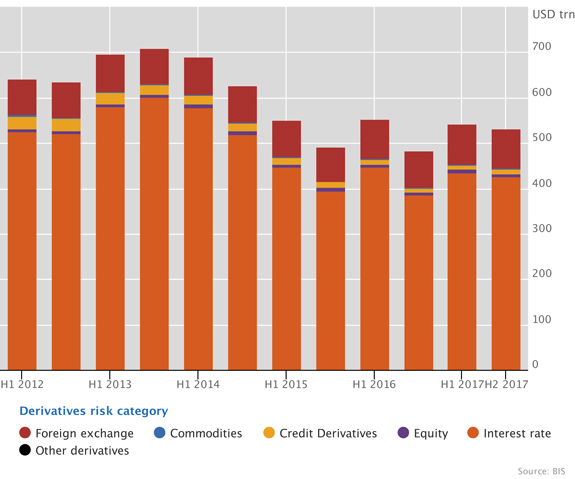
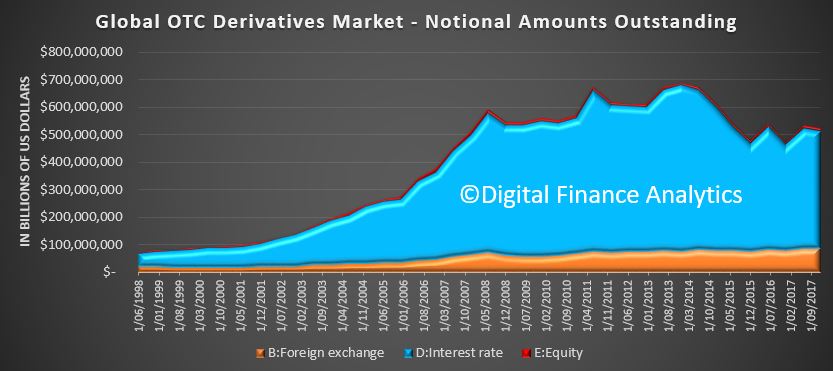
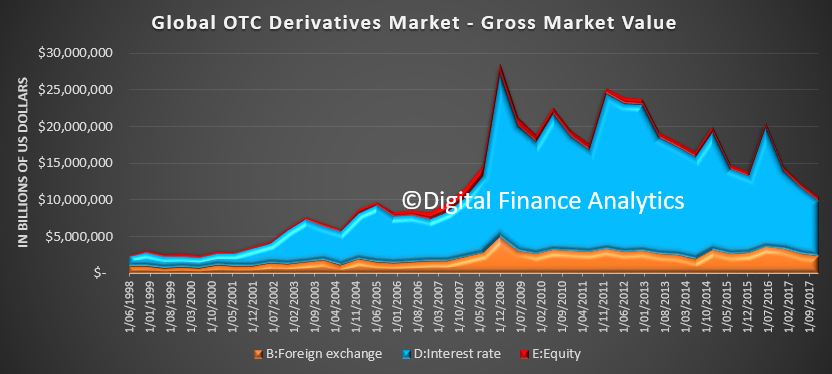
The FED released their stress testing of major US banks, and gave them a clean bill of health, though in our separate post “Testing, Testing..” we discussed the limitations of their approach.  First, losses from trading and counter-party losses were estimated at only $133 billion US dollars, stemming from 9 institutions, including $17.3 billion from Bank of America Corporation, $16.3 billion from Citigroup, $13.3 billion from Goldman Sachs, $29.4 billion from JP Morgan $29.4 billion, Morgan Stanley $11.7 billion and $12.2 billion from Wells Fargo. These estimate of losses are calibrated based on historical performance, but given the massive size of the derivatives market, this is just a best guess. We discussed the size and shape of the derivatives market recently in the $37 trillion dollar black hole post. Second, it’s hard to estimate the potential impact of contagion and freezing of the markets as happened into 2007, as each bank is modelled separately. This begs the question as to whether the system level modelling is robust enough. Especially if one major counter-party fell over during a crisis. 2007 showed the problem when trust across the markets falls, and margins widen significantly. Third the assumptions are that things will revert to normal conditions in a few years – suggesting this is a “blip type crises.” Some of the smaller banks may have performed better in the tests than they would in the real world. But the bottom line, according to the FED is that the banks can stand on their own two feet in the mother of all crises, so not excuse for any bail-out then… We will see.

Looking more broadly across the global markets, the trade war continues to threaten, leaving the major U.S. indexes nursing a weekly loss. The U.S. and China exchanged a fresh volley of trade threats, scaling back investor appetite for risker assets amid fears of a tit-for-tat trade war between the world’s two largest economies. This is in my view now getting quite serious.

However, trade war concerns failed to stem demand for tech stocks as major tech blue chips such as Facebook, Netflix and Google rallied sharply, helping the Nasdaq close at a record high this week. This despite internet retailers like eBay and Amazon coming under pressure after the U.S. Supreme Court overturned the Quill ruling, allowing states and local governments to start collecting sales taxes from internet retailers. The S&P 500 posted a weekly loss despite closing 0.25% higher Friday at 2,759.50.

OPEC agreed Friday to a modest increase in output, sending crude oil prices soaring on expectations that the fresh supply into the market would be curbed as some countries lack the capacity to raise output. OPEC said it wanted countries –part of the production cut agreement – to increase production, returning to 100% compliance with agreed quotas by 1 July 2018. Analysts said the agreement would equate to increase in production of about 600,000 barrels a day as numerous countries in the accord aren’t capable of increasing production. Crude prices were also supported by a mixed U.S. inventory report as domestic crude supplies fell for the second straight week while crude products such as gasoline and distillate increased by more than analysts had forecast. Crude futures settled 4.64% higher at $68.58 higher on Friday.

The dollar ended the week lower as trade war concerns flared up, stoking demand for safe-haven yen, while a rebound in the euro on mostly positive economic data also weighed on sentiment. EUR/USD rebounded from an 11-month low seen Thursday, prompting traders to flee the greenback despite lingering concerns over Italian political uncertainty and lower-for-longer interest rates in the Eurozone. The dollar’s sluggish end to the week comes just days after its rise to fresh 2018 highs was met by a wave of resistance despite expectations that a more hawkish Federal Reserve would provide further room for upside in the greenback. “The divergence between U.S. and rest of the world monetary policy will support longer and greater USD strength than we had anticipated,” Barclays said earlier this week in a note to clients. The dollar was also held back by yen strength supported by rising trade tensions between the U.S. and China. The dollar fell 0.36% to 94.20 against basket of major currencies on Friday.

Gold prices bounced from fresh 2018 lows this week but remained under pressure struggling to take advantage of a weaker dollar and rising safe-haven demand as sentiment on the yellow metal waned. Fearing a faster pace of Federal Reserve rate hikes, investors have shunned the yellow metal even as safe-haven demand grows on the back of an ongoing trade spat between the U.S. and China.

Fresh selling was seen in Bitcoin on Friday, as the crypto hit its lowest level since February after Japan’s regulatory crackdown on the industry triggered a selloff. Japan’s largest crypto exchange, bitFlyer, suspended the creation of new accounts after Japan’s Financial Services Agency ordered several cryptocurrency exchanges to step up their efforts to combat money laundering. That sent shockwaves through the crypto industry amid fears other crypto exchanges in Japan could also be forced to scale back operations as they seek to beef up their practices. As Japan is the largest market for bitcoin trading, the threat of a reduction in fresh fund inflows, sparked selling across cryptos, wiping more than $20 billion from the crypto market in under 24 hours. The total crypto market cap fell to about $261 billion, from about $289 billion Thursday. Bitcoin was down to 6,015, down 10%. Again highlighting the volatility of the sector.

So, to conclude, while many of the major indicators were higher, this could well be the calm before the storm, as below the hood, the data does not lie. Locally, the tighter credit supply will spill over to lower home prices, and as the next round of the Royal Commission starts next week, we think the banks will be back in the spotlight, but not in a good way.

We are witnessing a slowly deflating property bubble, for now

From The Conversation.

In a week that was fairly light on data releases, let’s return to Australia’s perennial favourite topic – house prices. Painful though it may be for existing property owners who are selling, we are witnessing what a bubble slowly deflating back to reality looks like.

Data released Tuesday showed that across Australia’s eight capital cities prices fell 0.7% in the first quarter of 2017. Sydney was hardest hit, with prices down 1.2%. Melbourne and Brisbane experienced 0.6% declines and Perth prices were down 0.9%.

Price declines were more subdued over the previous 12 months, or were even still up over the period. Sydney prices were down 0.5% on the year, but Melbourne prices were still up strongly (6.2%) and Brisbane showed 1.6% annual growth. Perth, where prices have been under pressure for some time, registered a 1.5% fall over the last year.

This downward price pressure is consistent with a reduction in auction clearance rates documented by CoreLogic. Last week, clearance rates averaged 56.9% across the country and just 55.8% in Sydney and 58.7% in Melbourne. Compare this to a year ago when the capital city average was 66.7%, Sydney was at 68.0% and Melbourne at 71.0%. And this doesn’t even factor in that auction volumes have dropped this year.

So here’s the deal. Fewer people are trying to sell their residential properties. Those that try are having less success in doing so. Those that do succeed are getting lower prices.

Yet it pays to take a longer-term view. As the minutes of the last RBA board meeting noted:

… housing prices were still 40% higher in Sydney and Melbourne than at the beginning of 2014, while housing prices in Perth had fallen by around 10% over the same period.

The big question is whether the housing market will continue to deflate slowly, or whether there is going to be an abrupt “pop”.

A big correction to property prices would require a major trigger. The most likely candidate for that trigger is interest-only loans.

More and more attention is finally being paid to dangers caused by Australia’s profligate use of such loans. As I wrote last year, at the peak a staggering 40% of residential mortgages in Australia were interest only.

The Australian Prudential Regulation Authority (APRA) stepped in last year, capping new interest-only loans at 30% of new loans. That, along with a tightening of underwriting standards by banks, has led to a sharp drop in such loans.

The latest figures put the proportion of interest-only loans at 15.2% of new issuances.

The RBA has been pushing an upbeat story about how this shakes out. As they tell it, the A$120 billion a year of interest-only loans coming due will be smoothly transitioned to principal-and-interest loans for most people.

Well, perhaps. I certainly hope so.

But for many people this transition will involve increases in monthly repayments of 30-40%. At a time when wages growth has been persistently sluggish, many people don’t have much wiggle room.

Interest-only loans typically have a five-year term and then need to be refinanced or become principal-and-interest loans. For a whole lot of folks, an interest-only rollover ain’t going to happen. Worse, the largest volumes of interest-only loans were written in 2013-2016.

So we are about to see a three-year wave of shifts to principal-and-interest loans.

Worse still, the loans originated in those years were heavily mediated by mortgage brokers whose incentives were all about moving volume, not quality. Widely cited research from investment bank UBS about the prevalence of so-called “liar loans” gives one every reason to be really worried about the ability of these borrowers to make a mortgage payment that has increased by a third or more per month.

And the rosy scenario the RBA keeps pushing involves look at the average buffer and embedded equity that households have. But that misses the economics 101 point that it is the marginal borrower that determines equilibrium prices, not the average.

If I’m selling hot dogs I don’t care what the average person is willing to pay for a hot dog, I care what the last person I might sell to is willing to pay, for she determines the price.

And, in a moment of gaping honesty eight weeks ago, the RBA’s Chris Kent highlighted the difference between the average and marginal borrower, saying:

… about half of owner-occupier loans have prepayment balances of more than six months of scheduled payments. While that leaves half with only modest balances, some of those borrowers have relatively new loans.

It doesn’t matter than some of them are new borrowers – other than that they bought at the height of the bubble, making them more susceptible to financial stress than other borrowers. The fact is that a whole bunch of folks are on the wire. If their payments go up they are going to struggle to make them. And if a lot need to sell at once then, as they say at NASA, “Houston, we have a problem.”

The air may fizzle out of the Australian balloon, or it may burst violently. Either way we should be asking hard questions about why APRA waited so late to act on interest-only loans, liar loans and underwriting standards in general. Very hard, very public questions.

Author: Richard Holden, Professor of Economics and PLuS Alliance Fellow, UNSW

FED Passes ALL The US Bank In Their 2018 Stress Tests

The 2018 results from the Federal Reserve bank stress testing are out, and as normal they include the results for all 35 named institutions, a laudable degree of transparency compared with the Australian version!

The Fed says that all 35 Banks will be fine, even if stocks crash by 65%, the volatility index reaches 60, home prices fall 30% and commercial real estate drops 40% all at the same time.

They say that in the aggregate, the 35 firms would experience substantial losses under both the adverse and the severely adverse scenarios but could continue lending to businesses and households, due to the substantial accretion of capital since the financial crisis. So that’s alright then…

Aggregate losses at the 35 firms under the severely adverse scenario are projected to be US$578 billion and the net income before taxes is projected to be −US$139 billion.

The aggregate Common Equity Tier 1 (CET1) capital ratio would fall from an actual 12.3 percent in the fourth quarter of 2017 to its minimum of 7.9 percent over the planning horizon. Since 2009, the 35 firms have added about $800 billion in common equity capital.

Goldman Sachs ended up with a Tier 1 minimum supplementary leverage ratio (SLR) of 3.1, just exceeding the required 3.0 minimum the Fed set for its annual capital plan, the lowest among participating banks. However,  Morgan Stanley was next, at 3.3, then State Street at 3.7. The others were above 4.

Projected aggregate pre-provision net revenue (PPNR) is $492 billion, and net income before taxes is projected to be −$139 billion.

Some US outposts of European banks are most at risk in this analysis, together with some of the big investment banks.

Some observations.

First, losses from trading and counter-party losses were estimated at $133 billion, stemming from 9 institutions, including $17.3 billion from Bank of America Corporation, $16.3 billion from Citigroup, $13.3 billion from Goldman Sachs, $29.4 billion from JP Morgan $29.4 billion, Morgan Stanley $11.7 billion and $12.2 billion from Wells Fargo.

These estimate of losses are calibrated based on historical performance, but given the massive size of the derivatives market, this is just a best guess. We discussed the size and shape of the derivatives market recently in the $37 trillion dollar black hole.

Second, its hard to estimate the potential impact of contagion and freezing of the markets as happened into 2007, as each bank is modelled separately. This begs the question as to whether the system level modelling is robust enough. Especially if one major counter-party fell over during a crisis. 2007 showed the problem when trust across the markets falls, and margins widen significantly.

Third the assumptions are that things will revert to normal conditions in a few years – suggesting this is a “blip type crises.” Some of the smaller banks may have performed better in the tests than they would in the real world.

But the bottom line, according to the FED is that the banks can stand on their own two feet in the mother of all crises, so not excuse for any bail-out then… We will see.

That said, the analysis is the most comprehensive in the world. Its worth reading the detail.

The Federal Reserve has established frameworks and programs for the supervision of its largest and most complex financial institutions to achieve its supervisory objectives, incorporating the lessons learned from the 2007 to 2009 financial crisis and in the period since. As part of these supervisory frameworks and programs, the Federal Reserve assesses whether bank holding companies BHCs with $100 billion or more in total consolidated assets are sufficiently capitalized to absorb losses during stressful conditions, while meeting obligations to creditors and counterparties and continuing to be able to lend to households and businesses.

This annual assessment includes two related programs:

  • Dodd-Frank Act supervisory stress testing is a forward-looking quantitative evaluation of the impact of stressful economic and financial market conditions on firms’ capital.
  • The Comprehensive Capital Analysis and Review (CCAR) consists of a quantitative assessment for all firms, and a qualitative assessment for firms
    that are LISCC or large and complex firms.

For this year’s stress test cycle (DFAST 2018), which began January 1, 2018, the Federal Reserve conducted supervisory stress tests of 35 firms.

The adverse and severely adverse supervisory scenarios used in DFAST 2018 feature U.S. and global recessions. In particular, the severely adverse scenario is characterized by a severe global recession in which the U.S. unemployment rate rises by almost 6 percentage points to 10 percent, accompanied by a global aversion to long-term fixed-income assets. The
adverse scenario features a moderate recession in the United States, as well as weakening economic activity across all countries included in the scenario.

In conducting its supervisory stress tests, the Federal Reserve calculated its projections of each firm’s balance sheet, risk-weighted assets (RWAs), net income, and resulting regulatory capital ratios under these scenarios using data on firms’ financial conditions and risk characteristics provided by the firms and a set of models developed or selected by the Federal Reserve. For DFAST 2018, the Federal Reserve updated the calculation of projected capital to reflect changes in the tax code associated with the passage of the Tax Cuts and Jobs Act (TCJA) in December 2017. As in past years, the Federal Reserve also enhanced some of the supervisory models to incorporate new data, where available, and to improve model stability and performance. The enhanced models generally exhibit an increased sensitivity to economic conditions compared to past years’ models.

The results of the DFAST 2018 projections suggest that, in the aggregate, the 35 firms would experience substantial losses under both the adverse and the severely adverse scenarios but could continue lending to businesses and households, due to the substantial accretion of capital since the financial crisis. Over the nine quarters of the planning horizon, which for DFAST 2018 begins in the first quarter of 2018 and ends in the first quarter of 2020, aggregate losses at the 35 firms under the severely adverse scenario are projected to be $578 billion. This includes losses across loan portfolios, losses from credit impairment on securities held in the firms’ investment portfolios, trading and counterparty credit losses from a global market shock, and other losses.

Projected aggregate pre-provision net revenue (PPNR) is $492 billion, and net income before taxes is projected to be −$139 billion. In the severely adverse scenario, the aggregate Common Equity Tier 1 (CET1) capital ratio would fall from an actual 12.3 percent in the fourth quarter of 2017 to its minimum of 7.9 percent over the planning horizon. The aggregate CET1 ratio is projected to rise to 8.7 percent by the end of the planning horizon.

In the adverse scenario, aggregate projected losses, PPNR, and net income before taxes are $333 billion, $467 billion, and $125 billion, respectively. The aggregate CET1 capital ratio under the adverse scenario would fall to its minimum of 10.9 percent over the planning horizon.

Here are the scenarios.

The State Of Mortgage Lending In Three Slides

APRA released their Property Exposures Data to March 2018 today.

We will delve into the detail later, but three charts tell the story, looking across the market of ADI’s with more than $1 billion of loans.

;

First, the number of loans being approved outside current serviceability standards has lifted to around 5% of all new loans. This reflects tighter controls in the banks, so they narrowed the serviceability aperture. But is also suggests that some loans are still getting funded under questionable parameters. Remember loan underwriting standards continue to tighten, so this will be an important measure to watch ahead.

Second, the volume and share of loans via brokers, having reach a peak last year look to be falling, reflecting first lower absolute volumes of new loans, and second a preference by the banks to use their own channels. We will be watching the mix by channel in the months ahead, our thesis is mortgage brokers are going to have to work a lot harder down the track!

And third, the doozy, the share of interest only new loans have fallen to 15% of loans, and the value written in also down. So the APRA inspired intervention (better late then never) is hitting home. Again we need to watch whether there is a rebound as settings are tweaked to try and keep home prices falling further.

OK, I lied, there is a fourth slide. Despite all the tightening, the total balances grew again in March to $1.6 trillion, despite investment loans falling to 33.8% of the portfolio. So lets be clear, household debt is still rising, with investment loans rising 0.4% in the quarter and owner occupied loans rising by 2%. Or over the past year, 2.6% and 8% respectively. Still too hot in the current climate, in my view. So more tightening is needed, and I suspect a harder Debt to Income hurdle of 6% is where it will bite.

A Summary Of My Current Views

Caddie’s Content and Engagement Manager, Chris Barnett, recently caught up with Founding Principal of Digital Finance Analytics, Martin North, to get his insights on the current economic landscape, including the RBA, interest-only loans, the housing market and plenty more.

Martin North - DFA

Read on to find out what Martin had to say…

Chris: The Reserve Bank recently set the Australian record for the longest consecutive period without a rate movement. There is no consensus in the industry as to when rates will rise, some are predicting spring, other say it won’t be till 2020. When do you forecast rates will rise and why?

Martin: The RBA is driven most strongly by its inflation mandate, plus the desire for financial stability.

Their public statements are to the effect that the next rate move is likely to be up, not down.

But given the current economic and employment data, plus wages growth we see little evidence that a rate rise will happen any time soon.

However, there are more risks on the downside, as the FED lifts rates in the US, and so flows through to the capital markets.

This could translate to banks here needing to lift their mortgage rates (the BBSW has been somewhat higher of late).

Of more concern would be a local or global economic shock, requiring a rate cut. Given the number of uncertainties (from the middle east, North Korea, Italy, Trade Wars etc.) the RBA may have to react to a downturn.

So the RBA may cut rates to counteract this effect, as they are conscious of the pressure on household budgets.

That said, rates are low now, so there is little wriggle room, and banks may not pass on cuts at these low levels.

Our central scenario is no movement for at least the next 12 months.

Chris: One of the buzz words in the property market is “interest only loans”, you have regularly written about the risk these loans pose to the property market. What key warning indicators should Financial Advisers been look for regarding a client’s interest only loan?

Martin: Interest only loans were in vogue up until a few months back, thanks to lower servicing costs and the ability to maximise the interest tax offset by keeping capital repayments to a minimum.

At an industry level more than 40% of loans were being written as interest only loans, mainly to property investors. Some lenders have more than half their loan portfolios in interest only.

However, there are higher risks to interest only lending, especially if a slowing market, because the assumption often is that the capital, which needs to be repaid at some point, requires the sale of the asset.

In a falling market this may not work, and from our surveys around half of interest only borrowers have no firm plans as to how to repay.

Others may not be aware they have an interest only loan.

APRA came to this late but has since specified tighter lending criteria, for example, a 20% hair cut on rental streams, the need to ignore any potential tax breaks, and the requirements to assess a loan on a principal and repayment basis on review (which often is a 5-year fixed term).

In addition, lenders are required to document the firm plans a borrower has to repay later.

So we estimate around $120 billion of ~$700 billion interest only loans will not be refinanced on next reset, requiring the borrower to agree to a more expensive principal and interest loans (monthly repayments would rise by 20% or more).

Most of these problem loans will hit in the next 2 -3 years.

Whilst there are some mitigating offsets – for example that the interest rate on a principal and interest loan are lower – this has the potential to become a structural issue for investors in Australia.

Some will be forced to sell, as happened in the UK when they executed a similar strategy a few years ago.

So Advisers need to consider whether borrowers have firm repayment plans, can service the loan assessed on a principal and interest basis, and the implication of the 20% haircut on rental streams.

Some potential borrowers may not meet current requirements, and risk being sold unsuitable loans, with the potential of litigation later.

Chris: Based off your industry analysis what do you expect from the housing market in the next 12 to 24 months. Will it grow, will it contract, or will it remain steady and how by what percentage do you expect the market to shift? 

Martin: My central scenario is home prices will fall 15-20% over the next couple of years as lending rules are tightened, thus reducing credit availability.

Credit is by far the strongest influence of home price movements.

Demand from investors, both local and foreign buyers, is falling, and while there is a small uptick in first time buyers, this is not sufficient to keep prices going higher.

Migration alone won’t hold the market up. We have already see a fall in auction clearance rates to mid-50’s down from mid-70’s last year.

Our worst case scenario is a fall of up to 40%, with the top of the market dropping the fastest.

It is unlikely that extra incentives to, for example first time buyers will change this outcome.

Thus we expect building approvals to be weaker in the months ahead.

Chris: A follow on from the above, do you expect the movement in the housing market will be uniformed across Australia or do you expect some capital cities or regional areas to buck the trend?

Martin: Prices will fall fastest in Sydney, then Melbourne, where rises have been strong in recent years, but because of the size of these relative markets, there will be a spill over effect elsewhere.

Regional prices, which have not risen so fast recently may be more resilient.

We do not expect Perth, which has languished in recent years to buck the national trends.

Chris: The Australian property market is quite diverse regarding who owns property, you have retirees, mums and dads, first home buyers, investors and many more.Which demographic do you think is most at risk in the current market and why?

Martin: Property investors are most at risk, and most fickle in a down turn. We are already seeing some selling before prices fall further, especially in Sydney.

In addition, prospective investors are sitting on the sidelines believing that prices will fall further.

There are more than 1.2 million down traders – people seeking to sell to release capital, and these are a risk, if prices fall.

Many need to sell to fund their retirement, or other investments.

First time buyers need to be careful buying in at the top of the market. They might prefer to wait to prices to fall further, as we think they will.

People living in a property, wishing to move, however should still do so, assuming the market is not frozen, because the value of one house, is the value of one house.

If you sell and buy at the same time, the relative movement of prices is less significant.

Finally, those seeking to trade up, to buy a larger place, may prefer to wait, again because relatively the top end of the market is likely to fall fastest.

Chris: Final question for the day – You have been involved in Financial sector for over 25 years now, if you could go back in time and give yourself once piece of advice when you first started out, what would that advice be? 

Martin: First, understand the power of compounding – interest on interest – time in market is your friend. So be in the market, and stay in the market.

Second, no one knows the future – it’s all a guess, and mostly people will be wrong. This includes the experts. Be skeptical.

Third, fees in particular erode returns, and so do consider ongoing fees and charges – even small changes to fees have a significant impact on results.

Fourth – build a cash flow so you understand your finances – only half of households have any real sense of their net available cash flow after outgoings. You cannot manage what you do now know.

Finally, diversify – do not just bet on say property or shares, best to spread the risk. And keep some funds liquid so you are not forced to transact in a falling market.


Derivative Risks In The Australian Banking System

There is a chart doing the rounds courtesy for the CEC (an Australian Political Party, who is advocating the introduction of a Glass Steagall banking separation bill, and which is likely to tabled late June) which shows that the total value of financial derivatives in Australia is around $37 trillion dollars.

I have had a number of people ask about this data, which is not attributed. What does it show, and is it right?

Well the short answer is easy. Derivatives are used quite extensively by many sectors of the Australian economy. The data comes from the RBA series B2  BANKS – OFF-BALANCE SHEET BUSINESS.  This lists out Banks’ off-balance balances by category.  The major component relates to interest rate derivatives, mainly over the counter (OTC) – meaning they are not exchange based transactions, but are bespoke hedges, either for their customers or trading on their own behalf with other banks, or both. Thus they may be speculative in nature, as traders are taking positions in the market. Over the years the treasury operations of banks have become a profit centre in their own right!

The RBA data shows the range of products, but the largest by far relate to interest rate swaps, which converts a fixed interest rate into a floating interest rate or vice versa.  This offers protection against rate fluctuations, and the opportunity for speculative position taking. A large part of the turnover in both foreign exchange and interest rate derivatives markets is inter-bank activity, with these institutions hedging positions built up through market-making activity, or for proprietary purposes. According to data from the Bank for International Settlements (BIS), around 70 per cent of total turnover reported by Australian-located counterparties is undertaken with another bank, either domestically or offshore.

Looking in more detail, across the various instruments, there are more than $22.7 trillion of swaps are out there, plus other interest rate vehicles, as well as a smaller volume of foreign exchange contracts. These are the principal amounts of the instrument. By the way, the options contracts can be more risky depending whether you hold a put or a call option – but that’s another story.

The bulk of the transactions are interest rate related.  But it is worth noting as the RBA did in 2011, that “because redundant OTC derivatives positions are not generally closed out (unlike exchange-traded derivatives), turnover volumes result in a significant build-up of gross outstanding positions for dealers. This notional amount is a much larger figure than the estimated market value of these positions. The bulk of this build-up is due to interest rate derivatives, reflecting both the longer maturity of many interest rate derivatives contracts, and the heavy utilisation of these as hedging instruments by banks and their counterparties. Foreign Exchange derivatives comprise a smaller, though still significant, share. The relatively slower build-up in these positions over time largely reflects the much shorter duration of many FX instruments (in general, these may last only a few days or weeks, compared with many months and years for interest rate derivatives). The interdependencies of counterparties and operational complexities resulting from the build-up of these positions are prime reasons why some central clearing of these positions is desirable”.

The main dealers in Australia include, ANZ, Bank of America–Merrill Lynch, Bank of Tokyo-Mitsubishi, Barclays Capital, BNP Paribas, Citi, CBA, Deutsche Bank, Goldman Sachs, HSBC, J.P. Morgan, Macquarie Group, National Australia Bank, Royal Bank of Canada, UBS, and Westpac.

Just to confuse the picture a bit more, data from DTCC Data Repository (Singapore) Pte. Ltd. (DDRS), says OTC derivatives notional outstanding in Australia totaled $42.3 trillion as of June 30, 2017. Interest Rate Derivatives totaled $34.7 trillion and accounted for 82% of notional outstanding. Foreign Exchange derivatives comprised $7.3 trillion (17% of notional outstanding) and credit derivatives totaled only $264.1 billion. This is because OTC derivatives are used by parties other than banks of course, so the number is larger than the RBA bank series.

Australian Financial Markets Association (AFMA) is another data source. It was formed in 1986 and is “the leading industry association promoting efficiency, integrity and professionalism in Australia’s financial markets” according to their web site.  They have more than 110 members, from Australian and international banks, leading brokers, securities companies and state government treasury corporations to fund managers, energy traders and industry service providers. The latest data from AFMA, which was included in their 2017 report says that OTC notional outstanding in Australia was $47.2 trillion, again with interest rates instruments the main element.

But, which ever way you look at it, the numbers are large.

But, we cannot stop there. To try to get to grips with the bigger picture, lets look at the latest data from the BIS – The Bank For International Settlements, the Bankers Banker. They produce massive volumes of statistics including a series on derivatives.  Their latest data is to December 2017 and they show that globally the nominal value of Over The Counter (OTC) derivatives has since 2015 has fluctuated in a range between about $480 trillion and $550 trillion. Notional amounts remained in this range in the second half of 2017, ending the year at $532 trillion. On a comparable basis, Australia would comprise about about $31.5 trillion of this, or about 6% of the total, although the RBA notes that data sourced from AFMA and BIS are not strictly comparable, in part due to differences in the data collection basis, and different categorisations of the Australian operations of foreign banks.

Globally, this is down from the $US710 trillion at the end of 2013, which was a 12 per cent increase on the year before. The longer term trend however shows the significant growth over the medium term. Relativity, Australian exposures are growing. But just how much is an interesting question.

Then we need to ask whether the notional amounts outstanding are a  meaningful number, because these turnover figures measure the notional principal of contracts. Because of the derivative nature of these transactions, the full principal is generally not exchanged at the time the transaction is initiated, nor might it ever be exchanged over the lifetime of the contract. This is unlike transactions in securities such as equities or bonds, where the full amount of consideration is exchanged at the time the transaction is settled.

There is another way to look at the exposure. That is through the lens of bought and sold positions.  The BIS says the sum of the absolute values of all outstanding derivatives contracts with either positive or negative replacement values evaluated at market prices prevailing on the reporting date gives us the gross market value.  Globally, the gross market value of outstanding OTC derivatives contracts fell to $11 trillion at end-2017, its lowest level since 2007. The share of centrally cleared credit default swaps (CDS) rose to 55% at end-2017, as central clearing made further inroads.

So you might net off the exposures, positive and negative, to get a baseline netted position. In a balanced position the exposures may be quite small, but changes in relative rates may create much larger exposures without much notice. Thus in a volatile market these exposures could be larger than anticipated, which creates the risks in the system.

The RBA said in 2010, the estimated market value of cross-sectoral bought (or sold) positions across all derivatives classes (both exchange traded and OTC) was around $350 billion, as opposed to the $15 trillion dollars notional exposure. The largest component of this was positions bought and sold between domestic financial institutions and offshore counterparties (largely financial institutions). However, the public sector and the non-financial corporate sector are also significant users, each with around $30 billion of bought and sold positions outstanding as at December 2010.

So the exposures can range from trillions of dollars to a few billions. It all depends what you mean by “exposures” in the first place.

And this is where it gets tricky. Banks have an obligation to assess their off-balance sheet exposures and use APRA approved formulations to discount the total exposures back to those which may appear in the balance sheet. Does APRA get inside these figures or validate them. We suspect not, leaving it to the accountants who work with the banks. An APRA spokesman after the GFC said, said: “We are not in the business of running banks, we are in the business of supervising them”, adding that the role of APRA was to set standards that the banks agreed to abide by.

But as we have described  the exposures are highly leveraged, and in a time of crisis, these smaller deeply discounted exposure values may be insufficient to handle the demands from the derivatives they hold. If so, and in a crisis, a bank may find their exposures escalate and it might swamp their balance sheet, meaning that the other operations, including loans and deposits may get caught up.

This is especially relevant, because in the current environment, with interest rates shifting between the USA and Australia, as shown by the BBSW chart, (rates have move up around 30 basis points since February) things could get interesting.

And this is the point, banks who play in the derivatives area actually have additional risks in their business, which are not knowable, but potentially large. In a crisis, it risks the rest of the business. There is no ring fence.

And this is where Glass-Steagall comes in, because this legislation would separate the trading operations from core banking operations, and protect depositors as a result. The current “all mixed up” universal banks are totally exposed.

But such a change would also have an immediate impact on both the profitability and capability of banks, which is why they will resist any such move, despite it now being proposed in Italy, and already in existence in some form in China.

The bottom line is the $37 trillion is a good representation of the current gross exposures in our banking system, and this dwarfs the banks’ current balance sheets, and the countries total economy.  The risks are literally enormous, and in a system-wide banking crash, when multiple parties are exposed, a bail-out if required would likely have profound economic effects.  It might be enough to swamp the entire economy. That’s how big the potential risks are. That’s why Glass-Steagall is worth pursuing.


NSW budget fails home buyers: REINSW

From The Real Estate Conversation.

The NSW Government has failed to address stamp duty rates in yesterday’s budget, which haven’t been updated in 32 years.

Despite the housing affordability crisis being labeled as “the biggest issue” for people in NSW less than two years ago, there was little announced to address the issue at the state budget on Tuesday.

Soaring house prices in recent years saw a $4.3 billion housing affordability package put front and centre in last year’s budget.

This included measures to help out first-home buyers, such as abolishing stamp duty on properties under $650,000, and a number of other measures making it harder for investors and foreign buyers to purchase property.

Sydney house prices took their biggest hit since 2015 this year, with a 2.6 per cent drop over the last quarter.

And now that the housing market is cooling off, the NSW government appears to have halted new measures to improve housing affordability altogether.

“Over the past 12 months housing cooled more quickly than previously forecast,” Treasurer Dominic Perrottet said in his budget speech yesterday.

What the 2018 NSW budget means for property at a glance:

  • The First Home Owner Grant will more than double to $15,000 for first-time buyers of new property. From 2024, the grant will drop to $10,000.
  • The $7000 First Home Owner Grant will be abolished for existing properties.
  • First home buyers will continue to be exempt from stamp duty if buying new property. The threshold lifts from $600,000 to $650,000.
  • Non-first home buyers will be eligible for a $5000 grant if buying new property.
  • $481 million allocated to a Housing Acceleration Fund to build infrastructure in areas of housing growth in an effort to assist the supply of new housing.
  • Ten projects costing $181 million have already been identified in eight areas of housing growth, which will together support 76,000 new homes. These areas are: Camden/Liverpool, Blacktown, The Hills, Hornsby/Parramatta, City of Sydney, Wollongong, Wyong, Port Macquarie-Hastings.

REINSW CEO Tim McKibbin said the government collected $8.673 billion in stamp duty, $1billion less than 2016-17.

“The number of transactions has fallen and will continue to fall because people aren’t buying and selling real estate,” Mr. McKibbin said.

“The Budget forecasts $6 billion less than previously budgeted in stamp duty over the next four years but an increase by $407.6 million in land tax from stronger forecasts for land values,” Mr McKibbin said.

“Taxation is driving the market into the ground. It is fiscally naive, irresponsible and unconscionable not to reduce the stamp duty rates.

“There is empirical evidence that shows reducing taxation will increase the number of transactions and therefore it is a win – win. Government will get additional revenue and the consumer will get a more affordable product.

“The government can save a lot of time and money consulting the community on how to solve housing affordability – the answer to affordability is increasing supply and reducing property taxes,” he said.

Mortgage Industry In Rotation, Some Would Say In A Spin

AFG has released their latest market report to May 2018.  This may be a somewhat myopic picture, given it looks at business written via AFG. It also only gives a relative share so tells us nothing about total volumes written (which will be down across the board in our view).  AFG white label products continue to grow to 11.7% of their flows in May, ahead of Westpac (9.4%) and NAB (9.5%).

The AFG Competition Index released today shows further evidence of a structural shift in the Australian lending market as non-major lenders again seize market share from the majors. Non-major lenders have seen their overall market share of new loans hit a record 40.97% in May 2018.

AFG General Manager – Broker & Residential, Mark Hewitt explained the results: “The major lenders’ share of new business is declining, with their overall market share continuing a five-month slide to be sitting at 59% at the end of last month.

Among the majors Westpac and its subsidiaries Bank of Melbourne, Bank SA and St George have been hardest hit, with each of their brands recording a drop in market share.

The borrowers turning to non-major lenders in greatest numbers are those seeking to fix their interest rates, with market share for the non-majors in this category steadily increasing to finish the quarter at 32.57%.

“ING and Suncorp are the non-major lenders of choice for fixed products, with their share of the fixed rate market sitting at 6.08% and 5.39% respectively.

“The major lenders have been pulling back from the investor market to meet regulatory caps and as a result the non-majors are filling the gap in the market,” said Mr Hewitt. “Non-major market share among investors rose from 33.52% in February to 42.35% at the end of the quarter – an increase of 26%.

“Macquarie is proving popular with those looking to refinance, recording a market share overall of 5.63% but 8.33% in the refinancing category. Virgin Money has made rapid inroads in the short time they have been on AFG’s panel, with their share of the market in the same category rising from 0.1% to 0.86% in three months.


DFA analysis of the AFG data also shows the non banks like Pepper Money are growing relative to other players, which confirms our thesis that the non-banks are making hay as the markets rotate.

“First home buyers looking for a simple, low cost mortgage product have found it in AFG Home Loans with market share for AFG’s white label products rising across the quarter for this category from 4.76% in February to finish at 6.3% by the end of May. Teachers’ Mutual Bank also recorded an increase in market share among first home buyers, lifting from 2.8% to 3.14% for the quarter.

These figures show that competition is alive and well in the Australian lending market. The continued preference by consumers for mortgage brokers and the choice they deliver over major bank branches, demonstrates that brokers are delivering the right consumer outcomes,” he concluded.


BBSW Signals More Bank Funding Pressures

The latest BBSW rates have moved higher again in response to the higher US rates, and local uncertainty in the banking sector. The key 3-month rate is around 30 basis points above its February lows.

This puts more pressure on the banks in terms of margin erosion.  As we said recently:

… we think something else is going on, because the spreads in Australia are a lot bigger now than other markets, and we suspect it’s a lack of confidence in our local banks, thanks to the revelations from the Royal Commission. A quick look at the recent share prices of for example Westpac, the largest investment loan lender…

  … and CBA the largest owner occupied loan lender tells the story.

 The markets are nervous. The pincer movements of higher funding, less confidence and a slowing and more risky housing market are all adding to the banks’ woes. They are stuck because any lift in mortgage rates will drive prices lower and lift defaults from overleveraged households.

Actually this is the reason why we think the RBA may be forced to cut the cash rate ahead.

A nasty cocktail.


Payday Pain Still Grips

Since the Government released the report of the Independent Panel’s Review of the Small Amount Credit Contract Laws in April 2016, three million additional loans have been written, worth an estimated $1.85 billion and taken by some 1.6 million households.

In that time, around one fifth of borrowers or around 332,000 households, were new payday borrowers.

We also know that over a 5-year period around 15% of payday borrowers will get into a debt spiral which leads to events such as bankruptcy. On that basis, an additional 249,000 households have been allowed to enter a debt path which leads to this unfortunate end. A larger number fall into other family or relationship issues when borrowing from this source.

Digital Finance Analytics was asked by the Consumer Action Law Centre to complete custom modelling using data contained in our rolling 52,000 per annum household surveys, focussing in on the question of the quantum and impact of delays in the proposed legislation relating to the sector.

Specifically, we estimated the incremental damage done to households in terms of the value of loans taken since the final review was published on 19th April 2016, as well as some observations as to the characteristics of borrowers over this period.

The data presented is this paper is somewhat indicative, in that we made a number of reasonable assumptions to support our findings.

  1. The survey remains as statistically robust sample (aligns with the most recent ABS census data).
  2. We have extrapolated 2018 figures on the current run rates per month.
  3. We have not tried to overlay the potential before and after impacts, had the proposed changes been made to payday sector, but we have considered the mix and impact of loans taken during this time.
  4. We use the term “payday loans” to refer to those loans made within the SACC (Small Amount Credit Contract) legislation, so this excludes medium term loans and other personal credit facilities.

The Current Size of the Payday Market

We continue to see some growth in the payday sector overall.

In 2016, the total loans written (loan flows) were in the order of $736 million and based on projections for the full year 2018, this will rise to $925 million. However, because payday lending is by nature short term, the incremental value of $189 million is not the full measure of loans written in the period. We will estimate this later in the paper.

Of note is the significant increase in online origination, with 83% of loans now accessed via a web site on a mobile device or another computing device.
The other important factor is to note the switch in types of customers being attracted by these services. As a result of tighter controls on loans to Centrelink recipients, and the rise in online services, the mix between those we classify as financially distressed (those with immediate financial needs and no alternative) and financially stressed (those with financial needs, with alternatives, but who reach for payday loans as a simple, quick and confidential alternative) has increased, and is facilitated by greater online access.

Since 2016, the total loan flows have risen by $191 million for financially stressed, but the value of loans to distressed households has remained static. But again the net value of loans does not tell the full story.

The Number of Households with Payday Loans

Value apart, the other perspective is the number of households taking payday loans. Since 2016, the number has risen by 149,000 households. Of that 13,000 are classified as distressed households and 136,000 are stressed households.

This once again reflects the refocussing of the industry of those in financial pain rather than distress. Within these numbers we note a continued rise in the number of women accessing payday loans. The number of women using payday loans has risen from 177,000 in 2016 to 226,000 in 2018. This represents a rise to 22.18% of all borrowers.

Within the women segment we see a large number of one-parent women accessing payday loans, representing 40% of women.

This is in stark contrast to males where just 6% are one-parent families.

How Many Loans, and What Value Has Been Written Since 2016?

The final part of our analysis we examined the run rate of loans written by volume and value to assess the impact of the Government inaction since April 2016.

Since April 2016 and June 2018, just over 3 million discrete payday loans have been written, worth in total around $1.85 billion by around 1.6 million households. These loans would have generated something in the order of $250 million in net profit to the lenders.

In that time, around one fifth of borrowers will be new borrowers, or around 332,000 households. We also know that over a 5-year period around 15% of payday borrowers get into a debt spiral which leads to events such as bankruptcy. On that basis, an additional 249,000 households have been allowed to enter a debt path which leads to this unfortunate end. A larger number fall into other family or relationship issues.